Workshop Facilitation
UK

The following table provides summary statistics for permanent job vacancies with a requirement for Workshop Facilitation skills. Included is a benchmarking guide to the salaries offered in vacancies that have cited Workshop Facilitation over the 6 months to 28 November 2023 with a comparison to the same period in the previous 2 years.

6 months to
28 Nov 2023
Same period 2022 Same period 2021
Rank 310 241 284
Rank change year-on-year -69 +43 +52
Permanent jobs citing Workshop Facilitation 538 1,970 1,655
As % of all permanent jobs advertised in the UK 0.99% 1.57% 1.29%
As % of the Processes & Methodologies category 1.05% 1.64% 1.35%
Number of salaries quoted 393 1,155 1,003
10th Percentile £41,250 £41,250 £37,500
25th Percentile £50,000 £47,500 £44,500
Median annual salary (50th Percentile) £65,000 £57,500 £57,500
Median % change year-on-year +13.04% - -1.71%
75th Percentile £77,500 £73,750 £73,750
90th Percentile £87,250 £85,000 £88,750
UK excluding London median annual salary £57,500 £52,500 £50,000
% change year-on-year +9.52% +5.00% -

All Process and Methodology Skills
UK

Workshop Facilitation is in the Processes and Methodologies category. The following table is for comparison with the above and provides summary statistics for all permanent job vacancies with a requirement for process or methodology skills.

Permanent vacancies with a requirement for process or methodology skills 51,121 120,104 122,523
As % of all permanent jobs advertised in the UK 94.09% 95.72% 95.43%
Number of salaries quoted 36,956 73,203 81,032
10th Percentile £32,500 £34,313 £32,500
25th Percentile £43,750 £45,000 £42,500
Median annual salary (50th Percentile) £60,000 £60,000 £59,000
Median % change year-on-year - +1.69% +7.27%
75th Percentile £80,000 £81,250 £77,500
90th Percentile £98,750 £100,000 £95,000
UK excluding London median annual salary £52,500 £53,000 £50,000
% change year-on-year -0.94% +6.00% +4.17%

Workshop Facilitation
Job Vacancy Trend

Job postings citing Workshop Facilitation as a proportion of all IT jobs advertised.
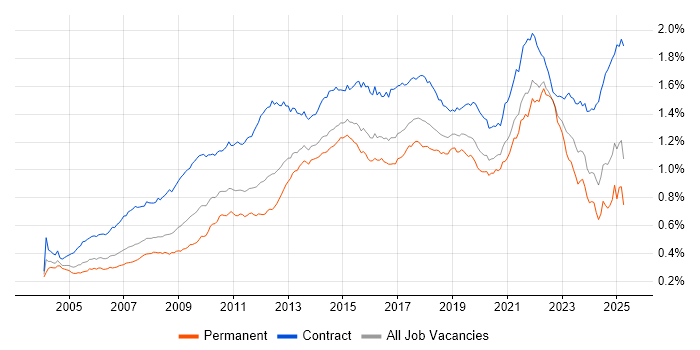
Job vacancy trend for Workshop Facilitation in the UK

Workshop Facilitation
Salary Trend

3-month moving average salary quoted in jobs citing Workshop Facilitation.

Salary trend for Workshop Facilitation in the UK

Workshop Facilitation
Salary Histogram

Salary distribution for jobs citing Workshop Facilitation over the 6 months to 28 November 2023.

Salary histogram for Workshop Facilitation in the UK

Workshop Facilitation
Top 16 Job Locations

The table below looks at the demand and provides a guide to the median salaries quoted in IT jobs citing Workshop Facilitation within the UK over the 6 months to 28 November 2023. The 'Rank Change' column provides an indication of the change in demand within each location based on the same 6 month period last year.

Location Rank Change
on Same Period
Last Year
Matching
Permanent
IT Job Ads
Median Salary
Past 6 Months
Median Salary
% Change
on Same Period
Last Year
Live
Jobs
England -74 475 £65,000 +13.04% 252
London -24 270 £65,000 - 129
Work from Home -29 225 £65,000 +13.04% 120
UK excluding London -90 224 £57,500 +9.52% 140
North of England -31 72 £57,500 +4.55% 37
North West +28 55 £57,500 +4.55% 19
South East +33 40 £56,250 +7.14% 43
South West -23 36 £60,000 +11.11% 24
Midlands -7 32 £62,500 +19.05% 13
West Midlands -12 24 £65,000 +25.11% 11
Wales +12 18 £37,500 -14.11% 3
Yorkshire -10 17 £57,896 +5.27% 13
East of England +97 16 £46,500 -31.11% 8
Scotland +26 11 £67,788 +35.58% 12
East Midlands +29 8 £50,000 -4.76% 2
Isle of Man - 2 £60,000 -

Workshop Facilitation
Co-occurring Skills and Capabilities by Category

The follow tables expand on the table above by listing co-occurrences grouped by category. The same employment type, locality and period is covered with up to 20 co-occurrences shown in each of the following categories:

Application Platforms
1 10 (1.86%) SharePoint
2 6 (1.12%) Confluence
3 5 (0.93%) IIS
4 2 (0.37%) MS Exchange
Applications
1 23 (4.28%) Microsoft Excel
2 21 (3.90%) MS Visio
3 16 (2.97%) Microsoft PowerPoint
4 9 (1.67%) Microsoft Office
5 8 (1.49%) InfoPath
6 6 (1.12%) Sketch
7 4 (0.74%) Adobe XD
7 4 (0.74%) Microsoft Project
8 2 (0.37%) InVision
9 1 (0.19%) Trello
Business Applications
1 33 (6.13%) Endur
2 14 (2.60%) SAP S/4HANA
3 9 (1.67%) Dynamics CRM
3 9 (1.67%) SAP CO
3 9 (1.67%) SAP FI
3 9 (1.67%) SAP FI/CO
4 5 (0.93%) Sage X3
5 4 (0.74%) Primavera
6 3 (0.56%) SAP SD
7 2 (0.37%) OpenLink RightAngle
7 2 (0.37%) Remedy ITSM
7 2 (0.37%) SAP BRIM
7 2 (0.37%) SAP Hybris
7 2 (0.37%) SAP IS-U
7 2 (0.37%) SAP MDM
7 2 (0.37%) SAP MM
7 2 (0.37%) SAP PSCD
8 1 (0.19%) Oracle ERP
8 1 (0.19%) SAP MDG
8 1 (0.19%) Temenos T24
Cloud Services
1 51 (9.48%) Azure
2 35 (6.51%) Power Platform
3 25 (4.65%) Azure DevOps
4 20 (3.72%) Dynamics 365
5 17 (3.16%) PowerApps
6 16 (2.97%) Microsoft 365
7 13 (2.42%) AWS
8 12 (2.23%) SaaS
9 10 (1.86%) Figma
9 10 (1.86%) Power Automate
10 9 (1.67%) dbt
11 6 (1.12%) SuccessFactors
12 4 (0.74%) Cohesity
13 3 (0.56%) Miro
14 2 (0.37%) Amazon CloudWatch
14 2 (0.37%) Amazon Glacier
14 2 (0.37%) AWS KMS
14 2 (0.37%) Azure Logic Apps
14 2 (0.37%) Virtual Private Cloud
14 2 (0.37%) WhatsApp
Communications & Networking
1 6 (1.12%) Cisco ISE
1 6 (1.12%) Cisco Nexus
1 6 (1.12%) Internet
1 6 (1.12%) Intranet
1 6 (1.12%) LAN
1 6 (1.12%) SD-WAN
1 6 (1.12%) WAN
2 5 (0.93%) Structured Cabling
3 4 (0.74%) VPN
4 3 (0.56%) Multicast
4 3 (0.56%) NGFW
5 2 (0.37%) DNS
5 2 (0.37%) FTP
5 2 (0.37%) HTTP
5 2 (0.37%) SMTP
5 2 (0.37%) Software-Defined Radio
5 2 (0.37%) SSH
6 1 (0.19%) Firewall
6 1 (0.19%) SNA
6 1 (0.19%) SSL
Database & Business Intelligence
1 45 (8.36%) SQL Server
2 31 (5.76%) Relational Database
3 22 (4.09%) RDBMS
4 19 (3.53%) Power BI
5 8 (1.49%) DB2
6 5 (0.93%) Crystal Reports
7 4 (0.74%) Data Lake
7 4 (0.74%) Data Warehouse
8 3 (0.56%) Tableau
9 2 (0.37%) Amazon RDS
9 2 (0.37%) NoSQL
9 2 (0.37%) Oracle Reports
9 2 (0.37%) SQL Server Reporting Services
10 1 (0.19%) Azure SQL Database
10 1 (0.19%) Electronic Patient Records
10 1 (0.19%) MongoDB
10 1 (0.19%) MS Access
10 1 (0.19%) Oracle Database
10 1 (0.19%) PostgreSQL
10 1 (0.19%) SQL Server Integration Services
Development Applications
1 17 (3.16%) JIRA
2 8 (1.49%) Git
2 8 (1.49%) Visual Studio
3 7 (1.30%) Team Foundation Server
4 3 (0.56%) Jenkins
4 3 (0.56%) Sonatype Nexus
5 2 (0.37%) Axure RP
5 2 (0.37%) Subversion
5 2 (0.37%) Vagrant
6 1 (0.19%) Balsamiq
6 1 (0.19%) ERwin
General
1 174 (32.34%) Social Skills
2 152 (28.25%) Finance
3 90 (16.73%) Analytical Skills
4 51 (9.48%) Marketing
5 44 (8.18%) Banking
6 42 (7.81%) Presentation Skills
7 37 (6.88%) Public Sector
8 32 (5.95%) Retail
9 22 (4.09%) Games
10 17 (3.16%) Legal
10 17 (3.16%) Manufacturing
11 14 (2.60%) Inclusion and Diversity
12 12 (2.23%) Law
13 9 (1.67%) Investment Banking
13 9 (1.67%) Organisational Skills
13 9 (1.67%) Telecoms
14 7 (1.30%) Influencing Skills
15 6 (1.12%) Billing
16 5 (0.93%) Electronics
17 4 (0.74%) Back Office
Job Titles
1 222 (41.26%) Analyst
2 199 (36.99%) Business Analyst
3 92 (17.10%) Senior
4 68 (12.64%) Consultant
5 66 (12.27%) Project Manager
6 48 (8.92%) Lead
7 39 (7.25%) Architect
8 32 (5.95%) Senior Analyst
8 32 (5.95%) Senior Business Analyst
9 25 (4.65%) Senior Manager
10 22 (4.09%) Product Owner
11 21 (3.90%) Designer
11 21 (3.90%) Lead Product Owner
12 19 (3.53%) Business Consultant
13 18 (3.35%) Lead Business Analyst
14 16 (2.97%) Business Change Consultant
14 16 (2.97%) Change Consultant
14 16 (2.97%) Developer
15 14 (2.60%) Technical Analyst
15 14 (2.60%) Technical Business Analyst
Libraries, Frameworks & Software Standards
1 21 (3.90%) .NET
2 9 (1.67%) CSS
2 9 (1.67%) HTML
3 8 (1.49%) .NET Framework
3 8 (1.49%) ASP.NET
4 3 (0.56%) CSS3
4 3 (0.56%) HTML5
4 3 (0.56%) SOAP
4 3 (0.56%) XML
5 2 (0.37%) EDI
5 2 (0.37%) React
5 2 (0.37%) XSD
6 1 (0.19%) ARM Templates
6 1 (0.19%) EDIFACT
6 1 (0.19%) IDoc
6 1 (0.19%) jQuery
6 1 (0.19%) LDAP
6 1 (0.19%) SAP ALE
6 1 (0.19%) Sass
6 1 (0.19%) Web Services
Miscellaneous
1 57 (10.59%) Product Ownership
2 34 (6.32%) Management Information System
3 29 (5.39%) Public Cloud
4 23 (4.28%) Self-Motivation
5 22 (4.09%) Swaptions
6 15 (2.79%) Housing Association
7 10 (1.86%) Data Centre
7 10 (1.86%) Data Structures
8 9 (1.67%) Robotics
9 8 (1.49%) Reference Data
10 7 (1.30%) Reinsurance
10 7 (1.30%) Virtual Team
11 6 (1.12%) Mobile App
12 5 (0.93%) Cloud Native
13 4 (0.74%) Enterprise Software
13 4 (0.74%) FMCG
13 4 (0.74%) Legacy Systems
13 4 (0.74%) NHS
14 3 (0.56%) Graphic Design
14 3 (0.56%) Onboarding
Operating Systems
1 19 (3.53%) Windows
2 9 (1.67%) Linux
3 8 (1.49%) Windows Server
4 7 (1.30%) Windows 10
5 5 (0.93%) Windows Server 2012
5 5 (0.93%) Windows Server 2019
6 3 (0.56%) VMS
7 1 (0.19%) MVS
Processes & Methodologies
1 223 (41.45%) Agile
2 136 (25.28%) Business Analysis
3 105 (19.52%) Project Management
4 88 (16.36%) Stakeholder Management
5 87 (16.17%) Roadmaps
6 84 (15.61%) Coaching
7 79 (14.68%) User Stories
8 78 (14.50%) Project Delivery
9 72 (13.38%) Requirements Gathering
10 71 (13.20%) Continuous Improvement
10 71 (13.20%) Problem-Solving
11 69 (12.83%) Mentoring
12 68 (12.64%) Artificial Intelligence
12 68 (12.64%) Business Case
13 61 (11.34%) Waterfall
14 60 (11.15%) Business Strategy
15 49 (9.11%) CRM
15 49 (9.11%) User Acceptance Testing
16 48 (8.92%) Business Transformation
17 47 (8.74%) IT Strategy
Programming Languages
1 29 (5.39%) Java
2 23 (4.28%) SQL
3 22 (4.09%) VB
4 20 (3.72%) C#
5 14 (2.60%) Python
6 8 (1.49%) PL/SQL
6 8 (1.49%) T-SQL
6 8 (1.49%) VB.NET
7 6 (1.12%) JavaScript
8 2 (0.37%) C
8 2 (0.37%) C++
8 2 (0.37%) Groovy
8 2 (0.37%) Perl
8 2 (0.37%) Ruby
9 1 (0.19%) ABAP
9 1 (0.19%) Bicep
Qualifications
1 93 (17.29%) Security Cleared
2 78 (14.50%) Degree
3 61 (11.34%) DV Cleared
4 37 (6.88%) SC Cleared
5 6 (1.12%) CCNP
5 6 (1.12%) Cisco Certification
5 6 (1.12%) Computer Science Degree
5 6 (1.12%) ISEB
6 5 (0.93%) ITIL Foundation Certificate
7 4 (0.74%) DBS Check
7 4 (0.74%) IIBA
7 4 (0.74%) Master's Degree
7 4 (0.74%) PRINCE2 Practitioner
8 3 (0.56%) APMP
8 3 (0.56%) AWS Certification
8 3 (0.56%) Azure Certification
8 3 (0.56%) BPSS Clearance
8 3 (0.56%) CCA
8 3 (0.56%) ITIL Certification
8 3 (0.56%) PRINCE2 Certification
Quality Assurance & Compliance
1 39 (7.25%) QA
2 29 (5.39%) PMO
3 8 (1.49%) Accessibility
4 6 (1.12%) Data Quality
5 2 (0.37%) Actionable Recommendations
5 2 (0.37%) WCAG
6 1 (0.19%) COBIT
6 1 (0.19%) ISO 20022
6 1 (0.19%) ISO/IEC 15288
System Software
1 11 (2.04%) Active Directory
2 5 (0.93%) vSphere
3 4 (0.74%) Hyper-V
3 4 (0.74%) VMware ESXi
3 4 (0.74%) VMware Infrastructure
4 1 (0.19%) Docker
4 1 (0.19%) Virtual Desktop
4 1 (0.19%) Virtual Machines
Systems Management
1 6 (1.12%) Cisco CUCM
2 5 (0.93%) Nessus
3 3 (0.56%) Terraform
3 3 (0.56%) ZABBIX
4 2 (0.37%) Microsoft Intune
4 2 (0.37%) Nagios
4 2 (0.37%) Progress Chef
5 1 (0.19%) Ansible
5 1 (0.19%) Kubernetes
Vendors
1 58 (10.78%) Microsoft
2 39 (7.25%) Oracle
3 36 (6.69%) SAP
4 25 (4.65%) OpenLink
5 22 (4.09%) Sybase
5 22 (4.09%) TIBCO
6 15 (2.79%) Salesforce
7 13 (2.42%) ServiceNow
8 9 (1.67%) VMware
9 7 (1.30%) Sage
10 6 (1.12%) Cisco
10 6 (1.12%) Meraki
11 5 (0.93%) Adobe
11 5 (0.93%) arcserve
11 5 (0.93%) Sophos
12 4 (0.74%) Dell
12 4 (0.74%) NetApp
12 4 (0.74%) Veeam
13 3 (0.56%) SolarWinds
14 2 (0.37%) Atlassian