Creative Problem-Solving Jobs with Hybrid/Remote/WFH Options

Creative Problem-Solving
UK > Work from Home

The table below provides summary statistics for permanent remote or hybrid work requiring Creative Problem-Solving skills. It includes a benchmarking guide to the annual salaries offered in vacancies that cited Creative Problem-Solving over the 6 months leading up to 2 May 2025, comparing them to the same period in the previous two years.

6 months to
2 May 2025
Same period 2024 Same period 2023
Rank 368 446 578
Rank change year-on-year +78 +132 +95
Permanent jobs citing Creative Problem-Solving 45 143 93
As % of all permanent jobs with a WFH option 0.30% 0.42% 0.22%
As % of the Processes & Methodologies category 0.32% 0.46% 0.23%
Number of salaries quoted 21 75 59
10th Percentile £31,250 £38,041 £35,998
25th Percentile £40,931 £45,105 £53,750
Median annual salary (50th Percentile) £60,743 £59,556 £85,000
Median % change year-on-year +1.99% -29.93% +17.24%
75th Percentile £67,500 £65,000 £107,500
90th Percentile £75,000 £92,000 £165,000
UK median annual salary £40,101 £55,000 £75,000
% change year-on-year -27.09% -26.67% +11.11%

All Process and Methodology Skills
Work from Home

Creative Problem-Solving falls under the Processes and Methodologies category. For comparison with the information above, the following table provides summary statistics for all permanent job vacancies with remote or hybrid options requiring process or methodology skills.

Permanent vacancies with a requirement for process or methodology skills 13,938 31,020 41,026
As % of all permanent jobs with a WFH option 93.13% 91.65% 96.09%
Number of salaries quoted 9,733 23,575 28,496
10th Percentile £30,000 £33,800 £37,500
25th Percentile £45,000 £42,500 £47,500
Median annual salary (50th Percentile) £60,000 £57,500 £62,500
Median % change year-on-year +4.35% -8.00% +4.17%
75th Percentile £77,500 £75,000 £82,500
90th Percentile £102,500 £95,000 £100,000
UK median annual salary £57,500 £55,000 £61,500
% change year-on-year +4.55% -10.57% +2.50%

Creative Problem-Solving
Trend for Jobs with a WFH Option

Job vacancies with remote working options citing Creative Problem-Solving as a proportion of all IT jobs advertised.
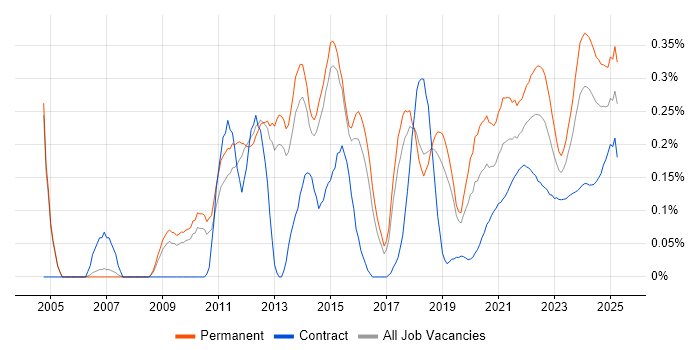
Creative Problem-Solving trend for jobs with Hybrid/Remote/WFH options

Creative Problem-Solving
Salary Trend for Jobs with a WFH Option

3-month moving average salary quoted in job vacancies with remote working options citing Creative Problem-Solving.

Creative Problem-Solving salary trend for jobs with a WFH option

Creative Problem-Solving
Salary Histogram for Jobs with a WFH Option

Salary distribution for jobs with remote working options citing Creative Problem-Solving over the 6 months to 2 May 2025.

Creative Problem-Solving salary histogram for jobs with a WFH option

Creative Problem-Solving
Co-occurring Skills and Capabilities with WFH Options by Category

The follow tables expand on the table above by listing co-occurrences grouped by category. The same employment type, locality and period is covered with up to 20 co-occurrences shown in each of the following categories:

Applications
1 6 (13.33%) Photoshop
2 3 (6.67%) Microsoft Excel
3 1 (2.22%) Adobe Creative Suite
3 1 (2.22%) Adobe Illustrator
3 1 (2.22%) Houdini
3 1 (2.22%) InDesign
Business Applications
1 1 (2.22%) Salesforce CRM
Cloud Services
1 6 (13.33%) AWS
2 5 (11.11%) Azure
2 5 (11.11%) Power Platform
3 3 (6.67%) GCP
4 2 (4.44%) Amazon EC2
4 2 (4.44%) Amazon S3
4 2 (4.44%) AWS CloudFormation
4 2 (4.44%) AWS CloudTrail
4 2 (4.44%) AWS Lambda
4 2 (4.44%) Serverless
4 2 (4.44%) Virtual Private Cloud
5 1 (2.22%) dbt
5 1 (2.22%) Dynamics 365
Communications & Networking
1 3 (6.67%) SMS
Database & Business Intelligence
1 6 (13.33%) Data Hub
1 6 (13.33%) MySQL
2 5 (11.11%) Power BI
2 5 (11.11%) Tableau
3 4 (8.89%) PostgreSQL
4 3 (6.67%) Data Lake
5 2 (4.44%) Amazon RDS
5 2 (4.44%) Amazon Redshift
5 2 (4.44%) Relational Database
6 1 (2.22%) Data Warehouse
6 1 (2.22%) SQL Server
Development Applications
1 2 (4.44%) Git
1 2 (4.44%) Vite
1 2 (4.44%) webpack
General
1 22 (48.89%) Social Skills
2 11 (24.44%) Finance
3 9 (20.00%) Analytical Skills
4 8 (17.78%) Banking
5 5 (11.11%) Brand Awareness
5 5 (11.11%) Organisational Skills
6 4 (8.89%) Czech Language
6 4 (8.89%) Marketing
7 3 (6.67%) Influencing Skills
8 1 (2.22%) Agriculture
8 1 (2.22%) Aviation
8 1 (2.22%) Games
8 1 (2.22%) Health Technology
8 1 (2.22%) Pharmaceutical
8 1 (2.22%) Retail
Job Titles
1 12 (26.67%) Developer
2 7 (15.56%) Senior
3 6 (13.33%) Full-Stack Developer
4 5 (11.11%) .NET Developer
4 5 (11.11%) Senior .NET Developer
4 5 (11.11%) Senior Developer
5 4 (8.89%) AWS Developer
5 4 (8.89%) Designer
5 4 (8.89%) Enterprise Sales Executive
5 4 (8.89%) Full-Stack JavaScript Developer
5 4 (8.89%) JavaScript Developer
5 4 (8.89%) Node.js Developer
5 4 (8.89%) Product Manager
5 4 (8.89%) Project Manager
5 4 (8.89%) Sales Executive
6 3 (6.67%) Campaign Manager
6 3 (6.67%) CRM Campaign Manager
6 3 (6.67%) CRM Manager
6 3 (6.67%) ERP Manager
6 3 (6.67%) SAP Manager
Libraries, Frameworks & Software Standards
1 6 (13.33%) jQuery
1 6 (13.33%) Node.js
1 6 (13.33%) Vue
2 5 (11.11%) .NET
2 5 (11.11%) .NET Framework
3 4 (8.89%) ASP.NET
3 4 (8.89%) Flutter
3 4 (8.89%) Middleware
3 4 (8.89%) React
3 4 (8.89%) Svelte
4 2 (4.44%) Bootstrap
4 2 (4.44%) CSS
4 2 (4.44%) CSS3
4 2 (4.44%) HTML
4 2 (4.44%) HTML5
4 2 (4.44%) Laravel
4 2 (4.44%) NumPy
4 2 (4.44%) Pandas
4 2 (4.44%) Sass
4 2 (4.44%) scikit-learn
Miscellaneous
1 5 (11.11%) Social Media
2 4 (8.89%) Mobile App
3 3 (6.67%) Algorithms
3 3 (6.67%) Virtual Team
4 1 (2.22%) Animation
4 1 (2.22%) Data Structures
4 1 (2.22%) Product Ownership
Operating Systems
1 4 (8.89%) Linux
Processes & Methodologies
1 45 (100.00%) Problem-Solving
2 18 (40.00%) Agile
3 13 (28.89%) Analytics
4 9 (20.00%) Actionable Insight
4 9 (20.00%) Continuous Improvement
4 9 (20.00%) Decision-Making
4 9 (20.00%) Stakeholder Engagement
4 9 (20.00%) Visualisation
5 8 (17.78%) Data Analytics
5 8 (17.78%) Data-Driven Decision Making
6 6 (13.33%) Data Analysis
6 6 (13.33%) Data Governance
6 6 (13.33%) Data Sharing
6 6 (13.33%) E-Commerce
6 6 (13.33%) Full-Stack Development
6 6 (13.33%) Web Development
6 6 (13.33%) WFM
7 5 (11.11%) DevOps
7 5 (11.11%) Project Management
7 5 (11.11%) Storytelling
Programming Languages
1 10 (22.22%) JavaScript
2 5 (11.11%) C#
3 4 (8.89%) TypeScript
4 3 (6.67%) SQL
5 2 (4.44%) PHP
5 2 (4.44%) Python
5 2 (4.44%) R
6 1 (2.22%) C++
Qualifications
1 7 (15.56%) DBS Check
1 7 (15.56%) Degree
2 3 (6.67%) PMP
3 2 (4.44%) AWS Certification
3 2 (4.44%) AWS Certified Developer
3 2 (4.44%) AWS Certified Solutions Architect
3 2 (4.44%) AWS Certified SysOps Administrator
4 1 (2.22%) Master's Degree
4 1 (2.22%) PhD
Quality Assurance & Compliance
1 4 (8.89%) QA
2 3 (6.67%) Accessibility
2 3 (6.67%) Actionable Recommendations
3 2 (4.44%) Data Quality
4 1 (2.22%) ISO/IEC 27001
System Software
1 2 (4.44%) Virtual Desktop
Systems Management
1 2 (4.44%) Terraform
Vendors
1 6 (13.33%) Adobe
2 5 (11.11%) Microsoft
3 4 (8.89%) HubSpot
4 3 (6.67%) Apple
4 3 (6.67%) Google
4 3 (6.67%) SAP
5 1 (2.22%) Perforce
5 1 (2.22%) Salesforce