Hybrid/Remote ITSM Job Trends

IT Service Management (ITSM)
UK > Work from Home

The table below provides summary statistics and salary benchmarking for remote or hybrid work requiring ITSM skills. It covers permanent job vacancies from the 6 months leading up to 12 November 2025, with comparisons to the same periods in the previous two years.

6 months to
12 Nov 2025
Same period 2024 Same period 2023
Rank 122 138 172
Rank change year-on-year +16 +34 +114
Permanent jobs citing ITSM 373 455 447
As % of all permanent jobs with remote/hybrid work options 2.37% 2.31% 2.05%
As % of the Processes & Methodologies category 2.57% 2.61% 2.16%
Number of salaries quoted 212 287 398
10th Percentile £29,325 £31,250 £33,250
25th Percentile £36,125 £37,500 £42,454
Median annual salary (50th Percentile) £55,000 £55,000 £62,500
Median % change year-on-year - -12.00% +8.70%
75th Percentile £76,563 £75,000 £79,313
90th Percentile £95,000 £96,250 £95,000
UK median annual salary £50,000 £52,000 £54,763
% change year-on-year -3.85% -5.04% +7.38%

All Process and Methodology Skills
Work from Home

ITSM falls under the Processes and Methodologies category. For comparison with the information above, the following table provides summary statistics for all permanent job vacancies with remote or hybrid options requiring process or methodology skills.

Permanent vacancies with a requirement for process or methodology skills 14,522 17,412 20,717
As % of all permanent jobs with a WFH option 92.19% 88.49% 95.01%
Number of salaries quoted 8,735 10,325 16,735
10th Percentile £29,250 £36,250 £37,000
25th Percentile £39,965 £46,250 £47,000
Median annual salary (50th Percentile) £57,500 £62,500 £62,500
Median % change year-on-year -8.00% - -
75th Percentile £77,500 £81,250 £81,194
90th Percentile £98,000 £100,000 £97,500
UK median annual salary £54,500 £60,000 £60,000
% change year-on-year -9.17% - -

ITSM
Job Vacancy Trend for Remote/Hybrid Jobs

Historical trend showing the proportion of permanent IT job postings citing ITSM and offering remote or hybrid work options relative to all permanent IT jobs advertised.
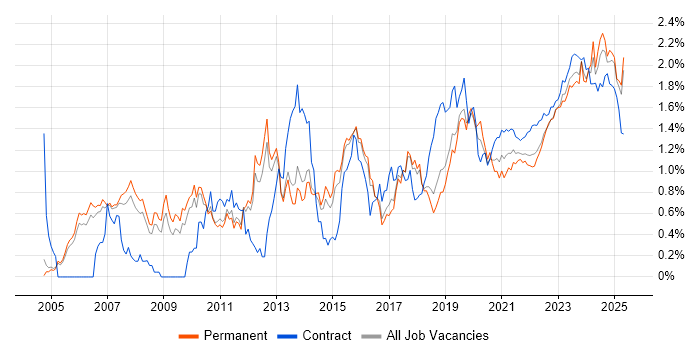
ITSM job vacancy trend for remote/hybrid jobs

ITSM
Salary Trend for Remote/Hybrid Jobs

Salary distribution trend for jobs with remote/hybrid work options citing ITSM.

Salary distribution trend for jobs with remote/hybrid work options citing ITSM

ITSM
Salary Histogram for Remote/Hybrid Jobs

Salary distribution for jobs with remote/hybrid work options citing ITSM over the 6 months to 12 November 2025.

ITSM salary histogram for jobs with remote/hybrid work options

ITSM
Co-Occurring Skills & Capabilities in Remote/Hybrid Jobs by Category

The following tables expand on the one above by listing co-occurrences grouped by category. They cover the same employment type, locality and period, with up to 20 co-occurrences shown in each category:

Application Platforms
1 18 (4.83%) SharePoint
2 11 (2.95%) Microsoft Exchange
3 3 (0.80%) HCL Domino
3 3 (0.80%) HCL Notes
4 2 (0.54%) IIS
5 1 (0.27%) Confluence
Applications
1 102 (27.35%) Microsoft Office
2 10 (2.68%) Microsoft Excel
3 4 (1.07%) Chatbot
4 1 (0.27%) Microsoft PowerPoint
4 1 (0.27%) MS Visio
Business Applications
1 18 (4.83%) Remedy ITSM
2 6 (1.61%) Dynamics CRM
3 1 (0.27%) assyst
Cloud Services
1 144 (38.61%) Microsoft 365
2 116 (31.10%) AWS
3 49 (13.14%) Azure
4 21 (5.63%) Entra ID
5 20 (5.36%) SaaS
6 9 (2.41%) Power Platform
7 5 (1.34%) Azure DevOps
7 5 (1.34%) PowerApps
8 2 (0.54%) Azure Cosmos DB
8 2 (0.54%) Copilot Studio
8 2 (0.54%) Dynamics 365
8 2 (0.54%) GCP
8 2 (0.54%) GitHub
8 2 (0.54%) GitHub Actions
8 2 (0.54%) IaaS
8 2 (0.54%) PaaS
8 2 (0.54%) Power Automate
9 1 (0.27%) Azure Monitor
9 1 (0.27%) Microsoft Copilot
9 1 (0.27%) Workato
Communications & Networking
1 17 (4.56%) VPN
2 15 (4.02%) Firewall
2 15 (4.02%) WAN
3 14 (3.75%) LAN
3 14 (3.75%) VoIP
4 13 (3.49%) SD-WAN
4 13 (3.49%) Wi-Fi
5 9 (2.41%) DHCP
5 9 (2.41%) DNS
6 7 (1.88%) IP Telephony
6 7 (1.88%) Network Security
6 7 (1.88%) Unified Communications
7 4 (1.07%) SNMP
8 3 (0.80%) TCP/IP
9 2 (0.54%) Broadband
9 2 (0.54%) MPLS
10 1 (0.27%) ADSL
10 1 (0.27%) BGP
10 1 (0.27%) Internet
10 1 (0.27%) OSPF
Database & Business Intelligence
1 5 (1.34%) Power BI
2 3 (0.80%) Metadata
2 3 (0.80%) Relational Database
3 2 (0.54%) MongoDB
3 2 (0.54%) MySQL
3 2 (0.54%) SQL Server
Development Applications
1 8 (2.14%) JIRA
2 6 (1.61%) Git
3 1 (0.27%) Octopus Deploy
3 1 (0.27%) TeamCity
General
1 207 (55.50%) Social Skills
2 93 (24.93%) French Language
2 93 (24.93%) Swedish Language
3 42 (11.26%) Finance
4 36 (9.65%) Law
5 29 (7.77%) Influencing Skills
6 28 (7.51%) Public Sector
7 25 (6.70%) Legal
8 21 (5.63%) Fire and Rescue
8 21 (5.63%) Local Government
8 21 (5.63%) Organisational Skills
9 19 (5.09%) Banking
10 17 (4.56%) Inclusion and Diversity
11 16 (4.29%) Telecoms
12 13 (3.49%) Analytical Skills
13 11 (2.95%) Back Office
14 7 (1.88%) Marketing
15 6 (1.61%) Games
15 6 (1.61%) Manufacturing
16 5 (1.34%) Advertising
Job Titles
1 141 (37.80%) Analyst
2 105 (28.15%) Service Analyst
3 96 (25.74%) Service Desk Analyst
4 36 (9.65%) Consultant
4 36 (9.65%) IT Support
5 35 (9.38%) Senior
6 28 (7.51%) Service Manager
7 26 (6.97%) Technical Consultant
8 23 (6.17%) Developer
8 23 (6.17%) Senior Consultant
8 23 (6.17%) Senior Technical Consultant
9 22 (5.90%) IT Analyst
10 20 (5.36%) Architect
10 20 (5.36%) IT Manager
10 20 (5.36%) ServiceNow Developer
11 18 (4.83%) 1st Line Support
12 15 (4.02%) Change Analyst
12 15 (4.02%) Support Analyst
13 14 (3.75%) Business Change Analyst
14 13 (3.49%) IT Support Analyst
Libraries, Frameworks & Software Standards
1 16 (4.29%) CSS
1 16 (4.29%) HTML
1 16 (4.29%) XML
2 15 (4.02%) JSON
3 6 (1.61%) .NET
3 6 (1.61%) REST
3 6 (1.61%) SOAP
3 6 (1.61%) YAML
4 4 (1.07%) Jinja
5 3 (0.80%) EDI
5 3 (0.80%) Web Services
6 1 (0.27%) LDAP
6 1 (0.27%) OpenTelemetry
Miscellaneous
1 21 (5.63%) NHS
2 20 (5.36%) CMDB
3 16 (4.29%) Driving Licence
4 13 (3.49%) Hybrid Cloud
4 13 (3.49%) Operational Technology
5 11 (2.95%) Management Information System
6 8 (2.14%) Product Ownership
7 7 (1.88%) CCTV
8 6 (1.61%) iPad
8 6 (1.61%) Onboarding
9 5 (1.34%) Data Centre
9 5 (1.34%) Legacy Systems
9 5 (1.34%) Security Posture
9 5 (1.34%) Self-Motivation
10 4 (1.07%) AI Agents
10 4 (1.07%) Enterprise Software
10 4 (1.07%) Security Operations Centre
11 3 (0.80%) Foreign Exchange (FX)
11 3 (0.80%) Video Conferencing
12 2 (0.54%) Video\Live Streaming
Operating Systems
1 38 (10.19%) Windows
2 19 (5.09%) Windows Server
3 17 (4.56%) Linux
4 14 (3.75%) Windows 10
5 10 (2.68%) Mac OS
6 2 (0.54%) Windows Server 2012
7 1 (0.27%) Apple iOS
Processes & Methodologies
1 252 (67.56%) ITIL
2 134 (35.92%) Service Management
3 118 (31.64%) Customer Service
4 102 (27.35%) Performance Metrics
5 67 (17.96%) Service Delivery
6 64 (17.16%) Problem-Solving
7 47 (12.60%) Agile
8 46 (12.33%) Continuous Improvement
9 39 (10.46%) Asset Management
10 32 (8.58%) Cybersecurity
10 32 (8.58%) Problem Management
11 29 (7.77%) Change Management
12 28 (7.51%) Stakeholder Management
13 27 (7.24%) Migration
14 26 (6.97%) Roadmaps
15 24 (6.43%) Project Management
16 21 (5.63%) Case Management
16 21 (5.63%) Digital Innovation
17 20 (5.36%) Technical Leadership
17 20 (5.36%) User Experience
Programming Languages
1 28 (7.51%) JavaScript
2 16 (4.29%) SQL
3 10 (2.68%) PowerShell
4 4 (1.07%) Bash
4 4 (1.07%) Python
5 3 (0.80%) C#
Qualifications
1 118 (31.64%) Degree
2 105 (28.15%) Microsoft Certification
3 101 (27.08%) AWS Certification
4 100 (26.81%) MCSE
5 19 (5.09%) ITIL Foundation Certificate
6 18 (4.83%) Cisco Certification
7 16 (4.29%) CCNP
8 11 (2.95%) PMI Certification
8 11 (2.95%) PMP
8 11 (2.95%) Security Cleared
9 10 (2.68%) SC Cleared
10 8 (2.14%) Azure Certification
10 8 (2.14%) Computer Science Degree
11 7 (1.88%) AWS Certified Solutions Architect
11 7 (1.88%) CCNA
11 7 (1.88%) Master's Degree
11 7 (1.88%) MCP
11 7 (1.88%) MCSA
12 4 (1.07%) CISSP
12 4 (1.07%) ITIL Certification
Quality Assurance & Compliance
1 103 (27.61%) QA
2 12 (3.22%) Cyber Essentials
3 11 (2.95%) SLA
4 10 (2.68%) ISO/IEC 27001
5 9 (2.41%) COBIT
6 8 (2.14%) NIST
7 6 (1.61%) ISO/IEC 20000
7 6 (1.61%) PMO
8 5 (1.34%) ISO 9001
9 4 (1.07%) NCSC
10 3 (0.80%) Data Quality
11 2 (0.54%) GDPR
12 1 (0.27%) Accessibility
12 1 (0.27%) GRC
12 1 (0.27%) SOC 2
System Software
1 33 (8.85%) Active Directory
2 7 (1.88%) Hyper-V
3 2 (0.54%) BitLocker
3 2 (0.54%) Firmware
4 1 (0.27%) VMware NSX
Systems Management
1 17 (4.56%) Microsoft Intune
2 6 (1.61%) SCCM
3 5 (1.34%) Ansible
4 4 (1.07%) Autotask
5 2 (0.54%) Kubernetes
5 2 (0.54%) Nagios
6 1 (0.27%) Panaseer
6 1 (0.27%) Plesk
6 1 (0.27%) Single Sign-On
6 1 (0.27%) Terraform
Vendors
1 207 (55.50%) ServiceNow
2 155 (41.55%) Microsoft
3 18 (4.83%) Remedy
4 16 (4.29%) BMC
5 13 (3.49%) Freshdesk
6 12 (3.22%) Cisco
7 11 (2.95%) Apple
8 8 (2.14%) VMware
9 7 (1.88%) Draytek
9 7 (1.88%) Mitel
9 7 (1.88%) WatchGuard
10 6 (1.61%) Datto
11 4 (1.07%) Atlassian
11 4 (1.07%) Genesys
11 4 (1.07%) Red Hat
12 3 (0.80%) Dynatrace
12 3 (0.80%) F5
12 3 (0.80%) IBM
12 3 (0.80%) Lotus
12 3 (0.80%) Oracle