PaaS Contracts in London

Platform as a Service (PaaS)
England > London

The table below provides summary statistics for contract job vacancies advertised in London requiring PaaS skills. It includes a benchmarking guide to the contractor rates offered in vacancies that cited PaaS over the 6 months leading up to 29 July 2025, comparing them to the same period in the previous two years.

6 months to
29 Jul 2025
Same period 2024 Same period 2023
Rank 243 210 184
Rank change year-on-year -33 -26 -36
Contract jobs citing PaaS 125 179 351
As % of all contract jobs advertised in London 0.92% 1.08% 1.43%
As % of the Cloud Services category 2.15% 2.67% 3.59%
Number of daily rates quoted 74 143 239
10th Percentile £421 £329 £424
25th Percentile £500 £425 £500
Median daily rate (50th Percentile) £600 £550 £600
Median % change year-on-year +9.09% -8.33% -
75th Percentile £738 £681 £688
90th Percentile £775 £780 £775
England median daily rate £575 £600 £600
% change year-on-year -4.17% - +3.45%
Number of hourly rates quoted 1 0 3
10th Percentile - - £82.00
25th Percentile - - £85.00
Median hourly rate £30.00 - £90.00
75th Percentile - - -
90th Percentile - - -
England median hourly rate £30.00 £38.50 £79.00
% change year-on-year -22.08% -51.27% -3.49%

All Cloud Skills
London

PaaS falls under the Cloud Services category. For comparison with the information above, the following table provides summary statistics for all contract job vacancies requiring cloud computing skills in London.

Contract vacancies with a requirement for cloud computing skills 5,821 6,703 9,774
As % of all contract IT jobs advertised in London 42.87% 40.59% 39.81%
Number of daily rates quoted 3,989 4,890 7,254
10th Percentile £342 £350 £363
25th Percentile £425 £450 £463
Median daily rate (50th Percentile) £538 £550 £575
Median % change year-on-year -2.27% -4.35% -
75th Percentile £660 £675 £688
90th Percentile £775 £800 £788
England median daily rate £513 £525 £550
% change year-on-year -2.38% -4.55% -
Number of hourly rates quoted 83 53 69
10th Percentile £22.60 £20.00 £16.63
25th Percentile £24.77 £22.08 £22.75
Median hourly rate £29.07 £27.00 £52.50
Median % change year-on-year +7.67% -48.57% +26.51%
75th Percentile £45.63 £42.50 £72.50
90th Percentile £67.11 £66.80 £87.25
England median hourly rate £25.15 £22.00 £33.00
% change year-on-year +14.32% -33.33% +53.49%

PaaS
Job Vacancy Trend in London

Job postings citing PaaS as a proportion of all IT jobs advertised in London.
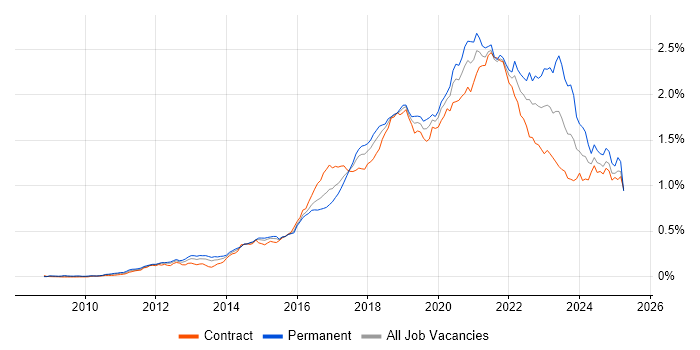
Job vacancy trend for PaaS in London

PaaS
Contractor Daily Rate Trend in London

3-month moving average daily rate quoted in jobs citing PaaS in London.

Daily rate trend for PaaS in London

PaaS
Daily Rate Histogram in London

Daily rate distribution for jobs citing PaaS in London over the 6 months to 29 July 2025.

Daily rate histogram for PaaS in London

PaaS
Contractor Hourly Rate Trend in London

3-month moving average hourly rates quoted in jobs citing PaaS in London.

Hourly rate trend for PaaS in London

PaaS
Contract Job Locations in London

The table below looks at the demand and provides a guide to the median contractor rates quoted in IT jobs citing PaaS within the London region over the 6 months to 29 July 2025. The 'Rank Change' column provides an indication of the change in demand within each location based on the same 6 month period last year.

Location Rank Change
on Same Period
Last Year
Matching
Contract
IT Job Ads
Median
Daily Rate
Past 6 Months
Median Daily Rate
% Change
on Same Period
Last Year
Live
Jobs
Central London +6 25 £740 +34.55% 10
South London - 3 £473 - 1
North London - 2 £550 -
East London +13 1 £495 -8.33% 4
PaaS
England

PaaS
Co-occurring Skills and Capabilities in London by Category

The follow tables expand on the table above by listing co-occurrences grouped by category. The same employment type, locality and period is covered with up to 20 co-occurrences shown in each of the following categories:

Application Platforms
1 9 (7.20%) Confluence
2 6 (4.80%) Microsoft Exchange
2 6 (4.80%) SharePoint
3 3 (2.40%) Apache Spark
4 2 (1.60%) nginx
4 2 (1.60%) Oracle SOA Suite
4 2 (1.60%) WebSphere
5 1 (0.80%) CICS
5 1 (0.80%) JBoss
5 1 (0.80%) OpenStack
5 1 (0.80%) Tomcat
5 1 (0.80%) WebLogic
Applications
1 1 (0.80%) Microsoft Excel
1 1 (0.80%) Microsoft Office
Business Applications
1 5 (4.00%) Oracle Procure-to-Pay
2 4 (3.20%) Salesforce CRM
2 4 (3.20%) Workday HCM
3 3 (2.40%) Oracle EBS
3 3 (2.40%) SAP S/4HANA
4 2 (1.60%) Oracle Payables
4 2 (1.60%) Oracle Subledger Accounting
5 1 (0.80%) Oracle Applications
5 1 (0.80%) Oracle Assets
5 1 (0.80%) Oracle Cash Management
Cloud Services
1 93 (74.40%) Azure
2 84 (67.20%) IaaS
3 79 (63.20%) SaaS
4 37 (29.60%) AWS
5 32 (25.60%) Azure DevOps
6 31 (24.80%) GCP
7 30 (24.00%) Entra ID
8 26 (20.80%) Microsoft 365
9 23 (18.40%) Serverless
10 16 (12.80%) Azure AKS
11 12 (9.60%) Cloud Computing
12 10 (8.00%) AWS CloudFormation
12 10 (8.00%) GitHub
13 8 (6.40%) Azure Sentinel
14 7 (5.60%) Azure Data Factory
15 6 (4.80%) Azure ExpressRoute
15 6 (4.80%) OCI
16 5 (4.00%) Power Platform
17 4 (3.20%) AWS Lambda
17 4 (3.20%) Azure Logic Apps
Communications & Networking
1 20 (16.00%) Firewall
2 12 (9.60%) VPN
3 5 (4.00%) HTTPS
3 5 (4.00%) SSL
4 4 (3.20%) WAN
5 3 (2.40%) DNS
6 2 (1.60%) NAS
6 2 (1.60%) NGFW
6 2 (1.60%) SAN
6 2 (1.60%) SD-WAN
7 1 (0.80%) 3GPP
7 1 (0.80%) BGP
7 1 (0.80%) DHCP
7 1 (0.80%) Ethernet VPN
7 1 (0.80%) Internet
7 1 (0.80%) MPLS
7 1 (0.80%) Radio Access Network
7 1 (0.80%) SMTP
7 1 (0.80%) Software-Defined Networking
7 1 (0.80%) VXLAN
Database & Business Intelligence
1 10 (8.00%) SQL Server
2 9 (7.20%) Azure SQL Database
3 7 (5.60%) Data Lake
4 4 (3.20%) Big Data
4 4 (3.20%) PostgreSQL
4 4 (3.20%) Power BI
5 3 (2.40%) Apache Hive
5 3 (2.40%) Data Warehouse
5 3 (2.40%) SQL Server Reporting Services
6 2 (1.60%) Amazon RDS
6 2 (1.60%) Amazon Redshift
6 2 (1.60%) MySQL
6 2 (1.60%) Relational Database
7 1 (0.80%) AlloyDB
7 1 (0.80%) BigQuery
7 1 (0.80%) Cloud Spanner
7 1 (0.80%) Elasticsearch
7 1 (0.80%) Looker
7 1 (0.80%) Metadata
7 1 (0.80%) Tableau
Development Applications
1 11 (8.80%) JIRA
2 9 (7.20%) GitLab
3 8 (6.40%) Jenkins
4 3 (2.40%) SonarQube
5 2 (1.60%) Eclipse
5 2 (1.60%) Git
5 2 (1.60%) TeamCity
6 1 (0.80%) MSI
General
1 41 (32.80%) Finance
2 22 (17.60%) Social Skills
3 12 (9.60%) Analytical Skills
4 10 (8.00%) Banking
5 9 (7.20%) Marketing
5 9 (7.20%) Public Sector
6 6 (4.80%) Presentation Skills
7 5 (4.00%) Financial Institution
8 4 (3.20%) Investment Banking
8 4 (3.20%) Local Government
9 3 (2.40%) General Ledger
9 3 (2.40%) Legal
10 2 (1.60%) Billing
10 2 (1.60%) Documentation Skills
10 2 (1.60%) Retail
11 1 (0.80%) Influencing Skills
11 1 (0.80%) International Banking
11 1 (0.80%) Law
11 1 (0.80%) Manufacturing
11 1 (0.80%) Police
Job Titles
1 67 (53.60%) Architect
2 25 (20.00%) Solutions Architect
3 22 (17.60%) Cloud Architect
4 21 (16.80%) Azure Architect
5 11 (8.80%) Senior
6 10 (8.00%) DevOps Engineer
7 9 (7.20%) Enterprise Architect
8 8 (6.40%) Azure Engineer
8 8 (6.40%) Infrastructure Architect
8 8 (6.40%) Senior Architect
8 8 (6.40%) Technical Architect
9 7 (5.60%) Project Manager
10 6 (4.80%) Azure DevOps Engineer
10 6 (4.80%) Cloud Infrastructure Architect
10 6 (4.80%) Cloud Solutions Architect
10 6 (4.80%) Developer
11 5 (4.00%) Infrastructure Technical Architect
11 5 (4.00%) Microsoft 365 Architect
11 5 (4.00%) Oracle Architect
11 5 (4.00%) Technical Infrastructure Architect
Libraries, Frameworks & Software Standards
1 12 (9.60%) ARM Templates
2 10 (8.00%) .NET
3 9 (7.20%) REST
4 6 (4.80%) RESTful
4 6 (4.80%) Web Services
5 5 (4.00%) CSS
5 5 (4.00%) HTML
5 5 (4.00%) Oracle Fusion
6 4 (3.20%) AngularJS
6 4 (3.20%) J2EE
6 4 (3.20%) Lightning Web Components
6 4 (3.20%) Middleware
6 4 (3.20%) React
7 3 (2.40%) Azure Blueprints
7 3 (2.40%) Django
7 3 (2.40%) Leaflet
8 2 (1.60%) .NET Core
8 2 (1.60%) ADO
8 2 (1.60%) Entity Framework
8 2 (1.60%) SailPoint
Miscellaneous
1 23 (18.40%) Cloud Native
2 15 (12.00%) Hybrid Cloud
3 9 (7.20%) Public Cloud
4 6 (4.80%) Linux Command Line
4 6 (4.80%) Private Cloud
5 5 (4.00%) Enterprise Cloud
6 4 (3.20%) Data Centre
6 4 (3.20%) Enterprise Software
6 4 (3.20%) Reinsurance
7 3 (2.40%) Low-Code
7 3 (2.40%) PKI
7 3 (2.40%) Security Posture
8 2 (1.60%) Data Protection Act
8 2 (1.60%) Foreign Exchange (FX)
8 2 (1.60%) Legacy Systems
8 2 (1.60%) Mainframe
8 2 (1.60%) Onboarding
8 2 (1.60%) Virtual Team
9 1 (0.80%) Cyber Defence
9 1 (0.80%) Legacy Applications
Operating Systems
1 18 (14.40%) Linux
2 15 (12.00%) Windows
3 8 (6.40%) Windows Server
4 2 (1.60%) Debian
4 2 (1.60%) Unix
5 1 (0.80%) AIX
5 1 (0.80%) Amazon Linux
5 1 (0.80%) CentOS
5 1 (0.80%) Oracle Linux
5 1 (0.80%) Red Hat Enterprise Linux
5 1 (0.80%) Solaris
5 1 (0.80%) VMS
5 1 (0.80%) Windows Server 2003
5 1 (0.80%) Windows Server 2019
Processes & Methodologies
1 59 (47.20%) DevOps
2 44 (35.20%) Infrastructure as Code
3 38 (30.40%) Agile
4 33 (26.40%) CI/CD
5 32 (25.60%) Migration
6 27 (21.60%) Cloud Security
7 18 (14.40%) Enterprise Architecture
7 18 (14.40%) Roadmaps
8 17 (13.60%) Analytics
8 17 (13.60%) Problem-Solving
8 17 (13.60%) TOGAF
9 16 (12.80%) ETL
9 16 (12.80%) Stakeholder Engagement
9 16 (12.80%) Technical Leadership
10 15 (12.00%) Containerisation
10 15 (12.00%) Microservices
10 15 (12.00%) Zero Trust
11 14 (11.20%) Scrum
12 13 (10.40%) Project Delivery
13 11 (8.80%) Cost Optimisation
Programming Languages
1 22 (17.60%) PowerShell
2 21 (16.80%) Bicep
3 20 (16.00%) SQL
4 12 (9.60%) Python
5 10 (8.00%) JavaScript
6 9 (7.20%) C#
6 9 (7.20%) Java
7 4 (3.20%) Bash
8 3 (2.40%) PL/SQL
9 1 (0.80%) C
9 1 (0.80%) COBOL
9 1 (0.80%) Kotlin
9 1 (0.80%) Shell Script
9 1 (0.80%) T-SQL
9 1 (0.80%) TypeScript
Qualifications
1 26 (20.80%) Azure Certification
2 23 (18.40%) Security Cleared
3 19 (15.20%) SC Cleared
4 13 (10.40%) Degree
5 10 (8.00%) AWS Certification
6 5 (4.00%) Cisco Certification
6 5 (4.00%) TOGAF Certification
7 4 (3.20%) AWS Certified Solutions Architect
7 4 (3.20%) Computer Science Degree
8 3 (2.40%) (ISC)2 CCSP
8 3 (2.40%) AWS Certified Cloud Practitioner
8 3 (2.40%) CISSP
8 3 (2.40%) Microsoft Certification
9 2 (1.60%) ITIL Certification
9 2 (1.60%) OCP
9 2 (1.60%) Oracle Certification
9 2 (1.60%) SAFe Agilist
10 1 (0.80%) CISM
10 1 (0.80%) PMI Certification
10 1 (0.80%) PMP
Quality Assurance & Compliance
1 15 (12.00%) GDPR
2 10 (8.00%) ISO/IEC 27001
3 8 (6.40%) SOC 2
4 4 (3.20%) COBIT
4 4 (3.20%) QA
4 4 (3.20%) SLA
5 3 (2.40%) Accessibility
5 3 (2.40%) GAAP
6 2 (1.60%) ISO/IEC 27002 (supersedes ISO/IEC 17799)
7 1 (0.80%) Cyber Essentials
7 1 (0.80%) Cyber Essentials PLUS
7 1 (0.80%) Data Quality
7 1 (0.80%) GRC
7 1 (0.80%) HIPAA
7 1 (0.80%) IFRS
7 1 (0.80%) NCSC
7 1 (0.80%) NIST
7 1 (0.80%) PMO
System Software
1 21 (16.80%) Active Directory
2 16 (12.80%) Docker
3 9 (7.20%) Virtual Machines
4 3 (2.40%) VMware Infrastructure
5 2 (1.60%) Hyper-V
5 2 (1.60%) Virtual Desktop
6 1 (0.80%) BitLocker
6 1 (0.80%) Microsoft App-V
6 1 (0.80%) Terminal Services
6 1 (0.80%) VMware ESXi
Systems Management
1 47 (37.60%) Terraform
2 32 (25.60%) Kubernetes
3 17 (13.60%) Ansible
4 8 (6.40%) Single Sign-On
5 6 (4.80%) Microsoft Intune
6 5 (4.00%) Data Guard
7 2 (1.60%) Control-M
7 2 (1.60%) Grafana
7 2 (1.60%) Nessus
7 2 (1.60%) Prometheus
7 2 (1.60%) Puppet
8 1 (0.80%) Active Directory Federation Services
8 1 (0.80%) HAProxy
8 1 (0.80%) Istio
8 1 (0.80%) Nagios
8 1 (0.80%) SCCM
8 1 (0.80%) SCOM
8 1 (0.80%) vCenter Server
8 1 (0.80%) vMotion
Vendors
1 59 (47.20%) Microsoft
2 15 (12.00%) Oracle
3 14 (11.20%) Google
4 11 (8.80%) Databricks
5 8 (6.40%) ServiceNow
6 6 (4.80%) Salesforce
7 5 (4.00%) Cloudera
7 5 (4.00%) SAP
8 4 (3.20%) Qualys
8 4 (3.20%) VMware
8 4 (3.20%) Workday
9 3 (2.40%) Citrix
9 3 (2.40%) Dell
9 3 (2.40%) HP
9 3 (2.40%) IBM
10 2 (1.60%) Cisco
10 2 (1.60%) Informatica
10 2 (1.60%) Okta
10 2 (1.60%) Red Hat
10 2 (1.60%) Tripwire