Strategic Planning Jobs in London

Strategic Planning
England > London

The table below provides summary statistics for permanent job vacancies advertised in London requiring Strategic Planning skills. It includes a benchmarking guide to the annual salaries offered in vacancies that cited Strategic Planning over the 6 months leading up to 18 May 2025, comparing them to the same period in the previous two years.

6 months to
18 May 2025
Same period 2024 Same period 2023
Rank 265 316 512
Rank change year-on-year +51 +196 +204
Permanent jobs citing Strategic Planning 131 199 118
As % of all permanent jobs advertised in London 1.01% 0.84% 0.35%
As % of the Processes & Methodologies category 1.05% 0.92% 0.37%
Number of salaries quoted 82 111 55
10th Percentile £57,552 £40,702 £43,516
25th Percentile £62,500 £46,420 £52,500
Median annual salary (50th Percentile) £77,000 £60,000 £77,500
Median % change year-on-year +28.33% -22.58% +16.54%
75th Percentile £102,500 £77,500 £100,000
90th Percentile £130,000 £97,500 £112,000
England median annual salary £70,000 £57,500 £50,500
% change year-on-year +21.74% +13.86% -15.83%

All Process and Methodology Skills
London

Strategic Planning falls under the Processes and Methodologies category. For comparison with the information above, the following table provides summary statistics for all permanent job vacancies requiring process or methodology skills in London.

Permanent vacancies with a requirement for process or methodology skills 12,445 21,520 32,059
As % of all permanent jobs advertised in London 96.16% 90.99% 95.36%
Number of salaries quoted 7,282 15,899 23,123
10th Percentile £42,000 £37,500 £43,180
25th Percentile £55,813 £51,500 £55,000
Median annual salary (50th Percentile) £75,000 £70,073 £75,000
Median % change year-on-year +7.03% -6.57% +7.14%
75th Percentile £100,000 £95,000 £95,000
90th Percentile £122,500 £115,000 £115,000
England median annual salary £57,500 £55,000 £62,500
% change year-on-year +4.55% -12.00% +4.17%

Strategic Planning
Job Vacancy Trend in London

Job postings citing Strategic Planning as a proportion of all IT jobs advertised in London.
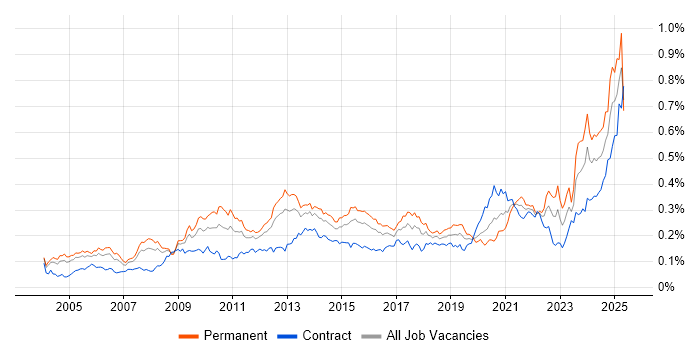
Job vacancy trend for Strategic Planning in London

Strategic Planning
Salary Trend in London

3-month moving average salary quoted in jobs citing Strategic Planning in London.

Salary trend for Strategic Planning in London

Strategic Planning
Salary Histogram in London

Salary distribution for jobs citing Strategic Planning in London over the 6 months to 18 May 2025.

Salary histogram for Strategic Planning in London

Strategic Planning
Job Locations in London

The table below looks at the demand and provides a guide to the median salaries quoted in IT jobs citing Strategic Planning within the London region over the 6 months to 18 May 2025. The 'Rank Change' column provides an indication of the change in demand within each location based on the same 6 month period last year.

Location Rank Change
on Same Period
Last Year
Matching
Permanent
IT Job Ads
Median Salary
Past 6 Months
Median Salary
% Change
on Same Period
Last Year
Live
Jobs
Central London +20 20 £90,000 +89.47% 17
South London -34 4 £65,822 -2.49%
West London - 4 £76,500 - 11
Strategic Planning
England

Strategic Planning
Co-occurring Skills and Capabilities in London by Category

The follow tables expand on the table above by listing co-occurrences grouped by category. The same employment type, locality and period is covered with up to 20 co-occurrences shown in each of the following categories:

Application Platforms
1 17 (12.98%) SharePoint
2 7 (5.34%) CMS
3 5 (3.82%) Moodle
4 2 (1.53%) Microsoft Exchange
4 2 (1.53%) WordPress
5 1 (0.76%) CICS
5 1 (0.76%) Confluence
5 1 (0.76%) SharePoint Server
Applications
1 6 (4.58%) Microsoft Excel
2 4 (3.05%) Microsoft PowerPoint
3 2 (1.53%) Microsoft Office
3 2 (1.53%) SOLIDWORKS
4 1 (0.76%) MS Visio
Business Applications
1 2 (1.53%) Workday HCM
2 1 (0.76%) Dynamics CRM
2 1 (0.76%) NetSuite
Cloud Services
1 38 (29.01%) Azure
2 29 (22.14%) Microsoft 365
3 21 (16.03%) Power Platform
4 17 (12.98%) Entra ID
4 17 (12.98%) SaaS
5 12 (9.16%) AWS
6 9 (6.87%) Microsoft Purview
7 8 (6.11%) Azure Synapse Analytics
7 8 (6.11%) Google Analytics
8 3 (2.29%) GitHub
9 2 (1.53%) Azure Sentinel
9 2 (1.53%) GCP
9 2 (1.53%) Mimecast
9 2 (1.53%) Power Automate
9 2 (1.53%) PowerApps
10 1 (0.76%) Amazon EKS
10 1 (0.76%) Cohesity
10 1 (0.76%) Dynamics 365
10 1 (0.76%) Intacct
10 1 (0.76%) ShareGate
Communications & Networking
1 11 (8.40%) Firewall
2 8 (6.11%) Wi-Fi
3 7 (5.34%) Internet
4 5 (3.82%) DNS
4 5 (3.82%) WAN
5 4 (3.05%) Network Security
5 4 (3.05%) SD-WAN
6 3 (2.29%) VLAN
7 2 (1.53%) DHCP
7 2 (1.53%) DKIM
7 2 (1.53%) DMARC
7 2 (1.53%) LAN
8 1 (0.76%) BGP
8 1 (0.76%) HSRP
8 1 (0.76%) Intranet
8 1 (0.76%) VPN
Database & Business Intelligence
1 20 (15.27%) Power BI
2 6 (4.58%) GIS
2 6 (4.58%) SQL Server
3 3 (2.29%) Tableau
4 2 (1.53%) Electronic Patient Records
4 2 (1.53%) Metadata
5 1 (0.76%) DB2
5 1 (0.76%) KDB
5 1 (0.76%) Metadata Repository
5 1 (0.76%) PostgreSQL
5 1 (0.76%) Spark SQL
Development Applications
1 3 (2.29%) GitLab
2 1 (0.76%) Git
2 1 (0.76%) Jenkins
2 1 (0.76%) JIRA
General
1 73 (55.73%) Social Skills
2 56 (42.75%) Finance
3 52 (39.69%) Analytical Skills
4 36 (27.48%) Marketing
5 14 (10.69%) Manufacturing
5 14 (10.69%) Public Sector
6 13 (9.92%) Electronics
6 13 (9.92%) Telecoms
7 12 (9.16%) Inclusion and Diversity
8 8 (6.11%) Organisational Skills
9 7 (5.34%) Humanities
10 5 (3.82%) Pharmaceutical
11 3 (2.29%) Banking
11 3 (2.29%) Corporate Banking
11 3 (2.29%) Retail Banking
12 1 (0.76%) Billing
12 1 (0.76%) Legal
12 1 (0.76%) Local Government
12 1 (0.76%) Presentation Skills
12 1 (0.76%) Retail
Job Titles
1 38 (29.01%) IT Manager
2 17 (12.98%) Lead
3 15 (11.45%) Operations Manager
4 14 (10.69%) Senior
5 13 (9.92%) IT Operations Manager
5 13 (9.92%) IT Support
5 13 (9.92%) IT Support Manager
5 13 (9.92%) Support Manager
6 10 (7.63%) Architect
6 10 (7.63%) Infrastructure Manager
7 8 (6.11%) Analyst
7 8 (6.11%) Lead Architect
8 6 (4.58%) Sales Director
8 6 (4.58%) Technical Leader
9 5 (3.82%) Developer
9 5 (3.82%) IT Director
9 5 (3.82%) Senior Developer
10 4 (3.05%) Consultant
10 4 (3.05%) Senior Software Engineer
10 4 (3.05%) Software Engineer
Libraries, Frameworks & Software Standards
1 8 (6.11%) ADO
1 8 (6.11%) MERN Stack
1 8 (6.11%) Middleware
1 8 (6.11%) REST
1 8 (6.11%) SOAP
1 8 (6.11%) WebSockets
2 7 (5.34%) CSS
2 7 (5.34%) HTML
3 4 (3.05%) React
4 3 (2.29%) YAML
5 2 (1.53%) Lightning Web Components
5 2 (1.53%) SAML
6 1 (0.76%) FIX Protocol
6 1 (0.76%) PySpark
6 1 (0.76%) Spring Boot
Miscellaneous
1 12 (9.16%) Data Centre
2 8 (6.11%) Data Structures
2 8 (6.11%) Self-Motivation
3 6 (4.58%) Product Ownership
4 5 (3.82%) Learning Management System
5 4 (3.05%) Management Information System
6 3 (2.29%) Enterprise Software
6 3 (2.29%) Operational Technology
6 3 (2.29%) Virtual Team
7 2 (1.53%) NHS
7 2 (1.53%) Onboarding
7 2 (1.53%) PACS
7 2 (1.53%) PMI
7 2 (1.53%) Social Network
8 1 (0.76%) Data Protection Act
8 1 (0.76%) Foreign Exchange (FX)
8 1 (0.76%) Mainframe
8 1 (0.76%) Podcast
8 1 (0.76%) SCADA
8 1 (0.76%) Wiki
Operating Systems
1 8 (6.11%) Windows
2 6 (4.58%) Android
2 6 (4.58%) Apple iOS
3 4 (3.05%) Linux
4 3 (2.29%) Windows Server
5 2 (1.53%) Mac OS X
6 1 (0.76%) Ubuntu
6 1 (0.76%) zOS
Processes & Methodologies
1 66 (50.38%) Problem-Solving
2 43 (32.82%) Project Management
3 39 (29.77%) ITIL
4 32 (24.43%) Business Intelligence
5 31 (23.66%) Roadmaps
6 28 (21.37%) Collaborative Working
7 27 (20.61%) Cybersecurity
8 26 (19.85%) Continuous Improvement
9 23 (17.56%) Collaborative Culture
9 23 (17.56%) Decision-Making
10 20 (15.27%) Agile
10 20 (15.27%) Analytics
10 20 (15.27%) Digital Marketing
10 20 (15.27%) Service Delivery
10 20 (15.27%) Technology Roadmap
11 18 (13.74%) Infrastructure Management
11 18 (13.74%) Project Delivery
12 16 (12.21%) Coaching
12 16 (12.21%) ITSM
12 16 (12.21%) Service Management
Programming Languages
1 12 (9.16%) SQL
2 7 (5.34%) JavaScript
3 5 (3.82%) PowerShell
3 5 (3.82%) Python
4 4 (3.05%) TypeScript
5 2 (1.53%) Java
6 1 (0.76%) Assembly Language
6 1 (0.76%) COBOL
6 1 (0.76%) Data Analysis Expressions
6 1 (0.76%) REXX
Qualifications
1 39 (29.77%) Degree
2 29 (22.14%) PMI Certification
3 28 (21.37%) PMP
4 25 (19.08%) CISSP
5 12 (9.16%) Computer Science Degree
6 8 (6.11%) Azure Certification
6 8 (6.11%) Microsoft Certification
7 7 (5.34%) AWS Certification
7 7 (5.34%) AWS Certified Solutions Architect
7 7 (5.34%) Postgraduate
8 4 (3.05%) Master's Degree
8 4 (3.05%) SC Cleared
8 4 (3.05%) Security Cleared
9 3 (2.29%) CCNP
9 3 (2.29%) Cisco Certification
10 2 (1.53%) ACCA
10 2 (1.53%) CIMA
10 2 (1.53%) MBA
10 2 (1.53%) Six Sigma Black Belt
11 1 (0.76%) CBAP
Quality Assurance & Compliance
1 22 (16.79%) GDPR
2 15 (11.45%) Cyber Essentials
2 15 (11.45%) QA
3 13 (9.92%) Cyber Essentials PLUS
4 6 (4.58%) Accessibility
4 6 (4.58%) WCAG
5 4 (3.05%) Data Quality
6 3 (2.29%) Good Clinical Practice
7 2 (1.53%) ISO/IEC 27001
System Software
1 5 (3.82%) Active Directory
2 2 (1.53%) Docker
2 2 (1.53%) Hyper-V
3 1 (0.76%) VMware Infrastructure
Systems Management
1 9 (6.87%) Kubernetes
2 4 (3.05%) Terraform
3 2 (1.53%) Ansible
3 2 (1.53%) Single Sign-On
4 1 (0.76%) Grafana
Vendors
1 46 (35.11%) Microsoft
2 22 (16.79%) Salesforce
3 14 (10.69%) SAP
4 10 (7.63%) Google
5 8 (6.11%) Databricks
6 7 (5.34%) HubSpot
7 4 (3.05%) Adaptive Insights
8 3 (2.29%) Cisco
8 3 (2.29%) Meraki
8 3 (2.29%) Workday
9 2 (1.53%) DocuSign
9 2 (1.53%) Veeam
10 1 (0.76%) Anaplan
10 1 (0.76%) Brocade
10 1 (0.76%) Citrix
10 1 (0.76%) Facebook
10 1 (0.76%) IBM
10 1 (0.76%) Pure Storage
10 1 (0.76%) ServiceNow
10 1 (0.76%) YouTube