Software Engineer Jobs in the UK excluding London

Software Engineer
UK > UK excluding London

The median Software Engineer salary in the UK excluding London is £65,000 per year, according to job vacancies posted during the 6 months leading to 28 May 2025.

The table below provides salary benchmarking and summary statistics, comparing them to the same period in the previous two years.

6 months to
28 May 2025
Same period 2024 Same period 2023
Rank 59 14 65
Rank change year-on-year -45 +51 -29
Permanent jobs requiring a Software Engineer 1,714 6,531 2,800
As % of all permanent jobs advertised in the UK excluding London 4.41% 8.87% 4.80%
As % of the Job Titles category 4.88% 9.34% 5.38%
Number of salaries quoted 908 3,302 1,416
10th Percentile £42,500 £38,750 £37,500
25th Percentile £52,000 £45,000 £46,250
Median annual salary (50th Percentile) £65,000 £55,000 £60,000
Median % change year-on-year +18.18% -8.33% +9.09%
75th Percentile £75,000 £67,500 £73,750
90th Percentile £93,778 £80,000 £84,000
UK median annual salary £70,000 £60,000 £70,000
% change year-on-year +16.67% -14.29% +7.69%

All Permanent IT Job Vacancies
UK excluding London

For comparison with the information above, the following table provides summary statistics for all permanent IT job vacancies in the UK excluding London. Most job vacancies include a discernible job title that can be normalized. As such, the figures in the second row provide an indication of the number of permanent jobs in our overall sample.

Permanent vacancies in the UK excluding London with a recognized job title 35,130 69,905 52,029
% of permanent jobs with a recognized job title 90.34% 94.92% 89.13%
Number of salaries quoted 17,680 49,398 29,909
10th Percentile £26,500 £26,750 £29,750
25th Percentile £37,438 £35,000 £38,750
Median annual salary (50th Percentile) £51,399 £50,000 £53,500
Median % change year-on-year +2.80% -6.54% +6.63%
75th Percentile £65,000 £63,750 £68,750
90th Percentile £77,500 £76,250 £81,250
UK median annual salary £55,000 £52,500 £60,000
% change year-on-year +4.76% -12.50% -

Software Engineer
Job Vacancy Trend in the UK excluding London

Job postings that featured Software Engineer in the job title as a proportion of all IT jobs advertised in the UK excluding London.
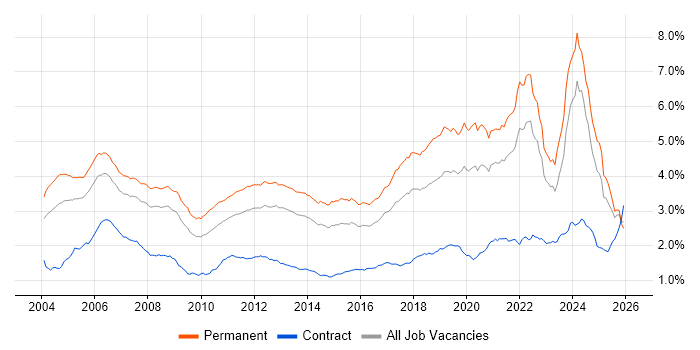
Job vacancy trend for Software Engineer in the UK excluding London

Software Engineer
Salary Trend in the UK excluding London

3-month moving average salary quoted in jobs citing Software Engineer in the UK excluding London.

Salary trend for Software Engineer in the UK excluding London

Software Engineer
Salary Histogram in the UK excluding London

Salary distribution for jobs citing Software Engineer in the UK excluding London over the 6 months to 28 May 2025.

Salary histogram for Software Engineer in the UK excluding London

Software Engineer
Job Locations in the UK excluding London

The table below looks at the demand and provides a guide to the median salaries quoted in IT jobs citing Software Engineer within the UK excluding London region over the 6 months to 28 May 2025. The 'Rank Change' column provides an indication of the change in demand within each location based on the same 6 month period last year.

Location Rank Change
on Same Period
Last Year
Matching
Permanent
IT Job Ads
Median Salary
Past 6 Months
Median Salary
% Change
on Same Period
Last Year
Live
Jobs
North of England -27 569 £65,000 +18.18% 1,894
North West -19 457 £67,500 +17.90% 940
South East -45 337 £65,000 +18.18% 2,281
Midlands -35 250 £60,000 +14.29% 1,478
Scotland -33 221 £59,000 -1.67% 492
South West -35 168 £60,000 +9.09% 1,012
West Midlands -19 146 £60,000 +9.09% 773
East of England -45 125 £66,206 +10.34% 1,250
East Midlands -34 104 £65,000 +23.81% 613
Yorkshire -62 73 £68,250 +36.50% 690
Wales -7 44 £65,000 +30.00% 221
North East +10 39 £55,000 - 267
Northern Ireland -14 1 £50,000 -44.44% 181
Software Engineer
UK

Software Engineer Skill Set
Top 30 Co-occurring Skills and Capabilities in the UK excluding London

For the 6 months to 28 May 2025, Software Engineer job roles required the following skills and capabilities in order of popularity. The figures indicate the absolute number co-occurrences and as a proportion of all permanent job ads across the UK excluding London region featuring Software Engineer in the job title.

1 1,615 (94.22%) Software Engineering
2 1,091 (63.65%) Agile
3 803 (46.85%) Java
4 675 (39.38%) AWS
5 656 (38.27%) JavaScript
6 635 (37.05%) Azure
7 558 (32.56%) Microservices
8 536 (31.27%) CI/CD
9 514 (29.99%) Python
10 512 (29.87%) Finance
11 508 (29.64%) SQL
12 496 (28.94%) Inclusion and Diversity
13 453 (26.43%) GCP
14 446 (26.02%) React
15 443 (25.85%) Mentoring
16 419 (24.45%) DevOps
17 416 (24.27%) Kubernetes
18 407 (23.75%) SDLC
19 403 (23.51%) Test Automation
20 400 (23.34%) Degree
21 394 (22.99%) Banking
22 393 (22.93%) C++
23 385 (22.46%) Docker
24 379 (22.11%) Full-Stack Development
25 359 (20.95%) HTML
26 345 (20.13%) Spring
27 341 (19.89%) Linux
28 337 (19.66%) .NET
29 331 (19.31%) Spring Boot
30 323 (18.84%) CSS

Software Engineer Skill Set
Co-occurring Skills and Capabilities in the UK excluding London by Category

The follow tables expand on the table above by listing co-occurrences grouped by category. The same employment type, locality and period is covered with up to 20 co-occurrences shown in each of the following categories:

Application Platforms
1 193 (11.26%) Confluence
2 29 (1.69%) Apache
3 8 (0.47%) Apache Spark
3 8 (0.47%) CMS
4 3 (0.18%) Adobe Experience Manager
4 3 (0.18%) OpenStack
5 2 (0.12%) Apache Airflow
5 2 (0.12%) Camunda
5 2 (0.12%) Oracle Workflow
5 2 (0.12%) WebSphere
6 1 (0.058%) CICS
6 1 (0.058%) Cloud Foundry
6 1 (0.058%) ColdFusion
6 1 (0.058%) FactoryTalk
6 1 (0.058%) Headless CMS
6 1 (0.058%) Sitefinity
6 1 (0.058%) Solana
6 1 (0.058%) Tomcat
6 1 (0.058%) Umbraco
6 1 (0.058%) WinCC
Applications
1 105 (6.13%) Simulink
2 37 (2.16%) Chatbot
3 3 (0.18%) Microsoft Office
4 2 (0.12%) GNU Octave
4 2 (0.12%) Microsoft Excel
4 2 (0.12%) Microsoft PowerPoint
5 1 (0.058%) CANalyzer
5 1 (0.058%) Trello
Business Applications
1 7 (0.41%) Q-Pulse
2 1 (0.058%) BASE24
2 1 (0.058%) LabWindows
2 1 (0.058%) Payment Gateway
Cloud Services
1 675 (39.38%) AWS
2 635 (37.05%) Azure
3 453 (26.43%) GCP
4 59 (3.44%) GitHub
5 37 (2.16%) SaaS
6 30 (1.75%) Serverless
7 24 (1.40%) Azure DevOps
8 20 (1.17%) Amazon S3
9 19 (1.11%) GitHub Actions
10 16 (0.93%) Cloud Computing
11 14 (0.82%) Amazon EC2
11 14 (0.82%) Azure API Management
12 13 (0.76%) AWS Lambda
12 13 (0.76%) Azure Machine Learning
13 10 (0.58%) Azure Data Factory
13 10 (0.58%) Azure Synapse Analytics
14 9 (0.53%) Amazon EKS
14 9 (0.53%) Apigee
14 9 (0.53%) Azure Service Bus
14 9 (0.53%) npm
Communications & Networking
1 36 (2.10%) Wireless
2 21 (1.23%) Software-Defined Radio
3 15 (0.88%) TCP/IP
4 14 (0.82%) Modbus
5 13 (0.76%) Network Security
6 10 (0.58%) RS-232
7 9 (0.53%) Bluetooth
7 9 (0.53%) WAN
8 8 (0.47%) Internet
8 8 (0.47%) ZigBee
9 7 (0.41%) Ethernet
9 7 (0.41%) MQTT
10 6 (0.35%) Profibus
10 6 (0.35%) RS-485
10 6 (0.35%) Wi-Fi
11 5 (0.29%) LoRaWAN
12 4 (0.23%) 5G
12 4 (0.23%) SD-WAN
13 2 (0.12%) LTE
13 2 (0.12%) VLAN
Database & Business Intelligence
1 291 (16.98%) SQL Server
2 61 (3.56%) MongoDB
3 56 (3.27%) NoSQL
3 56 (3.27%) PostgreSQL
4 54 (3.15%) MySQL
5 50 (2.92%) Relational Database
6 23 (1.34%) Big Data
7 15 (0.88%) Elasticsearch
8 14 (0.82%) RDBMS
9 13 (0.76%) Redis
10 11 (0.64%) Azure SQL Database
10 11 (0.64%) DynamoDB
11 10 (0.58%) Amazon RDS
11 10 (0.58%) Cloud Spanner
12 7 (0.41%) BigQuery
13 5 (0.29%) Amazon Athena
13 5 (0.29%) Apache Cassandra
13 5 (0.29%) SQL Server Integration Services
13 5 (0.29%) SQL Server Reporting Services
14 4 (0.23%) Data Warehouse
Development Applications
1 323 (18.84%) JIRA
2 284 (16.57%) GitLab
3 274 (15.99%) Bitbucket
4 264 (15.40%) SonarQube
5 260 (15.17%) Maven
5 260 (15.17%) Sonatype Nexus
6 259 (15.11%) Cucumber
7 258 (15.05%) Selenium
8 144 (8.40%) Git
9 47 (2.74%) Jenkins
10 28 (1.63%) Eclipse
11 25 (1.46%) Eclipse RCP
12 23 (1.34%) Visual Studio
13 19 (1.11%) JUnit
14 16 (0.93%) Atlassian Bamboo
14 16 (0.93%) Rational DOORS
15 11 (0.64%) webpack
16 10 (0.58%) Cypress.io
16 10 (0.58%) Subversion
17 8 (0.47%) Oracle Forms
General
1 512 (29.87%) Finance
2 496 (28.94%) Inclusion and Diversity
3 394 (22.99%) Banking
4 141 (8.23%) Social Skills
5 132 (7.70%) Aerospace
6 123 (7.18%) Retail
7 117 (6.83%) Automotive
8 97 (5.66%) Investment Banking
9 90 (5.25%) Corporate Banking
10 85 (4.96%) Electronics
11 78 (4.55%) Law
12 72 (4.20%) Analytical Skills
13 56 (3.27%) Manufacturing
14 38 (2.22%) Marketing
15 26 (1.52%) Games
16 23 (1.34%) Military
17 20 (1.17%) Telecoms
18 17 (0.99%) Public Sector
19 15 (0.88%) Tech for Good
20 11 (0.64%) Retail Banking
Libraries, Frameworks & Software Standards
1 446 (26.02%) React
2 359 (20.95%) HTML
3 345 (20.13%) Spring
4 337 (19.66%) .NET
5 331 (19.31%) Spring Boot
6 323 (18.84%) CSS
7 317 (18.49%) Kafka
8 279 (16.28%) Node.js
9 257 (14.99%) Redux
10 252 (14.70%) JPA
11 173 (10.09%) Hibernate
12 154 (8.98%) RESTful
13 144 (8.40%) REST
14 110 (6.42%) Jest
15 98 (5.72%) HTML5
16 95 (5.54%) CSS3
17 90 (5.25%) Sass
18 71 (4.14%) AngularJS
19 45 (2.63%) .NET Core
20 41 (2.39%) Middleware
Miscellaneous
1 295 (17.21%) Product Ownership
2 254 (14.82%) Enterprise Software
3 180 (10.50%) Self-Motivation
4 173 (10.09%) Cyberattack
5 172 (10.04%) Linux Command Line
6 86 (5.02%) Algorithms
7 65 (3.79%) Embedded Systems
8 58 (3.38%) Cloud Native
9 53 (3.09%) Distributed Systems
10 50 (2.92%) Public Cloud
11 39 (2.28%) Greenfield Project
12 34 (1.98%) Mobile App
13 28 (1.63%) IoT
14 24 (1.40%) e-Learning
15 23 (1.34%) Reference Data
16 19 (1.11%) Data Structures
17 18 (1.05%) Device Driver
18 16 (0.93%) MicroBlaze
18 16 (0.93%) Private Cloud
18 16 (0.93%) RISC-V
Operating Systems
1 341 (19.89%) Linux
2 71 (4.14%) Windows
3 35 (2.04%) Unix
4 27 (1.58%) Embedded Linux
5 19 (1.11%) Apple iOS
6 16 (0.93%) Android
7 10 (0.58%) FreeRTOS
8 5 (0.29%) Robot Operating System
9 3 (0.18%) Mac OS
9 3 (0.18%) Red Hat Enterprise Linux
9 3 (0.18%) Rocky
10 2 (0.12%) VMS
10 2 (0.12%) VxWorks
11 1 (0.058%) CentOS
11 1 (0.058%) Debian
11 1 (0.058%) SafeRTOS
11 1 (0.058%) ThreadX
11 1 (0.058%) Windows Server
Processes & Methodologies
1 1,615 (94.22%) Software Engineering
2 1,091 (63.65%) Agile
3 558 (32.56%) Microservices
4 536 (31.27%) CI/CD
5 443 (25.85%) Mentoring
6 419 (24.45%) DevOps
7 407 (23.75%) SDLC
8 403 (23.51%) Test Automation
9 379 (22.11%) Full-Stack Development
10 308 (17.97%) Containerisation
11 300 (17.50%) User Experience
12 287 (16.74%) Computer Science
13 278 (16.22%) TDD
14 264 (15.40%) Front End Development
15 262 (15.29%) Machine Learning
16 260 (15.17%) Performance Optimisation
17 259 (15.11%) Scrum
18 221 (12.89%) Continuous Improvement
19 206 (12.02%) Software Testing
20 201 (11.73%) Data Engineering
Programming Languages
1 803 (46.85%) Java
2 656 (38.27%) JavaScript
3 514 (29.99%) Python
4 508 (29.64%) SQL
5 393 (22.93%) C++
6 310 (18.09%) C#
7 245 (14.29%) Rust
8 239 (13.94%) TypeScript
9 214 (12.49%) Go
10 178 (10.39%) C
11 134 (7.82%) Ada
12 117 (6.83%) MATLAB
13 41 (2.39%) Ada 95
14 36 (2.10%) PHP
15 22 (1.28%) Embedded C
16 19 (1.11%) Bash
16 19 (1.11%) Ruby
17 16 (0.93%) PL/SQL
17 16 (0.93%) VB
18 12 (0.70%) Swift
Qualifications
1 400 (23.34%) Degree
2 266 (15.52%) BPSS Clearance
3 262 (15.29%) Security Cleared
4 198 (11.55%) DV Cleared
5 175 (10.21%) AWS Certification
6 173 (10.09%) AWS Certified Developer
6 173 (10.09%) AWS Certified Solutions Architect
7 93 (5.43%) Chartered Engineer
8 51 (2.98%) Computer Science Degree
8 51 (2.98%) SC Cleared
9 26 (1.52%) Master's Degree
10 15 (0.88%) PhD
11 9 (0.53%) Numerate Degree
12 3 (0.18%) Azure Certification
12 3 (0.18%) HNC
13 2 (0.12%) CompTIA Security+
13 2 (0.12%) Microsoft Certification
14 1 (0.058%) Postgraduate
Quality Assurance & Compliance
1 278 (16.22%) QA
2 116 (6.77%) Accessibility
3 72 (4.20%) ISO/IEC 12207
4 9 (0.53%) Data Quality
5 6 (0.35%) ISO/IEC 27001
6 5 (0.29%) IEC 61508
6 5 (0.29%) PCI DSS
7 4 (0.23%) Def Stans
7 4 (0.23%) IEC 61131
7 4 (0.23%) PMO
7 4 (0.23%) SOC 2
8 3 (0.18%) NIST
8 3 (0.18%) WCAG
9 2 (0.12%) CDISC
9 2 (0.12%) ISO 13485
9 2 (0.12%) ISO 9001
9 2 (0.12%) SEPA
10 1 (0.058%) DO-178B
10 1 (0.058%) ISO 26262
10 1 (0.058%) JTAG
System Software
1 385 (22.46%) Docker
2 48 (2.80%) Firmware
3 29 (1.69%) Embedded Firmware
4 2 (0.12%) HDFS
Systems Management
1 416 (24.27%) Kubernetes
2 67 (3.91%) Terraform
3 18 (1.05%) Ansible
4 15 (0.88%) Grafana
5 9 (0.53%) Istio
5 9 (0.53%) Prometheus
6 6 (0.35%) Kibana
6 6 (0.35%) Single Sign-On
7 2 (0.12%) Argo
7 2 (0.12%) Graylog
7 2 (0.12%) Kustomize
7 2 (0.12%) Progress Chef
8 1 (0.058%) CA Endevor
8 1 (0.058%) ITRS Geneos
8 1 (0.058%) Netcool
8 1 (0.058%) Netcool/OMNIbus
8 1 (0.058%) Opsgenie
8 1 (0.058%) Puppet
8 1 (0.058%) Tivoli
Vendors
1 246 (14.35%) Solace
2 47 (2.74%) Microsoft
3 46 (2.68%) Google
4 39 (2.28%) Oracle
5 36 (2.10%) PayPal
6 31 (1.81%) Databricks
7 19 (1.11%) Atlassian
8 13 (0.76%) Ping Identity
9 9 (0.53%) Splunk
10 8 (0.47%) Adobe
10 8 (0.47%) SAP
11 7 (0.41%) Red Hat
12 5 (0.29%) Dynatrace
12 5 (0.29%) ServiceNow
12 5 (0.29%) Xilinx
13 4 (0.23%) Apple
13 4 (0.23%) F5
13 4 (0.23%) ForgeRock
13 4 (0.23%) IBM
13 4 (0.23%) Tealium