Root Cause Analysis Contracts in London

Root Cause Analysis
England > London

The table below provides summary statistics for contract job vacancies advertised in London requiring Root Cause Analysis skills. It includes a benchmarking guide to the contractor rates offered in vacancies that cited Root Cause Analysis over the 6 months leading up to 3 July 2025, comparing them to the same period in the previous two years.

6 months to
3 Jul 2025
Same period 2024 Same period 2023
Rank 214 256 254
Rank change year-on-year +42 -2 +25
Contract jobs citing Root Cause Analysis 148 153 250
As % of all contract jobs advertised in London 1.13% 0.87% 0.99%
As % of the Processes & Methodologies category 1.22% 0.98% 1.09%
Number of daily rates quoted 80 107 164
10th Percentile £374 £279 £338
25th Percentile £425 £383 £450
Median daily rate (50th Percentile) £500 £508 £525
Median % change year-on-year -1.48% -3.33% -4.55%
75th Percentile £628 £638 £675
90th Percentile £751 £725 £784
England median daily rate £485 £500 £500
% change year-on-year -3.00% - -3.38%
Number of hourly rates quoted 4 0 3
10th Percentile - - £30.40
25th Percentile £28.25 - £38.50
Median hourly rate £29.50 - £52.00
75th Percentile £30.75 - £58.50
90th Percentile - - £62.40
England median hourly rate £32.50 £51.52 £39.25
% change year-on-year -36.91% +31.25% +25.68%

All Process and Methodology Skills
London

Root Cause Analysis falls under the Processes and Methodologies category. For comparison with the information above, the following table provides summary statistics for all contract job vacancies requiring process or methodology skills in London.

Contract vacancies with a requirement for process or methodology skills 12,082 15,598 22,961
As % of all contract IT jobs advertised in London 92.19% 88.50% 90.75%
Number of daily rates quoted 8,067 11,123 16,628
10th Percentile £331 £341 £372
25th Percentile £425 £445 £472
Median daily rate (50th Percentile) £550 £550 £588
Median % change year-on-year - -6.38% +2.17%
75th Percentile £675 £675 £700
90th Percentile £799 £800 £800
England median daily rate £515 £525 £550
% change year-on-year -1.90% -4.55% -
Number of hourly rates quoted 224 298 259
10th Percentile £16.50 £15.98 £18.50
25th Percentile £24.66 £20.02 £23.18
Median hourly rate £32.00 £30.00 £40.50
Median % change year-on-year +6.67% -25.93% +12.50%
75th Percentile £50.50 £48.75 £65.00
90th Percentile £63.60 £68.75 £82.50
England median hourly rate £25.15 £38.12 £37.50
% change year-on-year -34.02% +1.65% +44.23%

Root Cause Analysis
Job Vacancy Trend in London

Job postings citing Root Cause Analysis as a proportion of all IT jobs advertised in London.
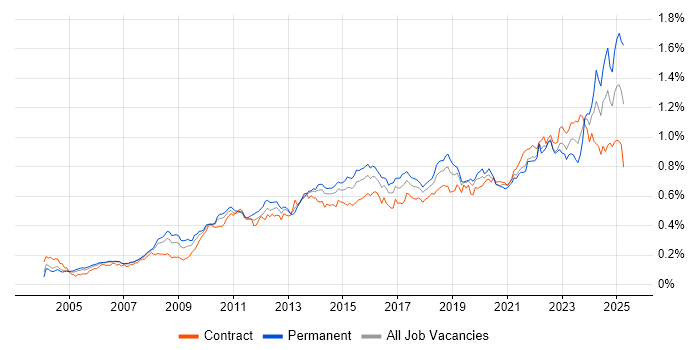
Job vacancy trend for Root Cause Analysis in London

Root Cause Analysis
Contractor Daily Rate Trend in London

3-month moving average daily rate quoted in jobs citing Root Cause Analysis in London.

Daily rate trend for Root Cause Analysis in London

Root Cause Analysis
Daily Rate Histogram in London

Daily rate distribution for jobs citing Root Cause Analysis in London over the 6 months to 3 July 2025.

Daily rate histogram for Root Cause Analysis in London

Root Cause Analysis
Contractor Hourly Rate Trend in London

3-month moving average hourly rates quoted in jobs citing Root Cause Analysis in London.

Hourly rate trend for Root Cause Analysis in London

Root Cause Analysis
Contract Job Locations in London

The table below looks at the demand and provides a guide to the median contractor rates quoted in IT jobs citing Root Cause Analysis within the London region over the 6 months to 3 July 2025. The 'Rank Change' column provides an indication of the change in demand within each location based on the same 6 month period last year.

Location Rank Change
on Same Period
Last Year
Matching
Contract
IT Job Ads
Median
Daily Rate
Past 6 Months
Median Daily Rate
% Change
on Same Period
Last Year
Live
Jobs
Central London -7 20 £513 -6.82% 83
South London 0 6 £734 +50.51% 8
East London +14 2 £608 +17.39% 4
West London - 2 £320 - 15
Root Cause Analysis
England

Root Cause Analysis
Co-occurring Skills and Capabilities in London by Category

The follow tables expand on the table above by listing co-occurrences grouped by category. The same employment type, locality and period is covered with up to 20 co-occurrences shown in each of the following categories:

Application Platforms
1 8 (5.41%) Confluence
2 5 (3.38%) Apache
3 4 (2.70%) WebSphere
4 3 (2.03%) Apache Airflow
5 2 (1.35%) Apache Spark
5 2 (1.35%) JBoss
5 2 (1.35%) Microsoft Exchange
5 2 (1.35%) SharePoint
5 2 (1.35%) WebSphere Application Server
6 1 (0.68%) Adobe Experience Manager
6 1 (0.68%) CICS
6 1 (0.68%) SAS
Applications
1 13 (8.78%) Microsoft Excel
2 4 (2.70%) Microsoft Office
2 4 (2.70%) Microsoft PowerPoint
3 1 (0.68%) Spreadsheet
Business Applications
1 3 (2.03%) SAP S/4HANA
2 1 (0.68%) FLEXCUBE
2 1 (0.68%) Kondor
2 1 (0.68%) Oracle EBS
2 1 (0.68%) Remedy ITSM
2 1 (0.68%) SAP GRC
Cloud Services
1 36 (24.32%) AWS
2 35 (23.65%) Azure
3 14 (9.46%) GCP
4 7 (4.73%) Azure DevOps
5 5 (3.38%) AWS CloudFormation
5 5 (3.38%) dbt
5 5 (3.38%) Power Platform
6 4 (2.70%) GitHub
6 4 (2.70%) Microsoft 365
6 4 (2.70%) Snowflake
7 3 (2.03%) GitHub Actions
7 3 (2.03%) OCI
8 2 (1.35%) Collibra
8 2 (1.35%) Datadog
8 2 (1.35%) Entra ID
8 2 (1.35%) OpenShift
8 2 (1.35%) PaaS
8 2 (1.35%) SaaS
9 1 (0.68%) Amazon EC2
9 1 (0.68%) Amazon S3
Communications & Networking
1 7 (4.73%) Firewall
2 3 (2.03%) BGP
2 3 (2.03%) DHCP
2 3 (2.03%) DNS
2 3 (2.03%) SSL
3 2 (1.35%) HTTPS
3 2 (1.35%) MPLS
3 2 (1.35%) NAS
3 2 (1.35%) Network Security
3 2 (1.35%) OSPF
3 2 (1.35%) SAN
3 2 (1.35%) SSH
3 2 (1.35%) TCP/IP
3 2 (1.35%) VLAN
3 2 (1.35%) VPN
4 1 (0.68%) Fibre Channel
4 1 (0.68%) Intrusion Detection
4 1 (0.68%) IPsec
4 1 (0.68%) iSCSI
4 1 (0.68%) Junos
Database & Business Intelligence
1 13 (8.78%) SQL Server
2 8 (5.41%) SQL Server Reporting Services
3 6 (4.05%) BigQuery
3 6 (4.05%) DB2
4 5 (3.38%) Data Warehouse
4 5 (3.38%) Power BI
4 5 (3.38%) Relational Database
4 5 (3.38%) Tableau
5 4 (2.70%) NoSQL
5 4 (2.70%) Oracle Database
6 3 (2.03%) Big Data
6 3 (2.03%) Metadata
6 3 (2.03%) Oracle Reports
7 2 (1.35%) Amazon Redshift
7 2 (1.35%) IMS/DB
7 2 (1.35%) MongoDB
7 2 (1.35%) MySQL
7 2 (1.35%) SAP BW
7 2 (1.35%) Sybase ASE
8 1 (0.68%) CouchDB
Development Applications
1 16 (10.81%) JIRA
2 9 (6.08%) Git
3 4 (2.70%) Bitbucket
3 4 (2.70%) Jenkins
3 4 (2.70%) JMeter
3 4 (2.70%) LoadRunner
3 4 (2.70%) Serenity BDD
4 3 (2.03%) Artifactory
4 3 (2.03%) Postman
4 3 (2.03%) Selenium
5 2 (1.35%) MSTest
5 2 (1.35%) NSubstitute
5 2 (1.35%) NUnit
5 2 (1.35%) REST Assured
5 2 (1.35%) SoapUI
5 2 (1.35%) Visual Studio Coded UI
6 1 (0.68%) Cucumber
6 1 (0.68%) Locust
6 1 (0.68%) Maven
6 1 (0.68%) Visual Studio
General
1 60 (40.54%) Social Skills
2 39 (26.35%) Finance
3 34 (22.97%) Analytical Skills
4 23 (15.54%) Banking
5 8 (5.41%) Presentation Skills
6 6 (4.05%) Documentation Skills
7 4 (2.70%) Inclusion and Diversity
7 4 (2.70%) Influencing Skills
7 4 (2.70%) Legal
7 4 (2.70%) Public Sector
8 3 (2.03%) Financial Institution
9 2 (1.35%) Investment Banking
9 2 (1.35%) Spanish Language
10 1 (0.68%) Back Office
10 1 (0.68%) Billing
10 1 (0.68%) International Banking
10 1 (0.68%) Local Government
10 1 (0.68%) Retail
10 1 (0.68%) Retail Banking
10 1 (0.68%) Wholesale Banking
Job Titles
1 27 (18.24%) Analyst
2 21 (14.19%) Developer
3 18 (12.16%) Senior
4 12 (8.11%) Consultant
5 11 (7.43%) Lead
6 9 (6.08%) Business Analyst
7 8 (5.41%) Automation Developer
7 8 (5.41%) Data Analyst
8 7 (4.73%) Site Engineer
8 7 (4.73%) Site Reliability Engineer
9 6 (4.05%) Applications Support
9 6 (4.05%) Robotic Process Automation Developer
10 5 (3.38%) Architect
11 4 (2.70%) Applications Developer
11 4 (2.70%) Performance Test Consultant
11 4 (2.70%) QA Engineer
11 4 (2.70%) Security Analyst
11 4 (2.70%) Senior Consultant
11 4 (2.70%) Test Consultant
11 4 (2.70%) Test Manager
Libraries, Frameworks & Software Standards
1 15 (10.14%) .NET
2 9 (6.08%) REST
3 8 (5.41%) Kafka
4 7 (4.73%) Web Services
5 6 (4.05%) XML
6 5 (3.38%) CSS
6 5 (3.38%) jQuery
6 5 (3.38%) JSON
6 5 (3.38%) LDAP
7 4 (2.70%) Elastic Stack
7 4 (2.70%) HTML
7 4 (2.70%) OAuth
7 4 (2.70%) OAuth2
7 4 (2.70%) OpenID
7 4 (2.70%) SAML
7 4 (2.70%) WebSphere MQ
8 3 (2.03%) Apache NiFi
8 3 (2.03%) Great Expectations
8 3 (2.03%) J2EE
8 3 (2.03%) Middleware
Miscellaneous
1 11 (7.43%) Onboarding
2 10 (6.76%) Data Protection Act
3 6 (4.05%) Security Posture
4 5 (3.38%) Distributed Systems
4 5 (3.38%) Low-Code
4 5 (3.38%) Management Information System
4 5 (3.38%) Replication
5 4 (2.70%) Data Centre
5 4 (2.70%) Mainframe
5 4 (2.70%) Social Media
5 4 (2.70%) Video\Live Streaming
5 4 (2.70%) Virtual Team
6 2 (1.35%) Clustering
6 2 (1.35%) CMDB
6 2 (1.35%) Cyber Defence
6 2 (1.35%) Foreign Exchange (FX)
6 2 (1.35%) Hedge funds
6 2 (1.35%) Hybrid Cloud
6 2 (1.35%) Security Operations Centre
6 2 (1.35%) SWIFT Messaging Network
Operating Systems
1 15 (10.14%) Windows
2 7 (4.73%) Unix
3 6 (4.05%) Linux
4 2 (1.35%) Windows 10
4 2 (1.35%) Windows Server
5 1 (0.68%) Apple iOS
5 1 (0.68%) Mac OS
5 1 (0.68%) Oracle Linux
5 1 (0.68%) Red Hat Enterprise Linux
5 1 (0.68%) Solaris
5 1 (0.68%) Windows Server 2012
5 1 (0.68%) Windows Server 2016
Processes & Methodologies
1 56 (37.84%) Problem-Solving
2 39 (26.35%) DevOps
3 37 (25.00%) Agile
4 28 (18.92%) CI/CD
4 28 (18.92%) Stakeholder Management
5 18 (12.16%) Microservices
5 18 (12.16%) Test Automation
6 17 (11.49%) Data Analysis
7 16 (10.81%) Containerisation
7 16 (10.81%) ITIL
8 15 (10.14%) Data Protection
8 15 (10.14%) Incident Management
8 15 (10.14%) Process Improvement
9 14 (9.46%) Problem Management
10 13 (8.78%) Continuous Improvement
10 13 (8.78%) Migration
10 13 (8.78%) User Acceptance Testing
11 12 (8.11%) Data Governance
11 12 (8.11%) High Availability
11 12 (8.11%) Incident Response
Programming Languages
1 48 (32.43%) SQL
2 40 (27.03%) Python
3 21 (14.19%) C#
4 14 (9.46%) Java
5 10 (6.76%) Bash
5 10 (6.76%) JavaScript
5 10 (6.76%) PowerShell
6 5 (3.38%) PL/SQL
6 5 (3.38%) REXX
7 3 (2.03%) ActionScript
7 3 (2.03%) ActionScript 2.0
7 3 (2.03%) CLIST
7 3 (2.03%) Go
7 3 (2.03%) Search Processing Language
7 3 (2.03%) TypeScript
8 1 (0.68%) ABAP
8 1 (0.68%) COBOL
8 1 (0.68%) R
8 1 (0.68%) Shell Script
8 1 (0.68%) VBScript
Qualifications
1 21 (14.19%) Security Cleared
2 18 (12.16%) SC Cleared
3 12 (8.11%) Degree
4 8 (5.41%) Computer Science Degree
5 5 (3.38%) CompTIA Security+
6 4 (2.70%) BPSS Clearance
6 4 (2.70%) Cisco Certification
6 4 (2.70%) CISSP
7 3 (2.03%) CEH
7 3 (2.03%) Master's Degree
7 3 (2.03%) SSCP
8 2 (1.35%) CCNA
8 2 (1.35%) OSCP
9 1 (0.68%) AWS Certification
9 1 (0.68%) CCIE
9 1 (0.68%) CCNP
9 1 (0.68%) CCSP
9 1 (0.68%) DV Cleared
9 1 (0.68%) ITIL Certification
9 1 (0.68%) Six Sigma Black Belt
Quality Assurance & Compliance
1 12 (8.11%) Data Quality
2 11 (7.43%) QA
3 6 (4.05%) GDPR
4 4 (2.70%) ISO/IEC 27001
4 4 (2.70%) NIST
4 4 (2.70%) SLA
5 2 (1.35%) EMIR
5 2 (1.35%) GRC
5 2 (1.35%) MiFID
5 2 (1.35%) PCI DSS
5 2 (1.35%) Sarbanes-Oxley
6 1 (0.68%) COBIT
6 1 (0.68%) HIPAA
6 1 (0.68%) ISO 20022
6 1 (0.68%) NCSC
6 1 (0.68%) PMO
System Software
1 12 (8.11%) Active Directory
2 5 (3.38%) Docker
3 3 (2.03%) Firmware
4 2 (1.35%) IAG
4 2 (1.35%) VMware ESXi
4 2 (1.35%) VMware Infrastructure
5 1 (0.68%) Oracle RAC
5 1 (0.68%) VMware NSX
Systems Management
1 16 (10.81%) Terraform
2 15 (10.14%) Kubernetes
3 8 (5.41%) Ansible
4 5 (3.38%) Grafana
4 5 (3.38%) Single Sign-On
5 4 (2.70%) Perfmon
5 4 (2.70%) Prometheus
6 3 (2.03%) Tivoli NetView
7 2 (1.35%) OMEGAMON
7 2 (1.35%) Oracle Enterprise Manager
7 2 (1.35%) Oracle RMAN
8 1 (0.68%) Cisco CUCM
8 1 (0.68%) Data Guard
8 1 (0.68%) EMC NetWorker
8 1 (0.68%) HAProxy
8 1 (0.68%) Progress Chef
8 1 (0.68%) Puppet
8 1 (0.68%) SCCM
8 1 (0.68%) Tivoli Storage Manager
8 1 (0.68%) vMotion
Vendors
1 23 (15.54%) Oracle
2 16 (10.81%) Microsoft
3 14 (9.46%) Splunk
4 13 (8.78%) ServiceNow
5 10 (6.76%) IBM
6 7 (4.73%) SAP
6 7 (4.73%) UiPath
7 6 (4.05%) Dynatrace
8 5 (3.38%) Google
8 5 (3.38%) OutSystems
9 4 (2.70%) ForgeRock
9 4 (2.70%) New Relic
9 4 (2.70%) Salesforce
10 3 (2.03%) Cisco
10 3 (2.03%) Sybase
10 3 (2.03%) Workday
11 2 (1.35%) BMC
11 2 (1.35%) Citrix
11 2 (1.35%) Informatica
11 2 (1.35%) Juniper