Technical Leadership Contracts in London

Technical Leadership
England > London

The table below provides summary statistics for contract job vacancies advertised in London requiring Technical Leadership skills. It includes a benchmarking guide to the contractor rates offered in vacancies that cited Technical Leadership over the 6 months leading up to 22 August 2025, comparing them to the same period in the previous two years.

6 months to
22 Aug 2025
Same period 2024 Same period 2023
Rank 130 219 232
Rank change year-on-year +89 +13 +75
DemandTrendContract jobs citing Technical Leadership 280 171 244
As % of all contract jobs advertised in London 2.09% 1.05% 1.06%
As % of the Processes & Methodologies category 2.26% 1.18% 1.17%
Number of daily rates quoted 189 105 182
10th Percentile £400 £441 £478
25th Percentile £513 £513 £585
Median daily rate (50th Percentile) £625 £625 £663
Median % change year-on-year - -5.66% +3.92%
75th Percentile £713 £700 £742
90th Percentile £800 £830 £814
England median daily rate £588 £620 £628
% change year-on-year -5.24% -1.27% +4.67%
Number of hourly rates quoted 7 0 2
10th Percentile - - £34.18
25th Percentile - - £39.31
Median hourly rate £24.66 - £48.25
75th Percentile - - £56.81
90th Percentile £54.80 - £61.73
England median hourly rate £70.16 £38.50 £25.75
% change year-on-year +82.23% +49.51% -66.56%

All Process and Methodology Skills
London

Technical Leadership falls under the Processes and Methodologies category. For comparison with the information above, the following table provides summary statistics for all contract job vacancies requiring process or methodology skills in London.

DemandTrendContract vacancies with a requirement for process or methodology skills 12,403 14,431 20,902
As % of all contract IT jobs advertised in London 92.43% 88.87% 90.61%
Number of daily rates quoted 8,253 10,018 15,217
10th Percentile £325 £350 £363
25th Percentile £425 £450 £463
Median daily rate (50th Percentile) £540 £550 £575
Median % change year-on-year -1.82% -4.35% -
75th Percentile £675 £688 £700
90th Percentile £775 £800 £800
England median daily rate £510 £525 £550
% change year-on-year -2.86% -4.55% -
Number of hourly rates quoted 253 195 226
10th Percentile £16.50 £17.35 £18.00
25th Percentile £24.66 £22.00 £22.56
Median hourly rate £29.50 £35.00 £39.92
Median % change year-on-year -15.71% -12.31% +6.44%
75th Percentile £48.75 £53.75 £64.38
90th Percentile £63.75 £71.63 £78.75
England median hourly rate £25.15 £42.50 £41.50
% change year-on-year -40.82% +2.41% +53.76%

Technical Leadership
Job Vacancy Trend in London

Job postings citing Technical Leadership as a proportion of all IT jobs advertised in London.
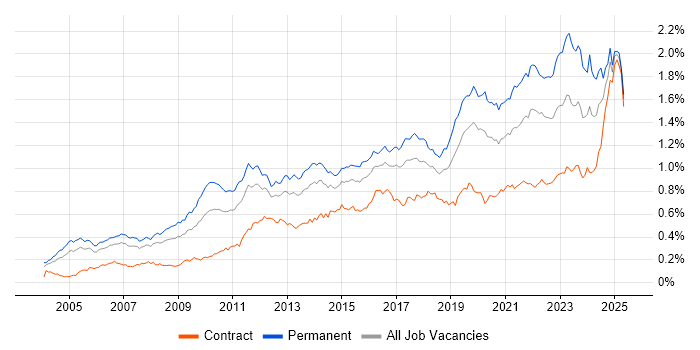
Job vacancy trend for Technical Leadership in London

Technical Leadership
Daily Rate Trend in London

Contractor daily rate distribution trend for jobs in London citing Technical Leadership.

Contractor daily rate distribution trend for jobs in London citing Technical Leadership

Technical Leadership
Daily Rate Histogram in London

Daily rate distribution for jobs citing Technical Leadership in London over the 6 months to 22 August 2025.

Daily rate histogram for Technical Leadership in London

Technical Leadership
Hourly Rate Trend in London

Contractor hourly rate distribution trend for jobs in London citing Technical Leadership.

Contractor hourly rate distribution trend for jobs in London citing Technical Leadership

Technical Leadership
Hourly Rate Histogram in London

Hourly rate distribution of jobs citing Technical Leadership in London over the 6 months to 22 August 2025.

Hourly rate histogram for Technical Leadership in London

Technical Leadership
DemandTrendContract Job Locations in London

The table below looks at the demand and provides a guide to the median contractor rates quoted in IT jobs citing Technical Leadership within the London region over the 6 months to 22 August 2025. The 'Rank Change' column provides an indication of the change in demand within each location based on the same 6 month period last year.

Location Rank Change
on Same Period
Last Year
Matching
DemandTrendContract
IT Job Ads
Median
Daily Rate
Past 6 Months
Median Daily Rate
% Change
on Same Period
Last Year
Live
Jobs
Central London +35 53 £650 +18.18% 45
South London - 7 £500 -
East London +10 4 £630 -3.08% 9
West London - 4 £570 - 11
North London - 1 - -
Technical Leadership
England

Technical Leadership
Co-occurring Skills and Capabilities in London by Category

The follow tables expand on the table above by listing co-occurrences grouped by category. The same employment type, locality and period is covered with up to 20 co-occurrences shown in each of the following categories:

Application Platforms
1 21 (7.50%) Confluence
2 12 (4.29%) SharePoint
3 11 (3.93%) nginx
4 8 (2.86%) Microsoft Exchange
5 5 (1.79%) CMS
6 4 (1.43%) Headless CMS
6 4 (1.43%) Jupyter
7 2 (0.71%) Adobe Experience Manager
7 2 (0.71%) ArcGIS
7 2 (0.71%) Camunda
7 2 (0.71%) Oracle SOA Suite
8 1 (0.36%) Apache
8 1 (0.36%) Apache Spark
8 1 (0.36%) Cloud Foundry
8 1 (0.36%) JBoss
8 1 (0.36%) SAS
8 1 (0.36%) WebSphere
Applications
1 5 (1.79%) Microsoft Excel
1 5 (1.79%) Microsoft PowerPoint
2 4 (1.43%) Microsoft Office
3 3 (1.07%) MS Visio
4 1 (0.36%) Chatbot
Business Applications
1 10 (3.57%) SAP S/4HANA
2 4 (1.43%) Dynamics CRM
3 3 (1.07%) Salesforce CRM
3 3 (1.07%) Workday HCM
4 2 (0.71%) Oracle EBS
4 2 (0.71%) Oracle Procure-to-Pay
4 2 (0.71%) Oracle Subledger Accounting
4 2 (0.71%) SAP ERP
4 2 (0.71%) Temenos T24
5 1 (0.36%) Endur
5 1 (0.36%) NetSuite
5 1 (0.36%) Oracle Applications
5 1 (0.36%) Oracle ERP
5 1 (0.36%) Payment Gateway
5 1 (0.36%) SAP CO
5 1 (0.36%) SAP FI
5 1 (0.36%) SAP FI/CO
5 1 (0.36%) SAP PP
5 1 (0.36%) SAP PS
5 1 (0.36%) SAP SCM
Cloud Services
1 89 (31.79%) Azure
2 82 (29.29%) AWS
3 23 (8.21%) GCP
4 21 (7.50%) Microsoft 365
5 19 (6.79%) Serverless
6 14 (5.00%) AWS CloudFormation
6 14 (5.00%) AWS Lambda
6 14 (5.00%) GitHub
6 14 (5.00%) SaaS
7 13 (4.64%) Amazon S3
7 13 (4.64%) Power Platform
8 12 (4.29%) Entra ID
8 12 (4.29%) PaaS
9 11 (3.93%) Azure Data Factory
10 10 (3.57%) Amazon Cognito
10 10 (3.57%) Datadog
11 9 (3.21%) Amazon CloudWatch
11 9 (3.21%) GitHub Actions
11 9 (3.21%) Unqork
12 8 (2.86%) Dynamics 365
Communications & Networking
1 7 (2.50%) Network Security
2 5 (1.79%) Firewall
3 4 (1.43%) LAN
3 4 (1.43%) WAN
4 3 (1.07%) BGP
4 3 (1.07%) Bluetooth
4 3 (1.07%) OSPF
4 3 (1.07%) VPN
5 2 (0.71%) BIG-IP
5 2 (0.71%) Cisco ASA
5 2 (0.71%) F5 BIG-IP GTM
5 2 (0.71%) F5 BIG-IP LTM
5 2 (0.71%) SAN
5 2 (0.71%) SD-WAN
5 2 (0.71%) Software-Defined Networking
5 2 (0.71%) VLAN
6 1 (0.36%) Cisco ISE
6 1 (0.36%) NAS
6 1 (0.36%) Unified Communications
6 1 (0.36%) Wi-Fi
Database & Business Intelligence
1 16 (5.71%) SQL Server
2 11 (3.93%) DynamoDB
3 10 (3.57%) Big Data
3 10 (3.57%) PostgreSQL
4 9 (3.21%) Data Lake
4 9 (3.21%) Data Warehouse
5 7 (2.50%) Power BI
6 5 (1.79%) Amazon RDS
6 5 (1.79%) Metadata
7 4 (1.43%) MongoDB
7 4 (1.43%) Oracle Database
8 3 (1.07%) NoSQL
8 3 (1.07%) SAP BW
8 3 (1.07%) SAP Data Services
8 3 (1.07%) SAP HANA
9 2 (0.71%) Amazon Athena
9 2 (0.71%) GIS
9 2 (0.71%) Oracle Exadata
9 2 (0.71%) SQL Server Reporting Services
9 2 (0.71%) Tableau
Development Applications
1 36 (12.86%) Git
2 21 (7.50%) JIRA
3 10 (3.57%) Jenkins
4 4 (1.43%) Bitbucket
5 3 (1.07%) GitLab
6 2 (0.71%) Artifactory
6 2 (0.71%) CircleCI
6 2 (0.71%) SonarQube
7 1 (0.36%) Cypress.io
7 1 (0.36%) ERwin
7 1 (0.36%) MLflow
7 1 (0.36%) Storybook
General
1 117 (41.79%) Social Skills
2 82 (29.29%) Finance
3 42 (15.00%) Analytical Skills
4 27 (9.64%) Banking
5 23 (8.21%) Public Sector
6 8 (2.86%) Financial Institution
6 8 (2.86%) Marketing
7 7 (2.50%) Presentation Skills
8 5 (1.79%) Telecoms
9 3 (1.07%) Inclusion and Diversity
9 3 (1.07%) Influencing Skills
9 3 (1.07%) Investment Banking
9 3 (1.07%) Legal
9 3 (1.07%) Manufacturing
10 2 (0.71%) Aerospace
10 2 (0.71%) Digital Health
10 2 (0.71%) Documentation Skills
10 2 (0.71%) Electronics
10 2 (0.71%) General Ledger
10 2 (0.71%) Publishing
Job Titles
1 111 (39.64%) Architect
2 60 (21.43%) Lead
3 45 (16.07%) Solutions Architect
4 27 (9.64%) Senior
5 26 (9.29%) Developer
6 24 (8.57%) Technical Leader
7 15 (5.36%) Software Engineer
7 15 (5.36%) Technical Architect
8 11 (3.93%) Applications Architect
8 11 (3.93%) Lead Developer
9 10 (3.57%) Senior Developer
10 9 (3.21%) Cloud Architect
10 9 (3.21%) Consultant
10 9 (3.21%) Enterprise Architect
10 9 (3.21%) Java Developer
11 8 (2.86%) SAP Architect
11 8 (2.86%) Technology Specialist
12 7 (2.50%) Data Engineer
12 7 (2.50%) SAP Solutions Architect
12 7 (2.50%) Senior Architect
Libraries, Frameworks & Software Standards
1 24 (8.57%) REST
2 16 (5.71%) .NET
3 13 (4.64%) GraphQL
3 13 (4.64%) React
4 11 (3.93%) AngularJS
5 9 (3.21%) Kafka
5 9 (3.21%) Middleware
5 9 (3.21%) RESTful
5 9 (3.21%) Spring
6 8 (2.86%) Node.js
6 8 (2.86%) WebSockets
7 7 (2.50%) LangChain
7 7 (2.50%) OpenTelemetry
7 7 (2.50%) Spring Boot
8 6 (2.14%) Hugging Face
8 6 (2.14%) Lightning Web Components
8 6 (2.14%) Web Services
9 5 (1.79%) CSS
9 5 (1.79%) HTML
9 5 (1.79%) SOAP
Miscellaneous
1 18 (6.43%) Management Information System
2 17 (6.07%) Cloud Native
3 12 (4.29%) Public Cloud
4 11 (3.93%) Enterprise Software
5 10 (3.57%) Algorithms
5 10 (3.57%) Distributed Systems
5 10 (3.57%) Hedge funds
6 9 (3.21%) Data Structures
7 8 (2.86%) Product Ownership
8 6 (2.14%) Mobile App
8 6 (2.14%) Onboarding
9 5 (1.79%) Data Centre
9 5 (1.79%) Foreign Exchange (FX)
9 5 (1.79%) Legacy Systems
9 5 (1.79%) Self-Motivation
9 5 (1.79%) Virtual Team
10 3 (1.07%) CMDB
10 3 (1.07%) Data Protection Act
10 3 (1.07%) Greenfield Project
10 3 (1.07%) Private Cloud
Operating Systems
1 33 (11.79%) Linux
2 10 (3.57%) Windows
3 5 (1.79%) Android
3 5 (1.79%) Apple iOS
4 4 (1.43%) Unix
5 3 (1.07%) Red Hat Enterprise Linux
5 3 (1.07%) Windows 10
6 1 (0.36%) Windows Server
Processes & Methodologies
1 80 (28.57%) Agile
2 76 (27.14%) Mentoring
3 70 (25.00%) Problem-Solving
4 65 (23.21%) DevOps
5 54 (19.29%) CI/CD
6 41 (14.64%) Software Engineering
7 40 (14.29%) Roadmaps
8 33 (11.79%) Continuous Improvement
8 33 (11.79%) Microservices
9 29 (10.36%) Migration
10 28 (10.00%) Computer Science
10 28 (10.00%) Performance Optimisation
10 28 (10.00%) Stakeholder Management
11 27 (9.64%) Infrastructure as Code
12 26 (9.29%) Artificial Intelligence
13 25 (8.93%) Enterprise Architecture
14 24 (8.57%) Analytics
15 21 (7.50%) Data Integration
15 21 (7.50%) Test Automation
16 20 (7.14%) Event-Driven
Programming Languages
1 61 (21.79%) Python
2 52 (18.57%) Java
3 19 (6.79%) SQL
4 15 (5.36%) C#
5 11 (3.93%) C++
5 11 (3.93%) Go
5 11 (3.93%) JavaScript
6 8 (2.86%) PowerShell
6 8 (2.86%) TypeScript
7 4 (1.43%) Bash
7 4 (1.43%) R
8 3 (1.07%) Apex Code
8 3 (1.07%) Bicep
8 3 (1.07%) C
8 3 (1.07%) PL/SQL
8 3 (1.07%) Shell Script
9 2 (0.71%) AWK
9 2 (0.71%) Data Analysis Expressions
9 2 (0.71%) Kotlin
9 2 (0.71%) sed
Qualifications
1 73 (26.07%) Security Cleared
2 61 (21.79%) SC Cleared
3 40 (14.29%) Degree
4 25 (8.93%) Computer Science Degree
5 22 (7.86%) Master's Degree
6 12 (4.29%) DV Cleared
7 9 (3.21%) AWS Certification
7 9 (3.21%) SAP Certification
8 7 (2.50%) Cisco Certification
9 6 (2.14%) Azure Certification
9 6 (2.14%) CCNP
10 5 (1.79%) CCIE
10 5 (1.79%) Microsoft Certification
11 4 (1.43%) AWS Certified Solutions Architect
12 3 (1.07%) BPSS Clearance
12 3 (1.07%) EMC Certification
12 3 (1.07%) HNC
12 3 (1.07%) HND
12 3 (1.07%) PMI Certification
12 3 (1.07%) PMP
Quality Assurance & Compliance
1 13 (4.64%) QA
2 11 (3.93%) Data Quality
3 10 (3.57%) Accessibility
4 7 (2.50%) GDPR
5 5 (1.79%) NIST
6 3 (1.07%) COBIT
6 3 (1.07%) Def Stans
6 3 (1.07%) IEC 61508
6 3 (1.07%) ISO/IEC 15288
6 3 (1.07%) ISO/IEC 27001
6 3 (1.07%) PCI DSS
7 2 (0.71%) GAAP
7 2 (0.71%) PMO
8 1 (0.36%) Basel III
8 1 (0.36%) California Consumer Privacy Act
8 1 (0.36%) Cyber Essentials
8 1 (0.36%) Cyber Essentials PLUS
8 1 (0.36%) HIPAA
8 1 (0.36%) MiFID
8 1 (0.36%) NCSC
System Software
1 26 (9.29%) Docker
2 11 (3.93%) Active Directory
3 3 (1.07%) Virtual Machines
3 3 (1.07%) VMware Infrastructure
4 2 (0.71%) GPFS
4 2 (0.71%) NFS
5 1 (0.36%) OpenAM
5 1 (0.36%) OpenDJ
5 1 (0.36%) OpenIDM
Systems Management
1 33 (11.79%) Kubernetes
2 32 (11.43%) Terraform
3 11 (3.93%) Consul
3 11 (3.93%) Packer
4 10 (3.57%) Ansible
5 9 (3.21%) Prometheus
6 3 (1.07%) Functional Safety
7 2 (0.71%) Control-M
7 2 (0.71%) Data Guard
7 2 (0.71%) Grafana
7 2 (0.71%) Microsoft Intune
7 2 (0.71%) Oracle Enterprise Manager
7 2 (0.71%) SCCM
7 2 (0.71%) Single Sign-On
8 1 (0.36%) Kibana
8 1 (0.36%) Kubeflow
8 1 (0.36%) Symantec Endpoint Protection
Vendors
1 50 (17.86%) Microsoft
2 18 (6.43%) Oracle
3 17 (6.07%) Google
4 15 (5.36%) SAP
5 14 (5.00%) Databricks
5 14 (5.00%) ServiceNow
6 11 (3.93%) Salesforce
7 8 (2.86%) Cisco
8 7 (2.50%) OpenAI
9 6 (2.14%) IBM
9 6 (2.14%) Red Hat
10 5 (1.79%) VMware
11 4 (1.43%) F5
11 4 (1.43%) Juniper
11 4 (1.43%) Palantir
11 4 (1.43%) Workday
12 3 (1.07%) CheckPoint
12 3 (1.07%) Citrix
12 3 (1.07%) EMC
12 3 (1.07%) MuleSoft