MuleSoft Contracts

MuleSoft
UK

The table below provides summary statistics for contract job vacancies requiring knowledge or experience of MuleSoft products and/or services. It includes a benchmarking guide to contractor rates offered in vacancies that cited MuleSoft over the 6 months leading up to 3 July 2025, comparing them to the same period in the previous two years.

The figures below represent the IT contractor job market in general and are not representative of contractor rates within MuleSoft, Inc.

6 months to
3 Jul 2025
Same period 2024 Same period 2023
Rank 364 452 473
Rank change year-on-year +88 +21 +81
Contract jobs citing MuleSoft 177 138 214
As % of all contract jobs advertised in the UK 0.56% 0.32% 0.38%
As % of the Vendors category 1.19% 0.74% 0.88%
Number of daily rates quoted 112 88 151
10th Percentile £391 £448 £446
25th Percentile £463 £500 £511
Median daily rate (50th Percentile) £550 £575 £605
Median % change year-on-year -4.35% -4.96% +0.83%
75th Percentile £638 £630 £675
90th Percentile £694 £683 £738
UK excluding London median daily rate £500 £550 £550
% change year-on-year -9.09% - -
Number of hourly rates quoted 1 2 0
10th Percentile - £41.40 -
25th Percentile £61.25 £49.50 -
Median hourly rate £62.50 £63.00 -
Median % change year-on-year -0.79% - -
75th Percentile £63.75 £76.50 -
90th Percentile - £84.60 -
UK excluding London median hourly rate - £36.00 -

All Vendors
UK

MuleSoft falls under the Vendor Products and Services category. For comparison with the information above, the following table provides summary statistics for all contract job vacancies requiring knowledge or experience of all vendor products and services.

Contract vacancies with a requirement for knowledge or experience of vendor products and services 14,890 18,640 24,383
As % of all contract IT jobs advertised in the UK 47.53% 42.88% 43.69%
Number of daily rates quoted 9,101 11,577 16,146
10th Percentile £280 £271 £270
25th Percentile £400 £409 £413
Median daily rate (50th Percentile) £500 £515 £525
Median % change year-on-year -2.91% -1.90% -
75th Percentile £613 £625 £638
90th Percentile £713 £733 £738
UK excluding London median daily rate £480 £500 £500
% change year-on-year -4.00% - +5.26%
Number of hourly rates quoted 714 1,161 648
10th Percentile £14.78 £12.40 £15.00
25th Percentile £17.30 £15.00 £18.74
Median hourly rate £25.15 £24.18 £40.00
Median % change year-on-year +4.01% -39.55% +83.51%
75th Percentile £53.25 £59.95 £63.00
90th Percentile £68.00 £70.00 £72.50
UK excluding London median hourly rate £22.63 £22.56 £29.30
% change year-on-year +0.31% -23.00% +50.10%

MuleSoft
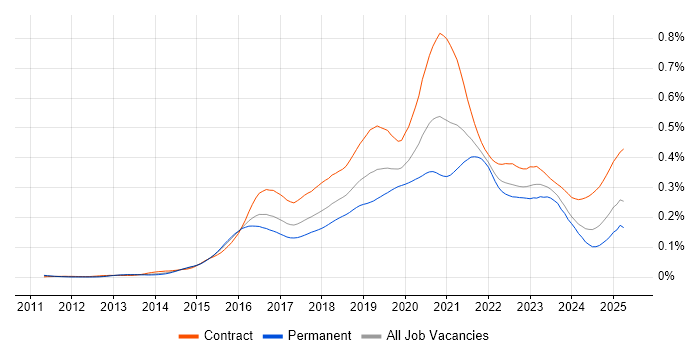
Job Vacancy Trend

Job postings citing MuleSoft as a proportion of all IT jobs advertised.

Job vacancy trend for MuleSoft in the UK

MuleSoft
Contractor Daily Rate Trend

3-month moving average daily rate quoted in jobs citing MuleSoft.

Daily rate trend for MuleSoft in the UK

MuleSoft
Daily Rate Histogram

Daily rate distribution for jobs citing MuleSoft over the 6 months to 3 July 2025.

Daily rate histogram for MuleSoft in the UK

MuleSoft
Contractor Hourly Rate Trend

3-month moving average hourly rates quoted in jobs citing MuleSoft.

Hourly rate trend for MuleSoft in the UK

MuleSoft
Top 15 Contract Locations

The table below looks at the demand and provides a guide to the median contractor rates quoted in IT jobs citing MuleSoft within the UK over the 6 months to 3 July 2025. The 'Rank Change' column provides an indication of the change in demand within each location based on the same 6 month period last year.

Location Rank Change
on Same Period
Last Year
Matching
Contract
IT Job Ads
Median
Daily Rate
Past 6 Months
Median Daily Rate
% Change
on Same Period
Last Year
Live
Jobs
England +95 143 £550 -8.33% 372
UK excluding London +87 91 £500 -9.09% 169
London +26 54 £600 - 217
Work from Home +26 50 £525 -2.33% 173
South East +74 34 £500 +33.33% 60
North of England +16 24 £495 -15.74% 40
Yorkshire +16 16 £450 -25.00% 18
Midlands +21 13 £540 -4.00% 27
West Midlands +13 9 £475 -18.28% 16
South West +37 8 £650 +23.81% 19
North West +5 8 £525 -4.55% 19
Scotland -3 6 £563 +7.14% 7
East Midlands +5 4 £558 +11.50% 11
Northern Ireland - 4 £475 -
East of England +25 2 £500 -13.04% 15

MuleSoft
Co-occurring Skills and Capabilities by Category

The follow tables expand on the table above by listing co-occurrences grouped by category. The same employment type, locality and period is covered with up to 20 co-occurrences shown in each of the following categories:

Application Platforms
1 39 (22.03%) Anypoint
2 20 (11.30%) Mule
3 8 (4.52%) Confluence
4 5 (2.82%) Mule ESB
5 3 (1.69%) BizTalk Server
5 3 (1.69%) JBoss
5 3 (1.69%) WebSphere
6 2 (1.13%) Apache
6 2 (1.13%) Apache Spark
6 2 (1.13%) WebSphere Application Server
7 1 (0.56%) CMS
7 1 (0.56%) Headless CMS
7 1 (0.56%) Microsoft Exchange
7 1 (0.56%) SharePoint
7 1 (0.56%) SharePoint Server
Applications
1 4 (2.26%) Microsoft Excel
2 3 (1.69%) Microsoft Office
3 2 (1.13%) Sketch
4 1 (0.56%) Microsoft PowerPoint
Business Applications
1 6 (3.39%) SAP S/4HANA
2 4 (2.26%) Oracle ERP
3 2 (1.13%) Dynamics CRM
3 2 (1.13%) Magento
3 2 (1.13%) NetSuite
3 2 (1.13%) Oracle Retail
3 2 (1.13%) SAP CX
3 2 (1.13%) Shopify
4 1 (0.56%) Dynamics AX
4 1 (0.56%) Oracle Applications
4 1 (0.56%) SAP CO
4 1 (0.56%) SAP FI
4 1 (0.56%) SAP FI/CO
Cloud Services
1 43 (24.29%) AWS
2 42 (23.73%) Azure
3 18 (10.17%) Boomi
4 16 (9.04%) GCP
5 14 (7.91%) Serverless
6 9 (5.08%) AWS Lambda
6 9 (5.08%) Azure DevOps
7 8 (4.52%) iPaaS
7 8 (4.52%) Power Platform
8 7 (3.95%) Salesforce Service Cloud
9 6 (3.39%) Apigee
9 6 (3.39%) SuccessFactors
10 5 (2.82%) Amazon S3
10 5 (2.82%) Entra ID
10 5 (2.82%) Salesforce Sales Cloud
11 4 (2.26%) GitHub
11 4 (2.26%) Salesforce Commerce Cloud
12 3 (1.69%) Azure Functions
12 3 (1.69%) PaaS
12 3 (1.69%) SaaS
Communications & Networking
1 16 (9.04%) Firewall
1 16 (9.04%) TCP/IP
2 9 (5.08%) LAN
2 9 (5.08%) WAN
3 4 (2.26%) HTTP
4 3 (1.69%) AMQP
4 3 (1.69%) DSL
4 3 (1.69%) SSL
5 2 (1.13%) DHCP
5 2 (1.13%) DNS
5 2 (1.13%) VPN
6 1 (0.56%) Converged Networks
6 1 (0.56%) FTP
6 1 (0.56%) VSAN
Database & Business Intelligence
1 17 (9.60%) MongoDB
2 11 (6.21%) NoSQL
3 9 (5.08%) MySQL
4 8 (4.52%) Power BI
4 8 (4.52%) Relational Database
5 6 (3.39%) PostgreSQL
6 5 (2.82%) Data Lake
7 4 (2.26%) Amazon Athena
7 4 (2.26%) Amazon Aurora
7 4 (2.26%) Amazon RDS
7 4 (2.26%) Electronic Patient Records
7 4 (2.26%) RDBMS
8 3 (1.69%) Azure SQL Database
8 3 (1.69%) Big Data
8 3 (1.69%) DynamoDB
9 2 (1.13%) Amazon QuickSight
9 2 (1.13%) DB2
9 2 (1.13%) IMS/DB
9 2 (1.13%) Tableau
10 1 (0.56%) SQL Server Reporting Services
Development Applications
1 27 (15.25%) Jenkins
2 17 (9.60%) Git
3 16 (9.04%) Postman
4 15 (8.47%) JIRA
5 8 (4.52%) GitLab
6 6 (3.39%) Maven
7 3 (1.69%) Bitbucket
8 2 (1.13%) Gradle
8 2 (1.13%) Selenium
8 2 (1.13%) TestPartner
9 1 (0.56%) Appium
9 1 (0.56%) Mockito
9 1 (0.56%) Oracle Forms
9 1 (0.56%) Toad
9 1 (0.56%) Visual Studio Code
9 1 (0.56%) WebDriver
General
1 49 (27.68%) Social Skills
2 38 (21.47%) Finance
3 26 (14.69%) Analytical Skills
4 19 (10.73%) Public Sector
5 14 (7.91%) Banking
6 7 (3.95%) Documentation Skills
7 6 (3.39%) Marketing
7 6 (3.39%) Retail
8 5 (2.82%) Law
8 5 (2.82%) Telecoms
9 4 (2.26%) Billing
10 3 (1.69%) Military
11 2 (1.13%) Automotive
11 2 (1.13%) Front Office
11 2 (1.13%) Investment Banking
11 2 (1.13%) Police
12 1 (0.56%) Aviation
12 1 (0.56%) Influencing Skills
Job Titles
1 46 (25.99%) Architect
2 42 (23.73%) Developer
3 28 (15.82%) Lead
4 26 (14.69%) MuleSoft Developer
5 23 (12.99%) Senior
6 16 (9.04%) Technical Architect
7 12 (6.78%) Consultant
8 9 (5.08%) Integration Architect
8 9 (5.08%) Technical Engineer
8 9 (5.08%) Windows Engineer
9 8 (4.52%) Analyst
9 8 (4.52%) Salesforce Developer
9 8 (4.52%) Senior Technical Engineer
9 8 (4.52%) Solutions Architect
10 7 (3.95%) Integration Consultant
10 7 (3.95%) Salesforce Architect
11 6 (3.39%) Integration Engineer
11 6 (3.39%) Tester
12 5 (2.82%) MuleSoft Architect
12 5 (2.82%) SAP Architect
Libraries, Frameworks & Software Standards
1 39 (22.03%) Middleware
1 39 (22.03%) REST
1 39 (22.03%) SOAP
2 28 (15.82%) RAML
3 25 (14.12%) XML
4 21 (11.86%) JSON
4 21 (11.86%) Kafka
4 21 (11.86%) RESTful
5 14 (7.91%) OAuth
5 14 (7.91%) Swagger
6 13 (7.34%) OpenAPI
7 12 (6.78%) Lightning Web Components
8 10 (5.65%) Web Services
9 9 (5.08%) JWT
10 7 (3.95%) OAuth2
11 6 (3.39%) .NET
11 6 (3.39%) RabbitMQ
11 6 (3.39%) React
12 5 (2.82%) AngularJS
12 5 (2.82%) SAML
Miscellaneous
1 13 (7.34%) Product Ownership
2 9 (5.08%) Cloud Native
3 8 (4.52%) Enterprise Software
4 7 (3.95%) SCADA
5 6 (3.39%) Onboarding
5 6 (3.39%) Public Cloud
6 5 (2.82%) Legacy Systems
6 5 (2.82%) Management Information System
7 4 (2.26%) Genomics
7 4 (2.26%) LIMS
7 4 (2.26%) NHS
8 3 (1.69%) Data Protection Act
8 3 (1.69%) Distributed Systems
8 3 (1.69%) TWAP
8 3 (1.69%) VWAP
9 2 (1.13%) Algorithms
9 2 (1.13%) Data Structures
9 2 (1.13%) IVR
10 1 (0.56%) Clustering
10 1 (0.56%) Mainframe
Operating Systems
1 24 (13.56%) Windows
2 21 (11.86%) Linux
3 9 (5.08%) Unix
4 6 (3.39%) Red Hat Enterprise Linux
5 3 (1.69%) AIX
5 3 (1.69%) CentOS
5 3 (1.69%) Solaris
5 3 (1.69%) SUSE Linux Enterprise Server
5 3 (1.69%) Ubuntu
6 2 (1.13%) Android
6 2 (1.13%) Apple iOS
7 1 (0.56%) Oracle Linux
7 1 (0.56%) SUSE
7 1 (0.56%) VMS
7 1 (0.56%) Windows Server
Processes & Methodologies
1 57 (32.20%) Agile
2 45 (25.42%) DevOps
3 38 (21.47%) API Management
3 38 (21.47%) CI/CD
4 33 (18.64%) Microservices
5 30 (16.95%) Problem-Solving
6 28 (15.82%) Translating Business Requirements
7 24 (13.56%) Migration
8 21 (11.86%) API Development
8 21 (11.86%) Architectural Patterns
8 21 (11.86%) Integration Patterns
9 20 (11.30%) Stakeholder Management
10 18 (10.17%) Scrum
11 17 (9.60%) API Design
11 17 (9.60%) Data Management
12 15 (8.47%) Configuration Management
13 13 (7.34%) Continuous Integration
13 13 (7.34%) Data Modelling
13 13 (7.34%) ETL
13 13 (7.34%) Test Automation
Programming Languages
1 32 (18.08%) Java
2 31 (17.51%) Python
3 25 (14.12%) SQL
4 16 (9.04%) DataWeave
5 12 (6.78%) Apex Code
6 10 (5.65%) PL/SQL
7 8 (4.52%) C#
8 6 (3.39%) JavaScript
9 4 (2.26%) Ruby
10 3 (1.69%) Bash
10 3 (1.69%) C++
10 3 (1.69%) Go
10 3 (1.69%) T-SQL
11 2 (1.13%) ABAP
11 2 (1.13%) Perl
11 2 (1.13%) R
11 2 (1.13%) REXX
12 1 (0.56%) COBOL
12 1 (0.56%) PowerShell
12 1 (0.56%) SOQL
Qualifications
1 21 (11.86%) Security Cleared
2 14 (7.91%) SC Cleared
3 12 (6.78%) Degree
4 4 (2.26%) TOGAF Certification
5 2 (1.13%) BPSS Clearance
5 2 (1.13%) Computer Science Degree
5 2 (1.13%) OCP
5 2 (1.13%) Oracle Certification
6 1 (0.56%) AWS Certification
6 1 (0.56%) AWS Certified Developer
6 1 (0.56%) Azure Certification
6 1 (0.56%) DBS Check
Quality Assurance & Compliance
1 7 (3.95%) QA
2 6 (3.39%) GDPR
3 5 (2.82%) Data Quality
3 5 (2.82%) SLA
4 3 (1.69%) Accessibility
4 3 (1.69%) PCI DSS
5 2 (1.13%) HIPAA
5 2 (1.13%) HL7
5 2 (1.13%) Section 508
5 2 (1.13%) WCAG
6 1 (0.56%) ISO 20022
6 1 (0.56%) SOC 2
System Software
1 15 (8.47%) VMware Infrastructure
2 11 (6.21%) Docker
3 6 (3.39%) Active Directory
3 6 (3.39%) Veritas Cluster Server
4 2 (1.13%) vSphere
5 1 (0.56%) Virtual Machines
5 1 (0.56%) VMware ESXi
Systems Management
1 21 (11.86%) Ansible
2 16 (9.04%) Puppet
3 14 (7.91%) Kubernetes
4 13 (7.34%) Terraform
5 10 (5.65%) CloudHub
6 8 (4.52%) Microsoft Clustering
7 5 (2.82%) HP ALM
7 5 (2.82%) SCCM
8 3 (1.69%) Single Sign-On
9 2 (1.13%) Istio
10 1 (0.56%) vCenter Server
Vendors
1 48 (27.12%) Salesforce
2 39 (22.03%) Oracle
3 27 (15.25%) Microsoft
4 17 (9.60%) SAP
5 16 (9.04%) VMware
6 11 (6.21%) Dell
7 10 (5.65%) Google
8 6 (3.39%) SnapLogic
8 6 (3.39%) Virgin Media
9 5 (2.82%) HP
9 5 (2.82%) ServiceNow
10 4 (2.26%) Atlassian
10 4 (2.26%) IBM
10 4 (2.26%) LabVantage
10 4 (2.26%) Red Hat
11 3 (1.69%) Jitterbit
11 3 (1.69%) Splunk
11 3 (1.69%) Talend
12 2 (1.13%) F5
12 2 (1.13%) VeriFone