Data Engineering Jobs in England

Data Engineering
UK > England

The table below provides summary statistics for permanent job vacancies advertised in England requiring Data Engineering skills. It includes a benchmarking guide to the annual salaries offered in vacancies that cited Data Engineering over the 6 months leading up to 1 May 2025, comparing them to the same period in the previous two years.

6 months to
1 May 2025
Same period 2024 Same period 2023
Rank 183 175 120
Rank change year-on-year -8 -55 +44
Permanent jobs citing Data Engineering 765 1,398 2,681
As % of all permanent jobs advertised in England 1.66% 1.64% 2.90%
As % of the Processes & Methodologies category 1.77% 1.91% 3.03%
Number of salaries quoted 523 818 1,112
10th Percentile £45,000 £41,492 £47,500
25th Percentile £55,125 £52,813 £58,728
Median annual salary (50th Percentile) £80,000 £70,000 £77,500
Median % change year-on-year +14.29% -9.68% -
75th Percentile £115,000 £88,750 £100,000
90th Percentile £135,000 £107,500 £130,000
UK median annual salary £80,000 £70,000 £75,000
% change year-on-year +14.29% -6.67% -

All Process and Methodology Skills
England

Data Engineering falls under the Processes and Methodologies category. For comparison with the information above, the following table provides summary statistics for all permanent job vacancies requiring process or methodology skills in England.

Permanent vacancies with a requirement for process or methodology skills 43,121 73,145 88,489
As % of all permanent jobs advertised in England 93.64% 85.85% 95.64%
Number of salaries quoted 23,789 53,950 52,293
10th Percentile £30,580 £29,000 £34,250
25th Percentile £42,500 £40,000 £46,000
Median annual salary (50th Percentile) £57,500 £55,000 £62,500
Median % change year-on-year +4.55% -12.00% +4.17%
75th Percentile £77,250 £73,750 £82,500
90th Percentile £100,000 £93,750 £101,250
UK median annual salary £57,500 £55,000 £61,500
% change year-on-year +4.55% -10.57% +2.50%

Data Engineering
Job Vacancy Trend in England

Job postings citing Data Engineering as a proportion of all IT jobs advertised in England.
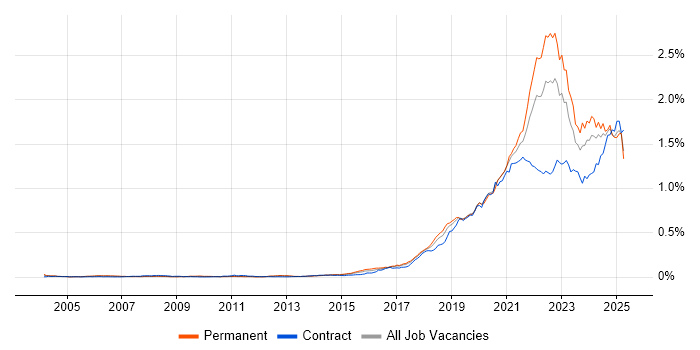
Job vacancy trend for Data Engineering in England

Data Engineering
Salary Trend in England

3-month moving average salary quoted in jobs citing Data Engineering in England.

Salary trend for Data Engineering in England

Data Engineering
Salary Histogram in England

Salary distribution for jobs citing Data Engineering in England over the 6 months to 1 May 2025.

Salary histogram for Data Engineering in England

Data Engineering
Job Locations in England

The table below looks at the demand and provides a guide to the median salaries quoted in IT jobs citing Data Engineering within the England region over the 6 months to 1 May 2025. The 'Rank Change' column provides an indication of the change in demand within each location based on the same 6 month period last year.

Location Rank Change
on Same Period
Last Year
Matching
Permanent
IT Job Ads
Median Salary
Past 6 Months
Median Salary
% Change
on Same Period
Last Year
Live
Jobs
London +33 362 £97,500 +18.18% 532
South East +74 160 £70,000 +3.70% 196
North of England -57 111 £62,500 +4.17% 104
Yorkshire +40 55 £62,500 -3.94% 36
Midlands -22 54 £57,500 - 51
North West -84 46 £67,500 +22.73% 56
West Midlands -17 35 £50,000 -18.85% 29
South West -3 34 £98,420 +31.23% 49
East of England +34 27 £50,000 -28.57% 32
East Midlands +9 19 £65,000 +52.94% 19
North East +7 10 £52,500 -30.00% 12
Data Engineering
UK

Data Engineering
Co-occurring Skills and Capabilities in England by Category

The follow tables expand on the table above by listing co-occurrences grouped by category. The same employment type, locality and period is covered with up to 20 co-occurrences shown in each of the following categories:

Application Platforms
1 148 (19.35%) Apache Airflow
2 136 (17.78%) Apache Spark
3 97 (12.68%) Apache
4 34 (4.44%) SharePoint
5 8 (1.05%) Confluence
6 7 (0.92%) SAS
7 5 (0.65%) Luigi
8 2 (0.26%) IBM Domino
9 1 (0.13%) Jupyter
9 1 (0.13%) Microsoft Exchange
9 1 (0.13%) Oracle Workflow
Applications
1 20 (2.61%) Microsoft Excel
2 5 (0.65%) Microsoft Office
2 5 (0.65%) Microsoft PowerPoint
3 2 (0.26%) Trello
4 1 (0.13%) SPSS
Business Applications
1 3 (0.39%) Dynamics CRM
2 1 (0.13%) Aladdin
2 1 (0.13%) SAP FI
Cloud Services
1 419 (54.77%) Azure
2 327 (42.75%) AWS
3 173 (22.61%) Power Platform
4 164 (21.44%) GCP
5 138 (18.04%) dbt
6 111 (14.51%) Serverless
7 106 (13.86%) Azure Data Factory
7 106 (13.86%) Azure Synapse Analytics
8 103 (13.46%) Snowflake
9 95 (12.42%) AWS Lambda
10 80 (10.46%) OpenShift
11 71 (9.28%) Amazon ECS
12 54 (7.06%) Azure DevOps
13 44 (5.75%) Power Automate
14 39 (5.10%) GitHub
15 35 (4.58%) PowerApps
16 33 (4.31%) Amazon S3
17 23 (3.01%) Dagster
18 19 (2.48%) GitHub Actions
19 16 (2.09%) Vertex AI
Communications & Networking
1 18 (2.35%) Firewall
2 6 (0.78%) Internet
3 4 (0.52%) 5G
3 4 (0.52%) Broadband
4 2 (0.26%) ADSL
4 2 (0.26%) DNS
5 1 (0.13%) Intrusion Detection
5 1 (0.13%) Network Security
5 1 (0.13%) VPN
Database & Business Intelligence
1 200 (26.14%) Data Warehouse
2 172 (22.48%) Power BI
3 144 (18.82%) Data Lake
4 113 (14.77%) Amazon Athena
5 106 (13.86%) Apache Iceberg
6 101 (13.20%) Dremio
7 84 (10.98%) Big Data
8 71 (9.28%) Apache Arrow
8 71 (9.28%) Apache Ignite
9 69 (9.02%) Tableau
10 53 (6.93%) SQL Server
11 52 (6.80%) NoSQL
12 51 (6.67%) Metadata
13 47 (6.14%) BigQuery
14 42 (5.49%) Amazon Redshift
15 38 (4.97%) Hadoop
16 37 (4.84%) Relational Database
17 31 (4.05%) Azure SQL Database
17 31 (4.05%) Data Mining
18 27 (3.53%) SQL Server Integration Services
Development Applications
1 73 (9.54%) Artifactory
2 28 (3.66%) Git
3 16 (2.09%) JIRA
4 15 (1.96%) Jenkins
5 10 (1.31%) CircleCI
6 9 (1.18%) Bitbucket
7 8 (1.05%) MLflow
8 7 (0.92%) GitLab
9 3 (0.39%) Spinnaker
10 2 (0.26%) Octopus Deploy
11 1 (0.13%) Gradle
11 1 (0.13%) JUnit
11 1 (0.13%) kappa
11 1 (0.13%) Selenium
11 1 (0.13%) Sonatype Nexus
11 1 (0.13%) SpecFlow
11 1 (0.13%) SQL Server Management Studio (SSMS)
11 1 (0.13%) TeamCity
11 1 (0.13%) TestNG
11 1 (0.13%) Visual Studio
General
1 283 (36.99%) Finance
2 208 (27.19%) Social Skills
3 163 (21.31%) Analytical Skills
4 116 (15.16%) Law
5 101 (13.20%) Front Office
6 95 (12.42%) Banking
7 47 (6.14%) Retail
8 36 (4.71%) Marketing
9 31 (4.05%) Manufacturing
10 26 (3.40%) Public Sector
11 24 (3.14%) Legal
12 12 (1.57%) Inclusion and Diversity
12 12 (1.57%) Pharmaceutical
12 12 (1.57%) Retail Banking
13 11 (1.44%) Influencing Skills
14 9 (1.18%) Investment Banking
14 9 (1.18%) Telecoms
15 8 (1.05%) Presentation Skills
16 6 (0.78%) Advertising
16 6 (0.78%) Automotive
Job Titles
1 366 (47.84%) Data Engineer
2 186 (24.31%) Lead
3 166 (21.70%) Senior
4 114 (14.90%) Python Engineer
5 106 (13.86%) AWS Engineer
6 91 (11.90%) Senior Data Engineer
7 86 (11.24%) DevOps Engineer
8 73 (9.54%) AWS DevOps
8 73 (9.54%) AWS DevOps Engineer
9 52 (6.80%) Lead Data Engineer
10 42 (5.49%) Python Data Engineer
11 40 (5.23%) Azure Engineer
12 34 (4.44%) Software Engineer
13 32 (4.18%) Architect
13 32 (4.18%) Data Manager
14 29 (3.79%) Azure Data Engineer
15 28 (3.66%) Data Scientist
16 23 (3.01%) Cloud Engineer
17 20 (2.61%) Data Architect
18 19 (2.48%) Security Engineer
Libraries, Frameworks & Software Standards
1 171 (22.35%) PySpark
2 126 (16.47%) Kafka
3 71 (9.28%) J2EE
4 41 (5.36%) NumPy
5 37 (4.84%) Pandas
6 25 (3.27%) SciPy
7 21 (2.75%) .NET
8 20 (2.61%) TensorFlow
9 19 (2.48%) PyTorch
10 15 (1.96%) scikit-learn
11 12 (1.57%) Plotly
11 12 (1.57%) REST
12 10 (1.31%) GraphQL
12 10 (1.31%) React
13 9 (1.18%) Keras
13 9 (1.18%) Middleware
13 9 (1.18%) PyArrow
14 7 (0.92%) AngularJS
14 7 (0.92%) Flask
14 7 (0.92%) RESTful
Miscellaneous
1 58 (7.58%) Algorithms
2 53 (6.93%) Product Ownership
3 39 (5.10%) Cloud Native
4 27 (3.53%) Data Structures
5 20 (2.61%) Management Information System
6 18 (2.35%) Cloud Security Posture
6 18 (2.35%) Equities
6 18 (2.35%) Fixed Income
6 18 (2.35%) Greenfield Project
6 18 (2.35%) Security Posture
7 13 (1.70%) Legacy Systems
8 11 (1.44%) Credit Risk
9 9 (1.18%) Learning Management System
9 9 (1.18%) Reinsurance
10 8 (1.05%) Distributed Computing
11 6 (0.78%) Distributed Systems
11 6 (0.78%) FMCG
12 5 (0.65%) Data Fabric
12 5 (0.65%) Distributed Applications
12 5 (0.65%) Life Science
Operating Systems
1 11 (1.44%) Linux
2 9 (1.18%) Unix
3 6 (0.78%) Windows
4 3 (0.39%) Ubuntu
5 2 (0.26%) VMS
Processes & Methodologies
1 364 (47.58%) Analytics
2 277 (36.21%) DevOps
3 263 (34.38%) Agile
4 250 (32.68%) CI/CD
5 245 (32.03%) Data Pipeline
6 230 (30.07%) ETL
7 219 (28.63%) Data Science
8 213 (27.84%) Business Intelligence
9 211 (27.58%) Software Engineering
10 209 (27.32%) Data Modelling
11 185 (24.18%) Machine Learning
12 174 (22.75%) Problem-Solving
13 160 (20.92%) Artificial Intelligence
14 158 (20.65%) Visualisation
15 151 (19.74%) Data Governance
16 145 (18.95%) Mentoring
17 130 (16.99%) Roadmaps
18 123 (16.08%) Asset Management
19 115 (15.03%) Data Management
20 110 (14.38%) Decision-Making
Programming Languages
1 481 (62.88%) Python
2 376 (49.15%) SQL
3 180 (23.53%) Java
4 77 (10.07%) Go
5 60 (7.84%) C#
6 50 (6.54%) Scala
7 34 (4.44%) R
8 31 (4.05%) T-SQL
9 28 (3.66%) Data Analysis Expressions
10 24 (3.14%) PowerShell
11 17 (2.22%) C++
12 16 (2.09%) JavaScript
13 11 (1.44%) Bash
14 8 (1.05%) Shell Script
15 6 (0.78%) SPARQL
16 3 (0.39%) Bicep
16 3 (0.39%) Cypher
16 3 (0.39%) MATLAB
16 3 (0.39%) TypeScript
17 2 (0.26%) Kusto Query Language
Qualifications
1 183 (23.92%) Degree
2 47 (6.14%) Security Cleared
3 43 (5.62%) SC Cleared
4 35 (4.58%) Master's Degree
5 29 (3.79%) AWS Certification
6 26 (3.40%) Azure Certification
7 24 (3.14%) Computer Science Degree
8 23 (3.01%) PhD
9 18 (2.35%) AWS Certified Cloud Practitioner
10 7 (0.92%) DBS Check
11 5 (0.65%) AWS Certified Solutions Architect
11 5 (0.65%) Numerate Degree
12 4 (0.52%) DV Cleared
13 2 (0.26%) SnowPro
13 2 (0.26%) Tableau Certification
14 1 (0.13%) (ISC)2 CCSP
14 1 (0.13%) BPSS Clearance
14 1 (0.13%) CCSP
14 1 (0.13%) CRISC
14 1 (0.13%) FFIEC
Quality Assurance & Compliance
1 175 (22.88%) Data Quality
2 52 (6.80%) Accessibility
3 38 (4.97%) QA
4 30 (3.92%) GDPR
5 4 (0.52%) ISO/IEC 27001
5 4 (0.52%) NIST
6 2 (0.26%) California Consumer Privacy Act
6 2 (0.26%) Dublin Core
7 1 (0.13%) Actionable Recommendations
7 1 (0.13%) Basel III
7 1 (0.13%) COBIT
7 1 (0.13%) IFRS
7 1 (0.13%) IFRS 9
7 1 (0.13%) PMO
7 1 (0.13%) SLA
System Software
1 124 (16.21%) Docker
2 11 (1.44%) HDFS
3 8 (1.05%) Active Directory
4 5 (0.65%) Apache Flume
4 5 (0.65%) Virtual Machines
5 1 (0.13%) Slurm Workload Manager
Systems Management
1 137 (17.91%) Terraform
2 129 (16.86%) Kubernetes
3 7 (0.92%) Grafana
3 7 (0.92%) Prometheus
4 5 (0.65%) Oozie
5 3 (0.39%) Ansible
5 3 (0.39%) Packer
6 1 (0.13%) Kubeflow
6 1 (0.13%) Single Sign-On
Vendors
1 186 (24.31%) Databricks
2 179 (23.40%) Microsoft
3 60 (7.84%) Google
4 26 (3.40%) ServiceNow
5 23 (3.01%) Informatica
6 15 (1.96%) OpenAI
6 15 (1.96%) Oracle
7 12 (1.57%) Red Hat
8 9 (1.18%) Palantir
9 8 (1.05%) Cloudera
9 8 (1.05%) SAP
10 6 (0.78%) Foundry
11 5 (0.65%) Atlassian
11 5 (0.65%) Talend
12 3 (0.39%) Cribl.io
12 3 (0.39%) Snowplow
12 3 (0.39%) Splunk
12 3 (0.39%) YouTube
13 2 (0.26%) IBM
13 2 (0.26%) StreamSets