ETL Jobs in England

Extract, Transform and Load (ETL)
UK > England

The table below provides summary statistics for permanent job vacancies advertised in England requiring ETL skills. It includes a benchmarking guide to the annual salaries offered in vacancies that cited ETL over the 6 months leading up to 1 May 2025, comparing them to the same period in the previous two years.

6 months to
1 May 2025
Same period 2024 Same period 2023
Rank 180 131 136
Rank change year-on-year -49 +5 -22
Permanent jobs citing ETL 772 1,847 2,433
As % of all permanent jobs advertised in England 1.68% 2.17% 2.63%
As % of the Processes & Methodologies category 1.79% 2.53% 2.75%
Number of salaries quoted 535 1,377 1,723
10th Percentile £41,250 £41,250 £42,500
25th Percentile £49,625 £47,500 £51,250
Median annual salary (50th Percentile) £62,500 £62,500 £65,500
Median % change year-on-year - -4.58% +9.17%
75th Percentile £83,750 £85,000 £83,500
90th Percentile £97,500 £95,000 £100,000
UK median annual salary £62,500 £60,500 £65,000
% change year-on-year +3.31% -6.92% +8.33%

All Process and Methodology Skills
England

ETL falls under the Processes and Methodologies category. For comparison with the information above, the following table provides summary statistics for all permanent job vacancies requiring process or methodology skills in England.

Permanent vacancies with a requirement for process or methodology skills 43,121 73,145 88,489
As % of all permanent jobs advertised in England 93.64% 85.85% 95.64%
Number of salaries quoted 23,789 53,950 52,293
10th Percentile £30,580 £29,000 £34,250
25th Percentile £42,500 £40,000 £46,000
Median annual salary (50th Percentile) £57,500 £55,000 £62,500
Median % change year-on-year +4.55% -12.00% +4.17%
75th Percentile £77,250 £73,750 £82,500
90th Percentile £100,000 £93,750 £101,250
UK median annual salary £57,500 £55,000 £61,500
% change year-on-year +4.55% -10.57% +2.50%

ETL
Job Vacancy Trend in England

Job postings citing ETL as a proportion of all IT jobs advertised in England.
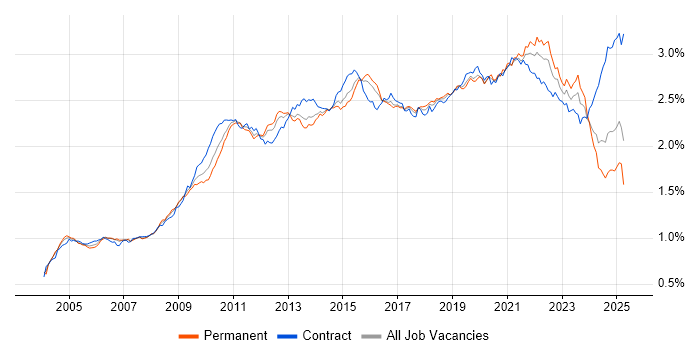
Job vacancy trend for ETL in England

ETL
Salary Trend in England

3-month moving average salary quoted in jobs citing ETL in England.

Salary trend for ETL in England

ETL
Salary Histogram in England

Salary distribution for jobs citing ETL in England over the 6 months to 1 May 2025.

Salary histogram for ETL in England

ETL
Job Locations in England

The table below looks at the demand and provides a guide to the median salaries quoted in IT jobs citing ETL within the England region over the 6 months to 1 May 2025. The 'Rank Change' column provides an indication of the change in demand within each location based on the same 6 month period last year.

Location Rank Change
on Same Period
Last Year
Matching
Permanent
IT Job Ads
Median Salary
Past 6 Months
Median Salary
% Change
on Same Period
Last Year
Live
Jobs
London -28 360 £75,000 +3.45% 520
North of England -74 123 £65,000 +19.27% 79
Midlands -5 106 £55,000 +2.54% 76
South East -19 103 £50,000 -20.00% 167
West Midlands -12 74 £55,000 - 50
Yorkshire +44 62 £65,000 +36.84% 22
North West -101 56 £57,500 +4.55% 51
East of England +27 37 £50,000 -9.09% 28
East Midlands +19 32 £48,500 +2.11% 21
South West +11 30 £48,918 -9.83% 59
North East -13 5 £72,500 +13.28% 8
ETL
UK

ETL
Co-occurring Skills and Capabilities in England by Category

The follow tables expand on the table above by listing co-occurrences grouped by category. The same employment type, locality and period is covered with up to 20 co-occurrences shown in each of the following categories:

Application Platforms
1 84 (10.88%) Apache Spark
2 60 (7.77%) Apache
3 54 (6.99%) Apache Airflow
4 25 (3.24%) SAS
5 17 (2.20%) SharePoint
6 10 (1.30%) Luigi
7 9 (1.17%) Oracle SOA Suite
8 7 (0.91%) Confluence
9 2 (0.26%) Microsoft Exchange
10 1 (0.13%) CMS
10 1 (0.13%) Jupyter
10 1 (0.13%) NetWeaver
10 1 (0.13%) Oracle Application Server
Applications
1 55 (7.12%) Microsoft Excel
2 17 (2.20%) Microsoft Office
3 5 (0.65%) MS Visio
3 5 (0.65%) SPSS
4 4 (0.52%) Microsoft PowerPoint
4 4 (0.52%) Microsoft Project
Business Applications
1 24 (3.11%) Oracle EBS
2 6 (0.78%) Infor M3
3 4 (0.52%) Elite 3E
3 4 (0.52%) Oracle BPM
4 3 (0.39%) NetSuite
4 3 (0.39%) Oracle General Ledger
4 3 (0.39%) Salesforce CRM
5 2 (0.26%) Dynamics GP
5 2 (0.26%) Oracle Subledger Accounting
6 1 (0.13%) Carpe Diem
6 1 (0.13%) Dynamics AX
6 1 (0.13%) Dynamics NAV
6 1 (0.13%) Oracle Applications
6 1 (0.13%) Oracle Assets
6 1 (0.13%) Oracle ERP
6 1 (0.13%) Oracle Payables
6 1 (0.13%) Oracle Receivables
6 1 (0.13%) SAP ERP
6 1 (0.13%) SAP MDG
6 1 (0.13%) SAP S/4HANA
Cloud Services
1 344 (44.56%) Azure
2 258 (33.42%) AWS
3 235 (30.44%) Power Platform
4 149 (19.30%) Azure Data Factory
5 126 (16.32%) Snowflake
6 117 (15.16%) GCP
7 73 (9.46%) Azure Synapse Analytics
8 58 (7.51%) dbt
9 57 (7.38%) Amazon S3
10 56 (7.25%) Serverless
11 42 (5.44%) Power Automate
12 37 (4.79%) AWS Lambda
13 33 (4.27%) SaaS
14 28 (3.63%) Azure DevOps
15 23 (2.98%) Azure Logic Apps
16 22 (2.85%) Dynamics 365
17 21 (2.72%) PowerApps
18 20 (2.59%) PaaS
19 17 (2.20%) Cloud Computing
19 17 (2.20%) GitHub
Communications & Networking
1 5 (0.65%) HTTP
1 5 (0.65%) Internet
2 2 (0.26%) DHCP
2 2 (0.26%) DNS
2 2 (0.26%) VoIP
Database & Business Intelligence
1 335 (43.39%) Data Warehouse
2 231 (29.92%) Power BI
3 147 (19.04%) Data Lake
4 137 (17.75%) SQL Server
5 111 (14.38%) SQL Server Integration Services
6 89 (11.53%) Big Data
7 83 (10.75%) NoSQL
8 73 (9.46%) Amazon Redshift
9 68 (8.81%) SQL Server Reporting Services
10 53 (6.87%) Tableau
11 48 (6.22%) Hadoop
11 48 (6.22%) Metadata
12 43 (5.57%) BigQuery
13 38 (4.92%) Azure SQL Database
14 36 (4.66%) Relational Database
15 29 (3.76%) MySQL
16 27 (3.50%) PostgreSQL
17 24 (3.11%) Power Query
18 23 (2.98%) Oracle ODI
19 22 (2.85%) DynamoDB
Development Applications
1 47 (6.09%) Git
2 26 (3.37%) JIRA
3 20 (2.59%) Visual Studio
4 19 (2.46%) Eclipse
4 19 (2.46%) Eclipse RCP
5 15 (1.94%) SQL Server Management Studio (SSMS)
6 14 (1.81%) Jenkins
7 13 (1.68%) Bitbucket
8 8 (1.04%) MLflow
9 7 (0.91%) ERwin
10 6 (0.78%) CircleCI
11 5 (0.65%) GitLab
12 3 (0.39%) Oracle Forms
12 3 (0.39%) Team Foundation Server
13 2 (0.26%) Atlassian Bamboo
13 2 (0.26%) IBM UrbanCode
13 2 (0.26%) Oracle APEX
13 2 (0.26%) Spinnaker
13 2 (0.26%) Visual Studio Team System
14 1 (0.13%) kappa
General
1 231 (29.92%) Social Skills
2 203 (26.30%) Finance
3 182 (23.58%) Analytical Skills
4 78 (10.10%) Law
5 45 (5.83%) Banking
6 35 (4.53%) Marketing
7 32 (4.15%) Inclusion and Diversity
8 27 (3.50%) Legal
9 24 (3.11%) Public Sector
10 23 (2.98%) Retail
11 22 (2.85%) Manufacturing
12 17 (2.20%) Games
13 12 (1.55%) Organisational Skills
14 11 (1.42%) Advertising
15 10 (1.30%) Telecoms
16 7 (0.91%) Documentation Skills
17 6 (0.78%) Front Office
18 5 (0.65%) Automotive
18 5 (0.65%) Billing
18 5 (0.65%) Electronics
Job Titles
1 287 (37.18%) Data Engineer
2 152 (19.69%) Senior
3 115 (14.90%) Developer
4 98 (12.69%) Lead
5 82 (10.62%) Senior Data Engineer
6 69 (8.94%) Architect
7 56 (7.25%) Analyst
8 42 (5.44%) Business Intelligence Developer
9 39 (5.05%) Software Engineer
10 38 (4.92%) Consultant
11 34 (4.40%) Data Architect
12 32 (4.15%) Lead Data Engineer
13 29 (3.76%) Solutions Architect
14 28 (3.63%) Business Intelligence Analyst
15 27 (3.50%) Data Manager
16 25 (3.24%) AWS Engineer
17 24 (3.11%) AWS Data Engineer
18 23 (2.98%) Azure Engineer
19 22 (2.85%) Power BI Developer
20 21 (2.72%) Data Consultant
Libraries, Frameworks & Software Standards
1 66 (8.55%) PySpark
2 46 (5.96%) Kafka
3 30 (3.89%) REST
4 23 (2.98%) Pandas
5 21 (2.72%) Middleware
6 20 (2.59%) HTML
6 20 (2.59%) JSON
7 19 (2.46%) CSS
7 19 (2.46%) JSP
7 19 (2.46%) Oracle Fusion
7 19 (2.46%) XML
8 18 (2.33%) .NET
9 16 (2.07%) React
10 14 (1.81%) Web Services
11 11 (1.42%) GraphQL
11 11 (1.42%) RESTful
11 11 (1.42%) TensorFlow
12 10 (1.30%) PyTorch
12 10 (1.30%) Redux
13 9 (1.17%) PyArrow
Miscellaneous
1 68 (8.81%) Data Structures
2 49 (6.35%) Management Information System
3 40 (5.18%) Legacy Systems
4 29 (3.76%) Product Ownership
5 25 (3.24%) Cloud Native
6 23 (2.98%) Algorithms
7 14 (1.81%) Distributed Systems
8 13 (1.68%) Greenfield Project
9 9 (1.17%) Analytical Mindset
9 9 (1.17%) Self-Motivation
10 8 (1.04%) Credit Risk
10 8 (1.04%) Distributed Computing
10 8 (1.04%) Market Risk
11 6 (0.78%) Data Fabric
11 6 (0.78%) FMCG
11 6 (0.78%) Mobile Games
11 6 (0.78%) Reference Data
11 6 (0.78%) Replication
12 5 (0.65%) Linux Command Line
12 5 (0.65%) Virtual Team
Operating Systems
1 38 (4.92%) Linux
2 27 (3.50%) Windows
3 14 (1.81%) Unix
4 3 (0.39%) Ubuntu
5 2 (0.26%) SUSE
6 1 (0.13%) Windows Server
Processes & Methodologies
1 333 (43.13%) Analytics
2 329 (42.62%) Business Intelligence
3 289 (37.44%) Data Modelling
4 260 (33.68%) Data Pipeline
5 230 (29.79%) Data Engineering
6 208 (26.94%) Problem-Solving
7 161 (20.85%) Agile
8 159 (20.60%) Visualisation
9 146 (18.91%) CI/CD
10 137 (17.75%) Data Governance
11 119 (15.41%) DevOps
12 116 (15.03%) Data Science
13 114 (14.77%) Decision-Making
14 109 (14.12%) Data Management
15 104 (13.47%) Data Integration
15 104 (13.47%) Data Visualisation
16 101 (13.08%) Machine Learning
17 100 (12.95%) Data Architecture
18 98 (12.69%) Migration
19 96 (12.44%) Software Engineering
Programming Languages
1 576 (74.61%) SQL
2 414 (53.63%) Python
3 79 (10.23%) T-SQL
4 78 (10.10%) Java
5 56 (7.25%) C#
6 52 (6.74%) Data Analysis Expressions
7 45 (5.83%) Scala
8 39 (5.05%) R
9 35 (4.53%) PowerShell
10 33 (4.27%) PL/SQL
11 19 (2.46%) JavaScript
12 16 (2.07%) Ada
12 16 (2.07%) Bash
12 16 (2.07%) Rust
13 12 (1.55%) MATLAB
14 10 (1.30%) Go
15 8 (1.04%) SPARQL
16 7 (0.91%) Shell Script
17 6 (0.78%) PHP
18 5 (0.65%) C++
Qualifications
1 158 (20.47%) Degree
2 53 (6.87%) Computer Science Degree
3 34 (4.40%) Security Cleared
4 33 (4.27%) Azure Certification
5 30 (3.89%) SC Cleared
6 23 (2.98%) Master's Degree
7 20 (2.59%) BPSS Clearance
8 13 (1.68%) AWS Certification
9 11 (1.42%) DBS Check
10 8 (1.04%) DV Cleared
10 8 (1.04%) Microsoft Certification
11 6 (0.78%) Six Sigma Black Belt
12 5 (0.65%) ACCA
12 5 (0.65%) CIMA
12 5 (0.65%) PMI Certification
13 4 (0.52%) HND
13 4 (0.52%) PhD
13 4 (0.52%) SnowPro
14 2 (0.26%) Numerate Degree
14 2 (0.26%) Tableau Certification
Quality Assurance & Compliance
1 165 (21.37%) Data Quality
2 48 (6.22%) Accessibility
3 42 (5.44%) GDPR
4 41 (5.31%) QA
5 9 (1.17%) ISO/IEC 27001
5 9 (1.17%) PCI DSS
6 7 (0.91%) Basel II
6 7 (0.91%) Basel III
6 7 (0.91%) Dodd-Frank
6 7 (0.91%) IFRS
6 7 (0.91%) IFRS 9
7 6 (0.78%) GxP
8 5 (0.65%) Cyber Essentials
9 3 (0.39%) HIPAA
9 3 (0.39%) SOC 2
10 2 (0.26%) California Consumer Privacy Act
10 2 (0.26%) Dublin Core
11 1 (0.13%) ISO 9001
11 1 (0.13%) Sarbanes-Oxley
System Software
1 40 (5.18%) Docker
2 10 (1.30%) HDFS
3 6 (0.78%) Active Directory
4 5 (0.65%) Apache Flume
5 4 (0.52%) Virtual Machines
6 2 (0.26%) VMware Infrastructure
6 2 (0.26%) vSphere
Systems Management
1 42 (5.44%) Terraform
2 41 (5.31%) Kubernetes
3 10 (1.30%) Grafana
3 10 (1.30%) Prometheus
4 7 (0.91%) Ansible
5 5 (0.65%) Oozie
6 2 (0.26%) SCCM
6 2 (0.26%) SCOM
7 1 (0.13%) Istio
7 1 (0.13%) Kubeflow
7 1 (0.13%) Oracle RMAN
Vendors
1 160 (20.73%) Microsoft
2 136 (17.62%) Databricks
3 93 (12.05%) Oracle
4 44 (5.70%) Informatica
5 41 (5.31%) Google
6 28 (3.63%) SAP
7 21 (2.72%) Alteryx
8 16 (2.07%) Salesforce
9 13 (1.68%) Red Hat
10 11 (1.42%) Talend
11 8 (1.04%) Cloudera
12 6 (0.78%) Aderant
12 6 (0.78%) Infor
13 5 (0.65%) Intel
13 5 (0.65%) Vertica
14 4 (0.52%) Palantir
14 4 (0.52%) Zoho
15 3 (0.39%) IBM
15 3 (0.39%) JD Edwards
15 3 (0.39%) QAD