SOA Jobs in England

Service-Oriented Architecture (SOA)
UK > England

The following table provides summary statistics for permanent job vacancies advertised in England with a requirement for SOA skills. Included is a benchmarking guide to the salaries offered in vacancies that have cited SOA over the 6 months to 11 May 2024 with a comparison to the same period in the previous 2 years.

6 months to
11 May 2024
Same period 2023 Same period 2022
Rank 646 403 352
Rank change year-on-year -243 -51 -51
Permanent jobs citing SOA 193 683 1,458
As % of all permanent jobs advertised in England 0.22% 0.76% 1.10%
As % of the Processes & Methodologies category 0.26% 0.80% 1.14%
Number of salaries quoted 155 394 564
10th Percentile £51,250 £47,500 £47,325
25th Percentile £55,447 £56,250 £56,250
Median annual salary (50th Percentile) £72,500 £72,500 £70,000
Median % change year-on-year - +3.57% -6.67%
75th Percentile £92,125 £88,750 £87,500
90th Percentile £99,000 £105,000 £100,750
UK median annual salary £80,000 £72,500 £70,000
% change year-on-year +10.34% +3.57% -6.67%

All Process and Methodology Skills
England

SOA is in the Processes and Methodologies category. The following table is for comparison with the above and provides summary statistics for all permanent job vacancies advertised in England with a requirement for process or methodology skills.

Permanent vacancies with a requirement for process or methodology skills 73,416 85,899 127,462
As % of all permanent jobs advertised in England 85.47% 95.61% 95.75%
Number of salaries quoted 53,988 50,919 73,096
10th Percentile £29,000 £34,308 £33,500
25th Percentile £40,000 £46,000 £44,186
Median annual salary (50th Percentile) £55,000 £62,500 £60,000
Median % change year-on-year -12.00% +4.17% +9.09%
75th Percentile £73,500 £82,500 £80,000
90th Percentile £93,750 £101,250 £97,500
UK median annual salary £55,000 £61,000 £60,000
% change year-on-year -9.84% +1.67% +9.09%

SOA
Job Vacancy Trend in England

Job postings citing SOA as a proportion of all IT jobs advertised in England.
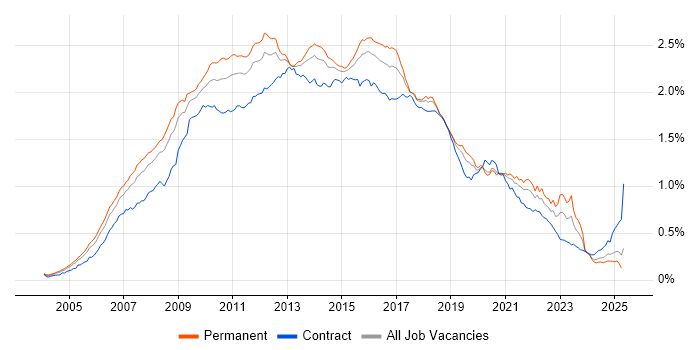
Job vacancy trend for SOA in England

SOA
Salary Trend in England

3-month moving average salary quoted in jobs citing SOA in England.

Salary trend for SOA in England

SOA
Salary Histogram in England

Salary distribution for jobs citing SOA in England over the 6 months to 11 May 2024.

Salary histogram for SOA in England

SOA
Job Locations in England

The table below looks at the demand and provides a guide to the median salaries quoted in IT jobs citing SOA within the England region over the 6 months to 11 May 2024. The 'Rank Change' column provides an indication of the change in demand within each location based on the same 6 month period last year.

Location Rank Change
on Same Period
Last Year
Matching
Permanent
IT Job Ads
Median Salary
Past 6 Months
Median Salary
% Change
on Same Period
Last Year
Live
Jobs
London -16 87 £83,750 +11.67% 28
North of England -41 49 £60,000 -17.24% 10
Yorkshire +67 25 £71,250 -9.81% 2
South East -105 20 £70,000 +21.74% 17
South West -65 19 £55,173 -21.18%
North West -64 15 £57,587 -17.73% 4
Midlands -36 14 £57,494 -1.86% 5
North East -4 9 £55,173 -26.44% 4
West Midlands -5 8 £55,173 -31.03% 3
East Midlands -31 6 £69,997 +27.27% 2
East of England -30 3 £55,173 -36.95%
SOA
UK

SOA
Co-occurring Skills and Capabilities in England by Category

The follow tables expand on the table above by listing co-occurrences grouped by category. The same employment type, locality and period is covered with up to 20 co-occurrences shown in each of the following categories:

Application Platforms
1 13 (6.74%) Oracle SOA Suite
2 11 (5.70%) Confluence
3 8 (4.15%) Anypoint
3 8 (4.15%) SharePoint
3 8 (4.15%) WebSphere
4 3 (1.55%) BizTalk Server
4 3 (1.55%) nginx
5 2 (1.04%) CMS
5 2 (1.04%) IIS
5 2 (1.04%) NServiceBus
6 1 (0.52%) Apache Pulsar
6 1 (0.52%) Drupal
6 1 (0.52%) Oracle Service Bus
6 1 (0.52%) Red Hat Fuse
6 1 (0.52%) WebLogic
Applications
1 4 (2.07%) Microsoft Excel
2 3 (1.55%) MS Visio
3 1 (0.52%) Spreadsheet
Business Applications
1 7 (3.63%) Maximo
1 7 (3.63%) SAP S/4HANA
2 5 (2.59%) SAP IBP
2 5 (2.59%) SAP PP
3 3 (1.55%) Teamcenter
4 1 (0.52%) Dynamics CRM
4 1 (0.52%) HFM
4 1 (0.52%) Oracle FAH
4 1 (0.52%) SAP ERP
4 1 (0.52%) SAP MDG
4 1 (0.52%) SAP MDG-BP
4 1 (0.52%) SAP MDG-F
Cloud Services
1 100 (51.81%) Azure
2 61 (31.61%) AWS
3 43 (22.28%) SaaS
4 31 (16.06%) PaaS
5 30 (15.54%) IaaS
6 25 (12.95%) Azure DevOps
7 16 (8.29%) Power Platform
8 14 (7.25%) Microsoft 365
9 13 (6.74%) Serverless
10 11 (5.70%) AWS Lambda
11 10 (5.18%) Cloud Computing
12 7 (3.63%) Pulumi
13 4 (2.07%) GCP
14 3 (1.55%) Azure API Management
14 3 (1.55%) Azure Service Bus
15 2 (1.04%) Amazon EKS
15 2 (1.04%) Azure Cosmos DB
15 2 (1.04%) Azure Monitor
15 2 (1.04%) Azure Sentinel
15 2 (1.04%) Cloudflare
Communications & Networking
1 14 (7.25%) Network Security
2 5 (2.59%) Internet
3 3 (1.55%) LAN
3 3 (1.55%) WLAN
4 2 (1.04%) Cisco Nexus
4 2 (1.04%) Firewall
4 2 (1.04%) MPLS
4 2 (1.04%) PBX
4 2 (1.04%) VoIP
4 2 (1.04%) VPN
4 2 (1.04%) WAN
5 1 (0.52%) DNS
5 1 (0.52%) IPsec
5 1 (0.52%) Kerberos
5 1 (0.52%) Reverse Proxy
5 1 (0.52%) SAN
5 1 (0.52%) SSL
5 1 (0.52%) Wi-Fi
Database & Business Intelligence
1 34 (17.62%) SQL Server
2 14 (7.25%) Relational Database
3 10 (5.18%) NoSQL
4 9 (4.66%) Data Warehouse
5 7 (3.63%) GIS
5 7 (3.63%) MongoDB
6 5 (2.59%) MySQL
7 4 (2.07%) RDBMS
8 3 (1.55%) DTS
8 3 (1.55%) SQL Server Integration Services
9 2 (1.04%) Metadata
9 2 (1.04%) Redis
10 1 (0.52%) Azure SQL Database
10 1 (0.52%) Big Data
10 1 (0.52%) Data Lake
10 1 (0.52%) OLTP
10 1 (0.52%) Oracle Database 12c
10 1 (0.52%) PostgreSQL
10 1 (0.52%) Power BI
10 1 (0.52%) SAP Data Services
Development Applications
1 18 (9.33%) Git
1 18 (9.33%) Team Foundation Server
2 16 (8.29%) Visual Studio
3 13 (6.74%) JIRA
4 12 (6.22%) Visual Studio Code
5 11 (5.70%) Jasmine
5 11 (5.70%) NUnit
5 11 (5.70%) Selenium
6 7 (3.63%) TeamCity
7 6 (3.11%) IntelliJ
8 4 (2.07%) Jenkins
8 4 (2.07%) Katalon Studio
8 4 (2.07%) Postman
9 1 (0.52%) Ant
9 1 (0.52%) Bitbucket
9 1 (0.52%) Eclipse
9 1 (0.52%) Maven
9 1 (0.52%) Mercurial
9 1 (0.52%) SonarQube
9 1 (0.52%) Visual Studio Team System
General
1 70 (36.27%) Finance
2 42 (21.76%) Social Skills
3 34 (17.62%) Analytical Skills
4 16 (8.29%) Retail
5 9 (4.66%) Legal
5 9 (4.66%) Marketing
6 8 (4.15%) Banking
7 7 (3.63%) Back Office
8 6 (3.11%) Manufacturing
9 4 (2.07%) Law
9 4 (2.07%) Multimedia
9 4 (2.07%) Pharmaceutical
9 4 (2.07%) Tech for Good
10 3 (1.55%) Presentation Skills
10 3 (1.55%) Telecoms
11 1 (0.52%) Influencing Skills
11 1 (0.52%) Public Sector
11 1 (0.52%) Retail Banking
Job Titles
1 75 (38.86%) Developer
2 70 (36.27%) Architect
3 47 (24.35%) Lead
4 42 (21.76%) Solutions Architect
5 30 (15.54%) Lead Developer
6 27 (13.99%) Senior
7 23 (11.92%) .NET Developer
8 17 (8.81%) Salesforce Architect
8 17 (8.81%) Salesforce Solution Architect
8 17 (8.81%) Software Developer
9 16 (8.29%) C# Developer
10 15 (7.77%) Software Engineer
11 14 (7.25%) C# .NET Developer
12 11 (5.70%) .NET Software Developer
12 11 (5.70%) C# Software Developer
12 11 (5.70%) Senior Developer
13 10 (5.18%) Enterprise Architect
13 10 (5.18%) Full Stack Developer
13 10 (5.18%) Principal Engineer
13 10 (5.18%) Principal Software Engineer
Libraries, Frameworks & Software Standards
1 78 (40.41%) .NET
2 47 (24.35%) REST
3 38 (19.69%) Web Services
4 31 (16.06%) OpenID
5 26 (13.47%) OAuth
6 24 (12.44%) Middleware
7 23 (11.92%) .NET Core
8 21 (10.88%) HTML
9 18 (9.33%) AngularJS
9 18 (9.33%) ASP.NET
10 16 (8.29%) .NET Framework
11 15 (7.77%) CSS
11 15 (7.77%) Node.js
11 15 (7.77%) RESTful
11 15 (7.77%) Spring Boot
12 13 (6.74%) React
12 13 (6.74%) Spring
13 11 (5.70%) Entity Framework
13 11 (5.70%) XML
14 10 (5.18%) SOAP
Miscellaneous
1 31 (16.06%) Management Information System
2 26 (13.47%) Enterprise Software
3 22 (11.40%) Public Cloud
4 13 (6.74%) Product Ownership
5 10 (5.18%) IoT
6 9 (4.66%) Distributed Systems
6 9 (4.66%) Greenfield Project
7 7 (3.63%) Data Structures
8 6 (3.11%) Virtual Team
9 5 (2.59%) Cloud Native
9 5 (2.59%) Data Centre
9 5 (2.59%) Enterprise Cloud
9 5 (2.59%) FMCG
9 5 (2.59%) Taxonomies
10 4 (2.07%) Distributed Architecture
10 4 (2.07%) Hybrid Cloud
10 4 (2.07%) NHS
11 3 (1.55%) Algorithms
11 3 (1.55%) Onboarding
11 3 (1.55%) PMI
Operating Systems
1 7 (3.63%) Windows
2 5 (2.59%) Linux
2 5 (2.59%) Windows 10
3 1 (0.52%) Solaris
3 1 (0.52%) Unix
Processes & Methodologies
1 84 (43.52%) Agile
2 60 (31.09%) Microservices
3 49 (25.39%) Enterprise Architecture
4 47 (24.35%) DevOps
4 47 (24.35%) Full Stack Development
5 40 (20.73%) TOGAF
6 39 (20.21%) SOLID
6 39 (20.21%) TDD
7 36 (18.65%) Roadmaps
8 34 (17.62%) Test Automation
9 33 (17.10%) MVC
9 33 (17.10%) Scrum
10 32 (16.58%) Integration Patterns
11 31 (16.06%) Mentoring
12 29 (15.03%) Business Strategy
12 29 (15.03%) Code Quality
12 29 (15.03%) Cybersecurity
13 28 (14.51%) Software Engineering
14 27 (13.99%) DevSecOps
15 24 (12.44%) Problem-Solving
Programming Languages
1 47 (24.35%) C#
2 32 (16.58%) JavaScript
3 28 (14.51%) Java
4 22 (11.40%) SQL
5 19 (9.84%) TypeScript
6 8 (4.15%) PowerShell
6 8 (4.15%) T-SQL
7 7 (3.63%) Bicep
8 5 (2.59%) Groovy
8 5 (2.59%) Python
9 3 (1.55%) Apex Code
9 3 (1.55%) C++
9 3 (1.55%) VB.NET
10 2 (1.04%) Bash
10 2 (1.04%) C
10 2 (1.04%) Kusto Query Language
10 2 (1.04%) PHP
10 2 (1.04%) Ruby
10 2 (1.04%) Shell Script
11 1 (0.52%) ABAP
Qualifications
1 35 (18.13%) Degree
2 18 (9.33%) TOGAF Certification
3 9 (4.66%) SC Cleared
3 9 (4.66%) Security Cleared
4 8 (4.15%) Computer Science Degree
5 7 (3.63%) BPSS Clearance
6 6 (3.11%) Microsoft Certification
7 4 (2.07%) CIPD
7 4 (2.07%) DBS Check
8 3 (1.55%) PMI Certification
8 3 (1.55%) Sun Certification
9 2 (1.04%) CCIE
9 2 (1.04%) CCIE Data Center
9 2 (1.04%) CCNP
9 2 (1.04%) Cisco Certification
9 2 (1.04%) ITIL Certification
9 2 (1.04%) MCAD
10 1 (0.52%) AWS Certification
10 1 (0.52%) Master's Degree
10 1 (0.52%) RHCSA
Quality Assurance & Compliance
1 7 (3.63%) QA
2 4 (2.07%) ISO/IEC 27001
3 2 (1.04%) ISO 9000
3 2 (1.04%) PCI DSS
3 2 (1.04%) SLA
4 1 (0.52%) IEC 61508
4 1 (0.52%) ISO 20022
System Software
1 16 (8.29%) Docker
2 6 (3.11%) VMware Infrastructure
3 4 (2.07%) VMware Server
4 3 (1.55%) Virtual Desktop
5 1 (0.52%) RACF
Systems Management
1 14 (7.25%) Kubernetes
2 9 (4.66%) Terraform
3 7 (3.63%) MIIS
4 4 (2.07%) Single Sign-On
5 1 (0.52%) Grafana
5 1 (0.52%) Hadoop YARN
5 1 (0.52%) Oracle Identity Management
5 1 (0.52%) Prometheus
Vendors
1 56 (29.02%) Microsoft
2 23 (11.92%) Salesforce
3 15 (7.77%) IBM
4 13 (6.74%) Oracle
5 8 (4.15%) MuleSoft
5 8 (4.15%) SAP
6 6 (3.11%) Google
6 6 (3.11%) VMware
7 5 (2.59%) ServiceNow
8 3 (1.55%) Progress
9 2 (1.04%) Cisco
10 1 (0.52%) DocuSign
10 1 (0.52%) Fortinet
10 1 (0.52%) Hyperion
10 1 (0.52%) Red Hat
10 1 (0.52%) Siemens
10 1 (0.52%) Sybase
10 1 (0.52%) Talend
10 1 (0.52%) webMethods
10 1 (0.52%) Yardi