Service-Oriented Architecture (SOA)
UK

The following table provides summary statistics for permanent job vacancies with a requirement for SOA skills. Included is a benchmarking guide to the salaries offered in vacancies that have cited SOA over the 6 months to 28 November 2023 with a comparison to the same period in the previous 2 years.

6 months to
28 Nov 2023
Same period 2022 Same period 2021
Rank 342 393 334
Rank change year-on-year +51 -59 -32
Permanent jobs citing SOA 462 1,045 1,394
As % of all permanent jobs advertised in the UK 0.85% 0.83% 1.09%
As % of the Processes & Methodologies category 0.90% 0.87% 1.14%
Number of salaries quoted 214 576 772
10th Percentile £47,350 £50,000 £45,000
25th Percentile £52,313 £62,500 £55,750
Median annual salary (50th Percentile) £71,000 £80,000 £72,500
Median % change year-on-year -11.25% +10.34% +11.54%
75th Percentile £85,000 £92,500 £88,750
90th Percentile £97,500 £110,000 £103,625
UK excluding London median annual salary £65,000 £65,000 £65,000
% change year-on-year - - +13.04%

All Process and Methodology Skills
UK

SOA is in the Processes and Methodologies category. The following table is for comparison with the above and provides summary statistics for all permanent job vacancies with a requirement for process or methodology skills.

Permanent vacancies with a requirement for process or methodology skills 51,121 120,104 122,523
As % of all permanent jobs advertised in the UK 94.09% 95.72% 95.43%
Number of salaries quoted 36,956 73,203 81,032
10th Percentile £32,500 £34,313 £32,500
25th Percentile £43,750 £45,000 £42,500
Median annual salary (50th Percentile) £60,000 £60,000 £59,000
Median % change year-on-year - +1.69% +7.27%
75th Percentile £80,000 £81,250 £77,500
90th Percentile £98,750 £100,000 £95,000
UK excluding London median annual salary £52,500 £53,000 £50,000
% change year-on-year -0.94% +6.00% +4.17%

SOA
Job Vacancy Trend

Job postings citing SOA as a proportion of all IT jobs advertised.
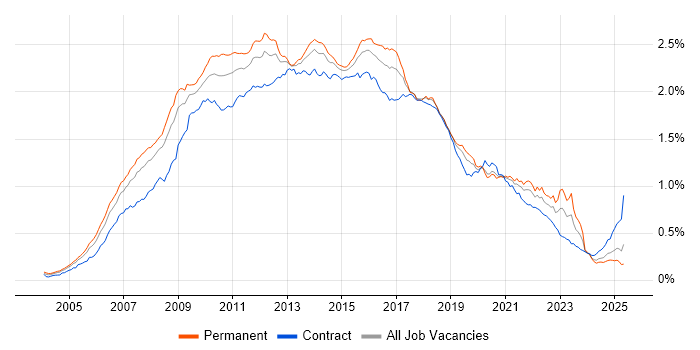
Job vacancy trend for SOA in the UK

SOA
Salary Trend

3-month moving average salary quoted in jobs citing SOA.

Salary trend for SOA in the UK

SOA
Salary Histogram

Salary distribution for jobs citing SOA over the 6 months to 28 November 2023.

Salary histogram for SOA in the UK

SOA
Top 17 Job Locations

The table below looks at the demand and provides a guide to the median salaries quoted in IT jobs citing SOA within the UK over the 6 months to 28 November 2023. The 'Rank Change' column provides an indication of the change in demand within each location based on the same 6 month period last year.

Location Rank Change
on Same Period
Last Year
Matching
Permanent
IT Job Ads
Median Salary
Past 6 Months
Median Salary
% Change
on Same Period
Last Year
Live
Jobs
England +53 406 £72,500 -9.38% 111
UK excluding London +101 333 £65,000 - 66
Work from Home +33 133 £67,500 -10.60% 71
North of England +101 122 £80,000 +23.08% 18
London +13 102 £76,250 -10.29% 58
Yorkshire +122 70 £80,000 +42.22% 7
Midlands +126 53 £53,500 -17.69% 4
South East +72 51 £85,000 +21.43% 23
South West +29 46 £45,000 -30.77% 8
North West +45 41 £60,000 -14.29% 9
East Midlands +43 37 £53,000 -15.20%
Scotland +39 29 £65,000 +10.90% 7
East of England +88 18 £107,500 +22.86% 6
West Midlands +124 16 £85,000 +25.93% 4
Wales +4 13 £49,053 -16.86% 3
North East +46 11 £88,750 - 2
Northern Ireland +39 5 - -

SOA
Co-occurring Skills and Capabilities by Category

The follow tables expand on the table above by listing co-occurrences grouped by category. The same employment type, locality and period is covered with up to 20 co-occurrences shown in each of the following categories:

Application Platforms
1 31 (6.71%) Oracle SOA Suite
2 24 (5.19%) JBoss
2 24 (5.19%) Red Hat Fuse
3 13 (2.81%) SharePoint
4 10 (2.16%) Confluence
4 10 (2.16%) WebLogic
5 9 (1.95%) CMS
6 6 (1.30%) Oracle Workflow
7 4 (0.87%) Apache
7 4 (0.87%) OpenStack
8 3 (0.65%) Headless CMS
9 2 (0.43%) Adobe Experience Manager
9 2 (0.43%) Appian
9 2 (0.43%) Drupal
10 1 (0.22%) IIS
10 1 (0.22%) NServiceBus
10 1 (0.22%) SAS
10 1 (0.22%) Tomcat
Applications
1 1 (0.22%) Microsoft Office
1 1 (0.22%) MS Visio
Business Applications
1 10 (2.16%) Maximo
2 7 (1.52%) Dynamics CRM
3 3 (0.65%) Salesforce CRM
3 3 (0.65%) Sparx Enterprise Architect
Cloud Services
1 132 (28.57%) Azure
2 66 (14.29%) Azure DevOps
3 56 (12.12%) SaaS
4 52 (11.26%) AWS
5 49 (10.61%) PaaS
6 40 (8.66%) IaaS
7 25 (5.41%) Power Platform
8 18 (3.90%) Serverless
9 17 (3.68%) GitHub
10 16 (3.46%) Microsoft 365
11 12 (2.60%) AWS CloudFormation
12 11 (2.38%) GCP
13 10 (2.16%) Amazon CloudWatch
13 10 (2.16%) Amazon ECS
13 10 (2.16%) Amazon EKS
13 10 (2.16%) AWS Step Functions
14 8 (1.73%) Azure API Management
14 8 (1.73%) Azure Service Bus
14 8 (1.73%) Boomi
14 8 (1.73%) Cloud Computing
Communications & Networking
1 9 (1.95%) HTTP
2 8 (1.73%) Internet
3 7 (1.52%) Network Security
4 4 (0.87%) 5G
4 4 (0.87%) DNS
4 4 (0.87%) Firewall
4 4 (0.87%) SD-WAN
4 4 (0.87%) SMTP
4 4 (0.87%) TCP/IP
4 4 (0.87%) WAN
5 3 (0.65%) AMQP
6 2 (0.43%) SSL
6 2 (0.43%) Unified Communications
7 1 (0.22%) IPsec
7 1 (0.22%) Kerberos
7 1 (0.22%) MQTT
7 1 (0.22%) VLAN
Database & Business Intelligence
1 69 (14.94%) SQL Server
2 25 (5.41%) Data Warehouse
3 20 (4.33%) NoSQL
4 17 (3.68%) Redis
5 16 (3.46%) Relational Database
6 11 (2.38%) MySQL
7 10 (2.16%) Amazon RDS
7 10 (2.16%) DynamoDB
7 10 (2.16%) GIS
7 10 (2.16%) Oracle ODI
7 10 (2.16%) Oracle Reports
8 6 (1.30%) Power BI
9 5 (1.08%) Data Lake
9 5 (1.08%) MongoDB
10 4 (0.87%) Apache Cassandra
10 4 (0.87%) PostgreSQL
11 2 (0.43%) SQL Server Integration Services
12 1 (0.22%) OLAP
12 1 (0.22%) OLTP
12 1 (0.22%) SQL Server Reporting Services
Development Applications
1 27 (5.84%) Git
1 27 (5.84%) Jenkins
2 23 (4.98%) IntelliJ
3 19 (4.11%) JIRA
3 19 (4.11%) Team Foundation Server
4 15 (3.25%) Visual Studio
5 10 (2.16%) GitLab
5 10 (2.16%) Oracle Forms
6 8 (1.73%) JetBrains Rider
7 5 (1.08%) Maven
8 4 (0.87%) Cucumber
8 4 (0.87%) ER Studio
8 4 (0.87%) ERwin
8 4 (0.87%) Subversion
9 3 (0.65%) JMeter
9 3 (0.65%) Locust
9 3 (0.65%) Postman
9 3 (0.65%) REST Assured
9 3 (0.65%) Selenium
9 3 (0.65%) Trac
General
1 250 (54.11%) Finance
2 48 (10.39%) Social Skills
3 31 (6.71%) Analytical Skills
4 27 (5.84%) Retail
5 25 (5.41%) Public Sector
6 21 (4.55%) Presentation Skills
7 20 (4.33%) Inclusion and Diversity
8 12 (2.60%) Publishing
9 11 (2.38%) Legal
10 10 (2.16%) Banking
11 8 (1.73%) Marketing
12 7 (1.52%) Law
13 4 (0.87%) Aerospace
13 4 (0.87%) Billing
13 4 (0.87%) Telecoms
14 3 (0.65%) Back Office
14 3 (0.65%) Financial Institution
14 3 (0.65%) Manufacturing
15 2 (0.43%) Influencing Skills
15 2 (0.43%) Organisational Skills
Job Titles
1 263 (56.93%) Architect
2 172 (37.23%) Enterprise Architect
3 113 (24.46%) Developer
4 65 (14.07%) Senior
5 51 (11.04%) Solutions Architect
6 40 (8.66%) Senior Developer
7 36 (7.79%) Full Stack Developer
8 25 (5.41%) .NET Developer
9 24 (5.19%) Java Developer
9 24 (5.19%) Software Engineer
10 23 (4.98%) Senior Java Developer
11 21 (4.55%) Lead
12 19 (4.11%) C# Developer
12 19 (4.11%) Technical Architect
13 13 (2.81%) Cloud Engineer
13 13 (2.81%) Full-Stack C# Developer
13 13 (2.81%) Senior Software Engineer
14 12 (2.60%) Data Architect
15 11 (2.38%) Platform Engineer
15 11 (2.38%) Senior .NET Developer
Libraries, Frameworks & Software Standards
1 117 (25.32%) .NET
2 102 (22.08%) REST
3 62 (13.42%) AngularJS
4 56 (12.12%) .NET Core
5 54 (11.69%) .NET Framework
5 54 (11.69%) CSS
6 53 (11.47%) HTML
7 49 (10.61%) JSON
7 49 (10.61%) Web Services
8 44 (9.52%) XML
9 35 (7.58%) React
9 35 (7.58%) SOAP
10 31 (6.71%) Spring
11 28 (6.06%) RESTful
12 27 (5.84%) Java EE
12 27 (5.84%) jQuery
12 27 (5.84%) Kafka
13 25 (5.41%) XSD
14 24 (5.19%) Hibernate
14 24 (5.19%) JPA
Miscellaneous
1 46 (9.96%) Product Ownership
2 39 (8.44%) Enterprise Software
3 21 (4.55%) Management Information System
4 16 (3.46%) Cloud Native
5 10 (2.16%) Public Cloud
6 7 (1.52%) Analytical Mindset
6 7 (1.52%) Distributed Systems
6 7 (1.52%) Self-Motivation
7 6 (1.30%) Distributed Architecture
7 6 (1.30%) Legacy Systems
8 5 (1.08%) Greenfield Project
8 5 (1.08%) Hybrid Cloud
8 5 (1.08%) Mainframe
9 4 (0.87%) GNSS
9 4 (0.87%) IoT
9 4 (0.87%) N-Tier
9 4 (0.87%) Operational Technology
9 4 (0.87%) Reinsurance
9 4 (0.87%) Tandem
9 4 (0.87%) Virtual Team
Operating Systems
1 31 (6.71%) Linux
2 17 (3.68%) Windows
3 10 (2.16%) Red Hat Enterprise Linux
4 8 (1.73%) Unix
5 2 (0.43%) Ubuntu
6 1 (0.22%) Windows 10
Processes & Methodologies
1 338 (73.16%) Agile
2 214 (46.32%) Enterprise Architecture
3 206 (44.59%) Roadmaps
4 165 (35.71%) Architectural Design
4 165 (35.71%) Data Integration
5 135 (29.22%) Microservices
6 100 (21.65%) DevOps
7 81 (17.53%) Software Engineering
8 75 (16.23%) CI/CD
9 57 (12.34%) Mentoring
10 56 (12.12%) TDD
11 50 (10.82%) Full Stack Development
12 49 (10.61%) TOGAF
13 40 (8.66%) Event-Driven
14 37 (8.01%) CRM
14 37 (8.01%) SDLC
14 37 (8.01%) User Stories
15 36 (7.79%) SOLID
16 35 (7.58%) Design Patterns
16 35 (7.58%) Problem-Solving
Programming Languages
1 100 (21.65%) C#
2 85 (18.40%) Java
3 82 (17.75%) SQL
4 75 (16.23%) JavaScript
5 38 (8.23%) TypeScript
6 33 (7.14%) Python
7 26 (5.63%) T-SQL
8 14 (3.03%) C++
8 14 (3.03%) PowerShell
9 13 (2.81%) Shell Script
10 7 (1.52%) C
11 6 (1.30%) Bash
11 6 (1.30%) Kusto Query Language
12 3 (0.65%) Perl
12 3 (0.65%) Scala
12 3 (0.65%) XPath
12 3 (0.65%) XQuery
Qualifications
1 54 (11.69%) Security Cleared
2 50 (10.82%) SC Cleared
3 45 (9.74%) Degree
4 16 (3.46%) Computer Science Degree
5 14 (3.03%) Master's Degree
6 10 (2.16%) BPSS Clearance
7 6 (1.30%) AWS Certification
7 6 (1.30%) AWS Certified Solutions Architect
8 5 (1.08%) MBA
8 5 (1.08%) PMI Certification
8 5 (1.08%) PMP
8 5 (1.08%) TOGAF Certification
9 4 (0.87%) Azure Certification
9 4 (0.87%) Microsoft Certification
10 2 (0.43%) ITIL Foundation Certificate
11 1 (0.22%) ISEB
11 1 (0.22%) ISTQB Foundation Certification
11 1 (0.22%) MCSA
11 1 (0.22%) MCSE
11 1 (0.22%) RHCSA
Quality Assurance & Compliance
1 12 (2.60%) Data Quality
2 10 (2.16%) QA
3 9 (1.95%) ISO/IEC 27001
4 6 (1.30%) ISO 9000
4 6 (1.30%) PCI DSS
5 5 (1.08%) Actionable Recommendations
6 4 (0.87%) SLA
7 2 (0.43%) Government Security Classifications
7 2 (0.43%) NCSC
8 1 (0.22%) HL7
System Software
1 24 (5.19%) Docker
2 1 (0.22%) Active Directory
2 1 (0.22%) RACF
2 1 (0.22%) Virtual Machines
Systems Management
1 24 (5.19%) Kubernetes
2 23 (4.98%) Terraform
3 13 (2.81%) Ansible
4 8 (1.73%) Single Sign-On
5 3 (0.65%) Grafana
6 2 (0.43%) Active Directory Federation Services
6 2 (0.43%) ZABBIX
7 1 (0.22%) Microsoft Intune
7 1 (0.22%) Progress Chef
7 1 (0.22%) Puppet
7 1 (0.22%) WSUS
Vendors
1 75 (16.23%) Microsoft
2 31 (6.71%) Oracle
3 15 (3.25%) Salesforce
4 14 (3.03%) MuleSoft
5 13 (2.81%) Red Hat
6 12 (2.60%) IBM
7 10 (2.16%) Hyperion
8 9 (1.95%) ServiceNow
9 8 (1.73%) Xamarin
10 7 (1.52%) Informatica
10 7 (1.52%) Splunk
11 6 (1.30%) Dynatrace
12 5 (1.08%) TIBCO
13 4 (0.87%) Google
13 4 (0.87%) Rackspace
14 3 (0.65%) New Relic
14 3 (0.65%) SnapLogic
14 3 (0.65%) Sparx
15 2 (0.43%) Adobe
15 2 (0.43%) Pega