Games Jobs in London

Gaming
England > London

The table below looks at the prevalence of the term Games in permanent job vacancies in London. Included is a benchmarking guide to the salaries offered in vacancies that cited Games over the 6 months leading up to 18 May 2025, comparing them to the same period in the previous two years.

6 months to
18 May 2025
Same period 2024 Same period 2023
Rank 137 224 88
Rank change year-on-year +87 -136 -11
Permanent jobs citing Games 321 323 1,220
As % of all permanent jobs advertised in London 2.48% 1.37% 3.63%
As % of the General category 3.24% 2.01% 5.28%
Number of salaries quoted 113 233 352
10th Percentile £26,150 £41,250 £45,000
25th Percentile £46,250 £45,750 £50,000
Median annual salary (50th Percentile) £62,500 £65,000 £68,500
Median % change year-on-year -3.85% -5.11% -2.14%
75th Percentile £82,500 £85,000 £96,250
90th Percentile £107,000 £103,750 £115,000
England median annual salary £32,500 £55,000 £62,500
% change year-on-year -40.91% -12.00% -10.71%

All General Skills
London

Games falls under the General Skills category. For comparison with the information above, the following table provides summary statistics for all permanent job vacancies requiring common skills in London.

Permanent vacancies with a requirement for common skills 9,897 16,060 23,100
As % of all permanent jobs advertised in London 76.47% 67.90% 68.71%
Number of salaries quoted 5,456 11,369 15,981
10th Percentile £41,250 £36,250 £42,000
25th Percentile £55,000 £50,000 £54,250
Median annual salary (50th Percentile) £75,000 £70,000 £73,750
Median % change year-on-year +7.14% -5.08% +5.36%
75th Percentile £102,500 £95,000 £95,000
90th Percentile £125,000 £118,750 £120,000
England median annual salary £57,000 £52,500 £60,000
% change year-on-year +8.57% -12.50% -

Games
Job Vacancy Trend in London

Job postings citing Games as a proportion of all IT jobs advertised in London.
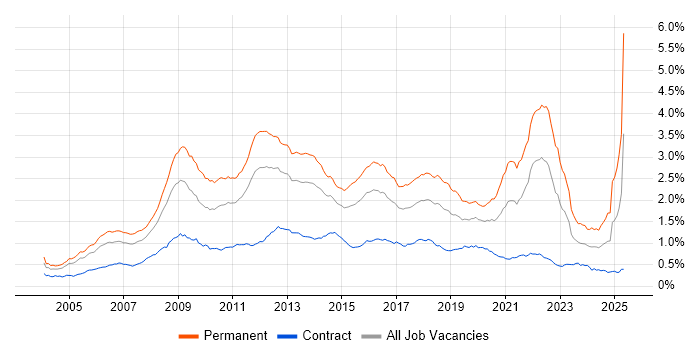
Job vacancy trend for Games in London

Games
Salary Trend in London

3-month moving average salary quoted in jobs citing Games in London.

Salary trend for Games in London

Games
Salary Histogram in London

Salary distribution for jobs citing Games in London over the 6 months to 18 May 2025.

Salary histogram for Games in London

Games
Job Locations in London

The table below looks at the demand and provides a guide to the median salaries quoted in IT jobs citing Games within the London region over the 6 months to 18 May 2025. The 'Rank Change' column provides an indication of the change in demand within each location based on the same 6 month period last year.

Location Rank Change
on Same Period
Last Year
Matching
Permanent
IT Job Ads
Median Salary
Past 6 Months
Median Salary
% Change
on Same Period
Last Year
Live
Jobs
Central London +58 97 £62,500 +25.00% 52
West London +40 27 £30,000 -61.29% 26
South London +18 20 - - 3
East London - 17 £45,000 - 11
North London - 8 £95,000 -
Games
England

Games
Co-occurring Skills and Capabilities in London by Category

The follow tables expand on the table above by listing co-occurrences grouped by category. The same employment type, locality and period is covered with up to 20 co-occurrences shown in each of the following categories:

Application Platforms
1 19 (5.92%) Apache Spark
2 2 (0.62%) Confluence
2 2 (0.62%) OpenStack
2 2 (0.62%) SharePoint
2 2 (0.62%) WordPress
3 1 (0.31%) Apache Airflow
3 1 (0.31%) Microsoft Exchange
3 1 (0.31%) nginx
Applications
1 39 (12.15%) Maya
2 7 (2.18%) Microsoft Excel
3 5 (1.56%) Adobe Creative Suite
3 5 (1.56%) Blender
3 5 (1.56%) Chatbot
3 5 (1.56%) CINEMA 4D
3 5 (1.56%) Microsoft Office
4 3 (0.93%) Trello
5 1 (0.31%) Microsoft PowerPoint
Business Applications
1 12 (3.74%) Dynamics AX
2 11 (3.43%) Dynamics CRM
2 11 (3.43%) SAP S/4HANA
3 10 (3.12%) SAP IBP
4 3 (0.93%) SAP CO
4 3 (0.93%) SAP CX
4 3 (0.93%) SAP FI
4 3 (0.93%) SAP FI/CO
4 3 (0.93%) SAP FSCM
4 3 (0.93%) SAP IS-U
5 2 (0.62%) Oracle General Ledger
5 2 (0.62%) Oracle Payables
5 2 (0.62%) Oracle Receivables
6 1 (0.31%) Lorenzo
6 1 (0.31%) Salesforce CRM
6 1 (0.31%) SAP ERP
6 1 (0.31%) SystmOne
Cloud Services
1 50 (15.58%) AWS
2 43 (13.40%) Azure
3 33 (10.28%) GCP
4 26 (8.10%) GitHub
5 19 (5.92%) Cloud Computing
6 16 (4.98%) Power Platform
7 12 (3.74%) GitHub Actions
8 11 (3.43%) Boomi
8 11 (3.43%) Microsoft 365
8 11 (3.43%) Salesforce Commerce Cloud
9 6 (1.87%) Amazon S3
9 6 (1.87%) AWS Lambda
9 6 (1.87%) SaaS
9 6 (1.87%) Serverless
10 5 (1.56%) Amazon CloudWatch
10 5 (1.56%) Amazon ECS
10 5 (1.56%) Anthos
11 4 (1.25%) Adobe Analytics
12 3 (0.93%) IaaS
12 3 (0.93%) PaaS
Communications & Networking
1 67 (20.87%) Broadband
2 20 (6.23%) HTTP
3 7 (2.18%) Internet
4 6 (1.87%) VPN
5 5 (1.56%) Firewall
6 4 (1.25%) Bluetooth
7 3 (0.93%) DNS
8 1 (0.31%) BGP
8 1 (0.31%) DHCP
8 1 (0.31%) OSPF
8 1 (0.31%) Software-Defined Networking
8 1 (0.31%) TCP/IP
8 1 (0.31%) Value-Added Service
8 1 (0.31%) WAN
8 1 (0.31%) Wireless
Database & Business Intelligence
1 18 (5.61%) Tableau
2 16 (4.98%) Power BI
3 13 (4.05%) MySQL
4 12 (3.74%) Data Lake
4 12 (3.74%) NoSQL
4 12 (3.74%) PostgreSQL
5 10 (3.12%) MongoDB
5 10 (3.12%) SAP BW
6 7 (2.18%) Data Warehouse
6 7 (2.18%) Relational Database
7 5 (1.56%) Amazon Athena
7 5 (1.56%) Redis
8 4 (1.25%) Power Query
8 4 (1.25%) PowerPivot
9 3 (0.93%) Electronic Patient Records
10 2 (0.62%) DynamoDB
11 1 (0.31%) Amazon Redshift
11 1 (0.31%) Big Data
11 1 (0.31%) Elasticsearch
11 1 (0.31%) SQL Server
Development Applications
1 25 (7.79%) Git
2 12 (3.74%) Gradle
3 11 (3.43%) Jenkins
4 7 (2.18%) SonarQube
5 6 (1.87%) Browser DevTools
5 6 (1.87%) Maven
6 3 (0.93%) CircleCI
7 2 (0.62%) Grunt
7 2 (0.62%) gulp
7 2 (0.62%) JIRA
7 2 (0.62%) Octopus Deploy
7 2 (0.62%) TeamCity
7 2 (0.62%) webpack
8 1 (0.31%) Android Studio
8 1 (0.31%) Bitbucket
8 1 (0.31%) GitLab
8 1 (0.31%) Postman
8 1 (0.31%) Selenium
8 1 (0.31%) TestRail
8 1 (0.31%) Xcode
General
1 111 (34.58%) Social Skills
2 109 (33.96%) Finance
3 75 (23.36%) Analytical Skills
4 69 (21.50%) Law
5 56 (17.45%) Retail
6 38 (11.84%) Marketing
7 27 (8.41%) Telecoms
8 26 (8.10%) Manufacturing
9 25 (7.79%) Inclusion and Diversity
10 23 (7.17%) Banking
11 21 (6.54%) Advertising
12 15 (4.67%) Presentation Skills
13 14 (4.36%) Dutch Language
13 14 (4.36%) French Language
14 13 (4.05%) Legal
15 12 (3.74%) iGaming
16 9 (2.80%) Publishing
17 7 (2.18%) Automotive
18 6 (1.87%) Billing
18 6 (1.87%) Investment Banking
Job Titles
1 165 (51.40%) Senior
2 41 (12.77%) Developer
3 35 (10.90%) Architect
3 35 (10.90%) Software Engineer
4 30 (9.35%) Senior Software Engineer
5 27 (8.41%) IT Architect
5 27 (8.41%) Senior Architect
6 22 (6.85%) Lead
7 20 (6.23%) Analyst
8 17 (5.30%) Android Developer
9 15 (4.67%) Artificial Intelligence Engineer
10 11 (3.43%) CRM Architect
10 11 (3.43%) Salesforce Architect
11 10 (3.12%) Consultant
11 10 (3.12%) IT Consultant
11 10 (3.12%) Lead Developer
11 10 (3.12%) Senior Developer
12 8 (2.49%) Data Scientist
12 8 (2.49%) iOS Developer
12 8 (2.49%) Senior Salesforce Architect
Libraries, Frameworks & Software Standards
1 74 (23.05%) GraphQL
1 74 (23.05%) Unity (Game Engine)
2 69 (21.50%) WebGL
3 35 (10.90%) Kafka
4 19 (5.92%) CSS
4 19 (5.92%) HTML
5 17 (5.30%) React
6 14 (4.36%) RESTful
7 12 (3.74%) WebSockets
8 10 (3.12%) RabbitMQ
9 8 (2.49%) Laravel
10 7 (2.18%) HTML5
10 7 (2.18%) Middleware
10 7 (2.18%) Node.js
10 7 (2.18%) REST
11 6 (1.87%) AngularJS
11 6 (1.87%) CSS3
11 6 (1.87%) Jest
11 6 (1.87%) Redux
11 6 (1.87%) Spring
Miscellaneous
1 67 (20.87%) Animation
2 49 (15.26%) Enterprise Software
3 43 (13.40%) Mobile Games
4 36 (11.21%) Mobile App
5 31 (9.66%) Algorithms
6 24 (7.48%) Cloud Native
7 23 (7.17%) Distributed Systems
8 22 (6.85%) Blockchain
9 17 (5.30%) Legacy Systems
10 16 (4.98%) IoT
10 16 (4.98%) Management Information System
11 13 (4.05%) Online Games
12 12 (3.74%) Analytical Mindset
12 12 (3.74%) Robotics
13 11 (3.43%) Sports Betting
14 10 (3.12%) Educational Technology
15 8 (2.49%) PMI
16 7 (2.18%) Reinsurance
17 6 (1.87%) Data Centre
17 6 (1.87%) Public Cloud
Operating Systems
1 22 (6.85%) Android
1 22 (6.85%) Apple iOS
1 22 (6.85%) Linux
2 11 (3.43%) Windows
3 5 (1.56%) Mac OS X
4 4 (1.25%) Ubuntu
4 4 (1.25%) Windows Server
5 3 (0.93%) Windows Server 2016
6 2 (0.62%) Windows 10
7 1 (0.31%) Windows Server 2019
Processes & Methodologies
1 163 (50.78%) Problem-Solving
2 128 (39.88%) Artificial Intelligence
3 108 (33.64%) Analytics
4 80 (24.92%) Prototyping
5 77 (23.99%) Rapid Prototyping
6 74 (23.05%) Agile
7 73 (22.74%) Software Engineering
8 71 (22.12%) Storytelling
9 70 (21.81%) Business Strategy
10 67 (20.87%) 3D Animation
10 67 (20.87%) Visual Effects
11 50 (15.58%) Cybersecurity
12 48 (14.95%) DevOps
13 47 (14.64%) Data Analytics
14 46 (14.33%) Computer Science
15 45 (14.02%) Project Management
16 44 (13.71%) Machine Learning
17 43 (13.40%) ERP
17 43 (13.40%) Mentoring
18 40 (12.46%) Mathematics
Programming Languages
1 75 (23.36%) Python
2 67 (20.87%) HLSL
3 48 (14.95%) SQL
4 31 (9.66%) Java
5 27 (8.41%) JavaScript
6 20 (6.23%) Scala
7 19 (5.92%) Swift
8 18 (5.61%) Kotlin
8 18 (5.61%) Objective-C
9 12 (3.74%) C#
9 12 (3.74%) PHP
9 12 (3.74%) TypeScript
10 6 (1.87%) C
10 6 (1.87%) C++
11 5 (1.56%) R
12 4 (1.25%) Ladder Logic
13 3 (0.93%) PowerShell
13 3 (0.93%) Ruby
14 2 (0.62%) Go
15 1 (0.31%) Bash
Qualifications
1 115 (35.83%) Degree
2 22 (6.85%) Computer Science Degree
3 16 (4.98%) Master's Degree
3 16 (4.98%) PhD
4 12 (3.74%) CISA
4 12 (3.74%) ISACA
5 9 (2.80%) PMI Certification
6 6 (1.87%) ACCA
6 6 (1.87%) CIMA
6 6 (1.87%) Numerate Degree
6 6 (1.87%) Six Sigma Black Belt
7 5 (1.56%) AWS Certification
7 5 (1.56%) AWS Certified Solutions Architect
8 3 (0.93%) DBS Check
9 2 (0.62%) CCSAS
9 2 (0.62%) CREST Certified
10 1 (0.31%) APMG
10 1 (0.31%) PMP
10 1 (0.31%) SC Cleared
10 1 (0.31%) Security Cleared
Quality Assurance & Compliance
1 29 (9.03%) QA
2 12 (3.74%) ITGC
3 5 (1.56%) NCSC
3 5 (1.56%) SLA
4 2 (0.62%) ISO/IEC 17025
5 1 (0.31%) Accessibility
5 1 (0.31%) Data Quality
5 1 (0.31%) DICOM
5 1 (0.31%) GDPR
5 1 (0.31%) HL7
5 1 (0.31%) ISO/IEC 27001
5 1 (0.31%) PMO
5 1 (0.31%) SNOMED CT
System Software
1 14 (4.36%) Docker
2 9 (2.80%) Active Directory
3 3 (0.93%) VMware Infrastructure
4 1 (0.31%) VMware ESXi
4 1 (0.31%) vSphere
Systems Management
1 16 (4.98%) Kubernetes
2 10 (3.12%) Argo
3 8 (2.49%) Microsoft Intune
3 8 (2.49%) Prometheus
4 6 (1.87%) Terraform
5 5 (1.56%) Jamf Pro
6 4 (1.25%) Grafana
6 4 (1.25%) Istio
6 4 (1.25%) Progress Chef
6 4 (1.25%) Puppet
6 4 (1.25%) SCCM
7 3 (0.93%) Ansible
7 3 (0.93%) Consul
8 2 (0.62%) Kustomize
9 1 (0.31%) Kibana
9 1 (0.31%) RSA Archer
9 1 (0.31%) vCenter Server
Vendors
1 48 (14.95%) SAP
2 47 (14.64%) Microsoft
3 38 (11.84%) Google
4 25 (7.79%) Oracle
5 24 (7.48%) Adobe
6 22 (6.85%) Apple
7 15 (4.67%) New Relic
8 12 (3.74%) Salesforce
9 11 (3.43%) Dell
9 11 (3.43%) MuleSoft
10 7 (2.18%) Ariba
11 5 (1.56%) TikTok
12 4 (1.25%) Palo Alto
12 4 (1.25%) ServiceNow
12 4 (1.25%) Siemens
13 3 (0.93%) Cisco
13 3 (0.93%) Facebook
13 3 (0.93%) Twitter
13 3 (0.93%) VMware
13 3 (0.93%) Zoho