SAP Jobs in the UK excluding London

SAP
UK > UK excluding London

The table below provides summary statistics for permanent job vacancies advertised in the UK excluding London requiring knowledge or experience of SAP products and/or services. It includes a benchmarking guide to the annual salaries offered in vacancies that cited SAP over the 6 months leading up to 14 May 2025, comparing them to the same period in the previous two years.

The figures below represent the IT labour market in general and are not representative of salaries within SAP SE.

6 months to
14 May 2025
Same period 2024 Same period 2023
Rank 133 153 144
Rank change year-on-year +20 -9 +25
Permanent jobs citing SAP 922 1,350 1,466
As % of all permanent jobs advertised in the UK excluding London 2.36% 1.91% 2.44%
As % of the Vendors category 6.62% 5.41% 5.73%
Number of salaries quoted 510 824 901
10th Percentile £28,822 £28,119 £37,500
25th Percentile £36,250 £34,750 £47,500
Median annual salary (50th Percentile) £54,000 £52,500 £57,500
Median % change year-on-year +2.86% -8.70% +15.00%
75th Percentile £65,750 £68,750 £70,000
90th Percentile £82,500 £82,548 £82,500
UK median annual salary £60,000 £60,000 £61,500
% change year-on-year - -2.44% +5.13%

All Vendors
UK excluding London

SAP falls under the Vendor Products and Services category. For comparison with the information above, the following table provides summary statistics for all permanent job vacancies requiring knowledge or experience of all vendor products and services in the UK excluding London.

Permanent vacancies with a requirement for knowledge or experience of vendor products and services 13,926 24,964 25,568
As % of all permanent jobs advertised in the UK excluding London 35.72% 35.24% 42.54%
Number of salaries quoted 8,069 17,229 13,183
10th Percentile £25,087 £25,750 £27,500
25th Percentile £32,500 £32,000 £36,250
Median annual salary (50th Percentile) £50,000 £45,000 £50,000
Median % change year-on-year +11.11% -10.00% +5.26%
75th Percentile £63,750 £61,250 £65,000
90th Percentile £75,000 £73,750 £77,500
UK median annual salary £55,000 £50,000 £57,500
% change year-on-year +10.00% -13.04% +4.55%

SAP
Job Vacancy Trend in the UK excluding London

Job postings citing SAP as a proportion of all IT jobs advertised in the UK excluding London.
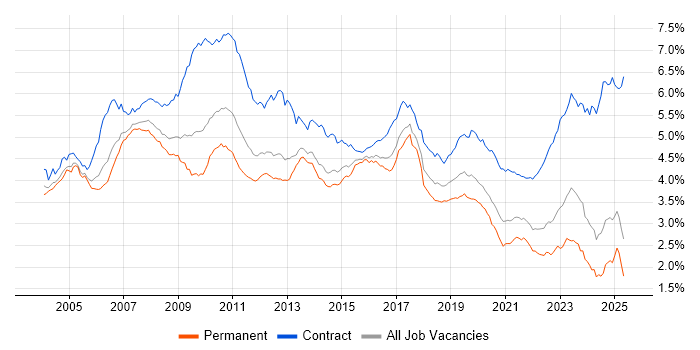
Job vacancy trend for SAP in the UK excluding London

SAP
Salary Trend in the UK excluding London

3-month moving average salary quoted in jobs citing SAP in the UK excluding London.

Salary trend for SAP in the UK excluding London

SAP
Salary Histogram in the UK excluding London

Salary distribution for jobs citing SAP in the UK excluding London over the 6 months to 14 May 2025.

Salary histogram for SAP in the UK excluding London

SAP
Job Locations in the UK excluding London

The table below looks at the demand and provides a guide to the median salaries quoted in IT jobs citing SAP within the UK excluding London region over the 6 months to 14 May 2025. The 'Rank Change' column provides an indication of the change in demand within each location based on the same 6 month period last year.

Location Rank Change
on Same Period
Last Year
Matching
Permanent
IT Job Ads
Median Salary
Past 6 Months
Median Salary
% Change
on Same Period
Last Year
Live
Jobs
North of England +7 315 £50,818 +1.64% 230
North West +10 278 £50,818 -5.45% 142
Midlands +58 249 £38,250 -15.00% 211
South East -3 242 £55,000 -2.65% 353
West Midlands +67 211 £33,000 -38.60% 125
Scotland +86 37 £60,000 +1.69% 51
East Midlands -1 36 £45,000 +5.88% 74
South West +79 35 £60,000 +12.15% 88
Yorkshire -7 33 £60,000 +20.42% 70
East of England -28 27 £70,000 +7.69% 141
Wales +29 11 £62,500 +66.67% 23
Northern Ireland +11 8 £31,250 -10.71% 16
North East +11 4 £45,000 -7.69% 24
SAP
UK

SAP
Co-occurring Skills and Capabilities in the UK excluding London by Category

The follow tables expand on the table above by listing co-occurrences grouped by category. The same employment type, locality and period is covered with up to 20 co-occurrences shown in each of the following categories:

Application Platforms
1 63 (6.83%) SharePoint
2 62 (6.72%) Confluence
3 6 (0.65%) NetWeaver
4 4 (0.43%) SAP Portal
5 3 (0.33%) Tomcat
6 2 (0.22%) Apache
6 2 (0.22%) Microsoft Exchange
6 2 (0.22%) Skype for Business
7 1 (0.11%) Apache Spark
7 1 (0.11%) OpenStack
7 1 (0.11%) SharePoint Server
7 1 (0.11%) WordPress
Applications
1 100 (10.85%) Microsoft Office
2 79 (8.57%) Microsoft Excel
3 20 (2.17%) Microsoft PowerPoint
4 8 (0.87%) Microsoft Project
5 3 (0.33%) AutoCAD
5 3 (0.33%) MS Visio
6 2 (0.22%) Autodesk Inventor
7 1 (0.11%) SOLIDWORKS
Business Applications
1 152 (16.49%) SAP S/4HANA
2 84 (9.11%) Salesforce CRM
3 42 (4.56%) Infor LN
3 42 (4.56%) SAP BPC
4 32 (3.47%) SAP ERP
5 29 (3.15%) Dynamics AX
6 24 (2.60%) SAP FI
7 20 (2.17%) SAP HR
8 19 (2.06%) SAP HCM
9 18 (1.95%) SAP Payroll
10 16 (1.74%) OpenText VIM for SAP
11 11 (1.19%) SAP Business One
12 10 (1.08%) TrackWise
13 9 (0.98%) Primavera
14 8 (0.87%) Dynamics NAV
15 7 (0.76%) Infor M3
15 7 (0.76%) SAP CO
15 7 (0.76%) SAP GRC
15 7 (0.76%) SAP SD
16 6 (0.65%) SAP FI/CO
Cloud Services
1 66 (7.16%) Power Platform
2 61 (6.62%) Azure
3 30 (3.25%) Microsoft 365
4 25 (2.71%) AWS
5 23 (2.49%) SuccessFactors
6 16 (1.74%) Boomi
7 11 (1.19%) Dynamics 365
7 11 (1.19%) Veeva
8 6 (0.65%) Azure DevOps
8 6 (0.65%) SaaS
9 5 (0.54%) Salesforce Commerce Cloud
9 5 (0.54%) SAP Commerce Cloud
10 4 (0.43%) Amazon EC2
10 4 (0.43%) Amazon S3
10 4 (0.43%) OCI
11 3 (0.33%) AWS Lambda
11 3 (0.33%) GCP
11 3 (0.33%) GitHub
11 3 (0.33%) IaaS
11 3 (0.33%) PaaS
Communications & Networking
1 14 (1.52%) Firewall
2 13 (1.41%) DHCP
3 9 (0.98%) DNS
3 9 (0.98%) TCP/IP
3 9 (0.98%) VPN
4 6 (0.65%) LAN
4 6 (0.65%) WAN
5 5 (0.54%) Ethernet
6 4 (0.43%) Modbus
6 4 (0.43%) Network Security
7 3 (0.33%) Cisco IOS
7 3 (0.33%) HTTP
7 3 (0.33%) LTE
7 3 (0.33%) VLAN
7 3 (0.33%) Wi-Fi
7 3 (0.33%) Wireless
8 2 (0.22%) 3G
8 2 (0.22%) FTP
8 2 (0.22%) HTTPS
8 2 (0.22%) SSL
Database & Business Intelligence
1 66 (7.16%) Power BI
2 51 (5.53%) Tableau
3 27 (2.93%) SAP HANA
4 24 (2.60%) SQL Server
5 21 (2.28%) BusinessObjects
6 16 (1.74%) Data Lake
7 13 (1.41%) Data Warehouse
8 12 (1.30%) SAP BW
9 10 (1.08%) Oracle Reports
10 9 (0.98%) MySQL
11 8 (0.87%) SQL Server Integration Services
11 8 (0.87%) SQL Server Reporting Services
12 7 (0.76%) Amazon Redshift
12 7 (0.76%) Data Mining
13 6 (0.65%) Power Query
14 5 (0.54%) SAP Data Services
15 4 (0.43%) Amazon QuickSight
15 4 (0.43%) DB2
15 4 (0.43%) MaxDB
15 4 (0.43%) NoSQL
Development Applications
1 71 (7.70%) JIRA
2 41 (4.45%) Oracle Forms
3 4 (0.43%) Git
3 4 (0.43%) LSMW
4 3 (0.33%) SQL Server Management Studio (SSMS)
5 2 (0.22%) Jenkins
5 2 (0.22%) Subversion
6 1 (0.11%) CMake
6 1 (0.11%) GitLab
6 1 (0.11%) WiX
General
1 356 (38.61%) Finance
2 265 (28.74%) Social Skills
3 244 (26.46%) Manufacturing
4 161 (17.46%) Analytical Skills
5 111 (12.04%) Law
6 71 (7.70%) Telecoms
7 51 (5.53%) Retail
8 48 (5.21%) Public Sector
9 44 (4.77%) Marketing
10 41 (4.45%) Electronics
10 41 (4.45%) Inclusion and Diversity
11 38 (4.12%) Police
12 31 (3.36%) Pharmaceutical
13 26 (2.82%) Organisational Skills
14 24 (2.60%) Games
15 20 (2.17%) Aerospace
16 13 (1.41%) Documentation Skills
17 10 (1.08%) General Ledger
18 9 (0.98%) Presentation Skills
19 7 (0.76%) Banking
Job Titles
1 204 (22.13%) Lead
2 180 (19.52%) Analyst
3 117 (12.69%) Senior
4 92 (9.98%) Architect
5 84 (9.11%) Business Manager
6 78 (8.46%) Business Development Manager
6 78 (8.46%) Development Manager
7 72 (7.81%) Solutions Architect
8 59 (6.40%) Lead Architect
9 58 (6.29%) Lead Solutions Architect
10 54 (5.86%) Project Manager
11 46 (4.99%) Financial Analyst
12 45 (4.88%) Administrator
12 45 (4.88%) Consultant
13 42 (4.56%) Accountant
14 41 (4.45%) Data Analyst
14 41 (4.45%) Developer
14 41 (4.45%) Team Leader
15 39 (4.23%) Support Analyst
16 38 (4.12%) Project Accountant
Libraries, Frameworks & Software Standards
1 39 (4.23%) SAP Fiori
2 22 (2.39%) EDI
3 18 (1.95%) SAPUI5
4 13 (1.41%) Middleware
5 10 (1.08%) SAP Basis
6 7 (0.76%) BAPI
6 7 (0.76%) Web Services
7 4 (0.43%) CSS
7 4 (0.43%) IBM Integration Bus
7 4 (0.43%) Node.js
7 4 (0.43%) REST
7 4 (0.43%) RESTful
7 4 (0.43%) SOAP
7 4 (0.43%) Spring
7 4 (0.43%) Spring Boot
8 3 (0.33%) Bootstrap
8 3 (0.33%) IDoc
8 3 (0.33%) Laravel
8 3 (0.33%) OAuth
8 3 (0.33%) Tailwind CSS
Miscellaneous
1 130 (14.10%) Management Information System
2 27 (2.93%) Product Ownership
3 25 (2.71%) Driving Licence
4 23 (2.49%) Onboarding
4 23 (2.49%) Robotics
5 22 (2.39%) Blockchain
6 14 (1.52%) Algorithms
7 13 (1.41%) IoT
8 12 (1.30%) Self-Motivation
9 11 (1.19%) Enterprise Software
10 10 (1.08%) FMCG
11 7 (0.76%) Legacy Systems
11 7 (0.76%) Renewable Energy
12 6 (0.65%) Cloud Native
13 5 (0.54%) Embedded Systems
13 5 (0.54%) Operational Technology
13 5 (0.54%) PMI
14 4 (0.43%) Pricing Data
14 4 (0.43%) Replication
14 4 (0.43%) Virtual Team
Operating Systems
1 39 (4.23%) Windows
2 24 (2.60%) Linux
3 23 (2.49%) Windows Server
4 10 (1.08%) Unix
5 9 (0.98%) AIX
6 8 (0.87%) Windows 10
7 7 (0.76%) Apple iOS
8 6 (0.65%) Mac OS
9 5 (0.54%) SUSE
9 5 (0.54%) SUSE Linux Enterprise Server
10 3 (0.33%) Mac OS X
10 3 (0.33%) Red Hat Enterprise Linux
10 3 (0.33%) Windows Server 2016
10 3 (0.33%) Windows Server 2019
11 2 (0.22%) CentOS
11 2 (0.22%) Oracle Linux
12 1 (0.11%) Android
12 1 (0.11%) Robot Operating System
Processes & Methodologies
1 372 (40.35%) ERP
2 183 (19.85%) Problem-Solving
3 173 (18.76%) Business Intelligence
4 171 (18.55%) Agile
5 150 (16.27%) Project Management
6 129 (13.99%) Analytics
7 122 (13.23%) Process Improvement
8 120 (13.02%) Decision-Making
9 102 (11.06%) CRM
10 94 (10.20%) Business Development
10 94 (10.20%) Stakeholder Management
11 91 (9.87%) Continuous Improvement
12 89 (9.65%) Roadmaps
13 84 (9.11%) Collaborative Working
14 80 (8.68%) Change Management
15 79 (8.57%) Data Analysis
15 79 (8.57%) PLM
15 79 (8.57%) Project Delivery
15 79 (8.57%) Value Proposition
16 78 (8.46%) Deadline-Driven
Programming Languages
1 52 (5.64%) ABAP
2 48 (5.21%) SQL
3 39 (4.23%) Python
4 27 (2.93%) Java
5 10 (1.08%) C
5 10 (1.08%) C++
5 10 (1.08%) PowerShell
6 7 (0.76%) Bash
6 7 (0.76%) PHP
7 5 (0.54%) Data Analysis Expressions
8 4 (0.43%) C#
9 2 (0.22%) AWK
9 2 (0.22%) Korn
9 2 (0.22%) Perl
9 2 (0.22%) SAPscript
9 2 (0.22%) T-SQL
9 2 (0.22%) TypeScript
10 1 (0.11%) Embedded C
10 1 (0.11%) R
10 1 (0.11%) Shell Script
Qualifications
1 222 (24.08%) BPSS Clearance
2 157 (17.03%) Degree
3 84 (9.11%) ACCA
4 82 (8.89%) CIMA
5 74 (8.03%) Security Cleared
6 27 (2.93%) SC Cleared
7 26 (2.82%) PMI Certification
8 23 (2.49%) PMP
9 22 (2.39%) CISA
9 22 (2.39%) ISACA
10 17 (1.84%) HNC
11 16 (1.74%) CCAB
12 15 (1.63%) Master's Degree
13 12 (1.30%) Computer Science Degree
14 11 (1.19%) SAP Certification
15 8 (0.87%) DBS Check
15 8 (0.87%) DV Cleared
15 8 (0.87%) ITIL Certification
16 7 (0.76%) Microsoft Certification
17 6 (0.65%) MCSE
Quality Assurance & Compliance
1 88 (9.54%) SLA
2 80 (8.68%) Data Quality
3 43 (4.66%) IFRS
4 38 (4.12%) GAAP
5 31 (3.36%) QA
6 23 (2.49%) ITGC
7 20 (2.17%) GMP
8 13 (1.41%) GDPR
9 8 (0.87%) Accessibility
9 8 (0.87%) Sarbanes-Oxley
10 7 (0.76%) GLP
10 7 (0.76%) GxP
11 5 (0.54%) GRC
11 5 (0.54%) PMO
12 3 (0.33%) NEBOSH
13 2 (0.22%) ISO/IEC 27001
14 1 (0.11%) COSHH
14 1 (0.11%) ISO 13485
14 1 (0.11%) ISO 9001
14 1 (0.11%) JTAG
System Software
1 23 (2.49%) Active Directory
2 9 (0.98%) VMware Infrastructure
3 7 (0.76%) Docker
4 5 (0.54%) NFS
5 3 (0.33%) Embedded Firmware
5 3 (0.33%) Firmware
6 2 (0.22%) KVM
6 2 (0.22%) Postfix
6 2 (0.22%) Sendmail
7 1 (0.11%) IAG
7 1 (0.11%) Virtual Servers
7 1 (0.11%) vSphere
Systems Management
1 9 (0.98%) Kubernetes
2 5 (0.54%) SCCM
2 5 (0.54%) Terraform
3 3 (0.33%) Ansible
3 3 (0.33%) Tivoli Storage Manager
4 2 (0.22%) Grafana
4 2 (0.22%) Nagios
4 2 (0.22%) Nessus
4 2 (0.22%) Single Sign-On
5 1 (0.11%) Backup Exec
5 1 (0.11%) Failover Clustering
5 1 (0.11%) Microsoft Intune
5 1 (0.11%) Systems Management Server (SMS)
Vendors
1 182 (19.74%) Microsoft
2 110 (11.93%) Salesforce
3 105 (11.39%) Oracle
4 59 (6.40%) Siemens
5 48 (5.21%) Infor
6 43 (4.66%) Cognos
7 36 (3.90%) IBM
8 31 (3.36%) Workday
9 25 (2.71%) Concur
10 21 (2.28%) Google
11 16 (1.74%) Sage
12 15 (1.63%) VMware
13 13 (1.41%) Dell
14 10 (1.08%) Ariba
15 8 (0.87%) ServiceNow
16 7 (0.76%) Fortinet
16 7 (0.76%) JD Edwards
17 6 (0.65%) Apple
17 6 (0.65%) Hyperion
17 6 (0.65%) Veeam