Business Development Manager
UK
The median Business Development Manager salary in the UK is £38,000 per year, according to job vacancies posted during the 6 months leading to 31 May 2025.
The table below provides salary benchmarking and summary statistics, comparing them to the same period in the previous two years.
| 6 months to 31 May 2025 |
Same period 2024 | Same period 2023 | |
|---|---|---|---|
| Rank | 195 | 286 | 669 |
| Rank change year-on-year | +91 | +383 | +479 |
| Permanent jobs requiring a Business Development Manager | 897 | 998 | 311 |
| As % of all permanent jobs advertised in the UK | 1.61% | 0.96% | 0.32% |
| As % of the Job Titles category | 1.78% | 1.02% | 0.36% |
| Number of salaries quoted | 277 | 767 | 52 |
| 10th Percentile | £28,822 | £32,500 | - |
| 25th Percentile | £31,250 | £38,000 | £36,250 |
| Median annual salary (50th Percentile) | £38,000 | £40,000 | £50,000 |
| Median % change year-on-year | -5.00% | -20.00% | -14.89% |
| 75th Percentile | £43,750 | £57,500 | £60,000 |
| 90th Percentile | £67,500 | £77,500 | £84,250 |
| UK excluding London median annual salary | £38,000 | £40,000 | £42,500 |
| % change year-on-year | -5.00% | -5.88% | -1.73% |
All Permanent IT Job Vacancies
UK
For comparison with the information above, the following table provides summary statistics for all permanent IT job vacancies. Most job vacancies include a discernible job title that can be normalized. As such, the figures in the second row provide an indication of the number of permanent jobs in our overall sample.
| Permanent vacancies in the UK with a recognized job title | 50,444 | 98,297 | 87,491 |
| % of permanent jobs with a recognized job title | 90.33% | 94.81% | 91.34% |
| Number of salaries quoted | 26,384 | 69,991 | 55,965 |
| 10th Percentile | £28,750 | £28,500 | £32,500 |
| 25th Percentile | £40,748 | £38,500 | £45,000 |
| Median annual salary (50th Percentile) | £55,000 | £52,500 | £60,000 |
| Median % change year-on-year | +4.76% | -12.50% | - |
| 75th Percentile | £73,750 | £70,000 | £80,000 |
| 90th Percentile | £95,000 | £90,000 | £100,000 |
| UK excluding London median annual salary | £51,000 | £50,000 | £53,500 |
| % change year-on-year | +2.00% | -6.54% | +6.49% |
Business Development Manager
Job Vacancy Trend
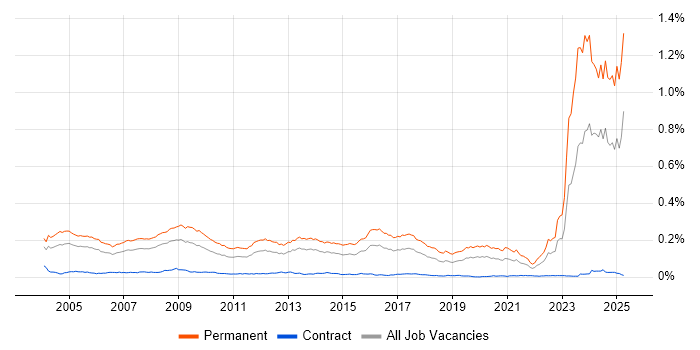
Job postings that featured Business Development Manager in the job title as a proportion of all IT jobs advertised.

Business Development Manager
Salary Trend
3-month moving average salary quoted in jobs citing Business Development Manager.
Business Development Manager
Salary Histogram
Salary distribution for jobs citing Business Development Manager over the 6 months to 31 May 2025.
Business Development Manager
Top 17 Job Locations
The table below looks at the demand and provides a guide to the median salaries quoted in IT jobs citing Business Development Manager within the UK over the 6 months to 31 May 2025. The 'Rank Change' column provides an indication of the change in demand within each location based on the same 6 month period last year.
| Location | Rank Change on Same Period Last Year |
Matching Permanent IT Job Ads |
Median Salary Past 6 Months |
Median Salary % Change on Same Period Last Year |
Live Jobs |
|---|---|---|---|---|---|
| England | +84 | 770 | £38,000 | -5.00% | 1,056 |
| UK excluding London | +85 | 601 | £38,000 | -5.00% | 706 |
| Work from Home | +68 | 468 | £38,000 | -5.00% | 403 |
| London | +47 | 183 | £42,000 | +5.00% | 420 |
| South East | +37 | 167 | £42,000 | +5.00% | 138 |
| East of England | +134 | 163 | £41,000 | -8.89% | 94 |
| Midlands | +8 | 97 | £29,701 | -22.85% | 158 |
| West Midlands | +17 | 87 | £28,822 | -23.14% | 94 |
| North of England | -23 | 74 | £37,500 | -25.00% | 196 |
| South West | +148 | 66 | £38,000 | -15.56% | 45 |
| North West | -39 | 42 | £35,000 | -36.36% | 97 |
| Scotland | +67 | 20 | £38,000 | -52.50% | 40 |
| Yorkshire | +29 | 18 | £55,000 | +22.22% | 75 |
| North East | +55 | 12 | £35,000 | -12.50% | 27 |
| East Midlands | +28 | 10 | £50,750 | -7.73% | 64 |
| Wales | +12 | 9 | £75,000 | +110.08% | 22 |
| Northern Ireland | +35 | 5 | £40,000 | -33.33% | 8 |
Business Development Manager Skill Set
Top 30 Co-occurring Skills and Capabilities
For the 6 months to 31 May 2025, Business Development Manager job roles required the following skills and capabilities in order of popularity. The figures indicate the absolute number co-occurrences and as a proportion of all permanent job ads featuring Business Development Manager in the job title.
|
|
Business Development Manager Skill Set
Co-occurring Skills and Capabilities by Category
The follow tables expand on the table above by listing co-occurrences grouped by category. The same employment type, locality and period is covered with up to 20 co-occurrences shown in each of the following categories:
|
|
||||||||||||||||||||||||||||||||||||||||||||||||||||||||||||||||||||||||
|
|
||||||||||||||||||||||||||||||||||||||||||||||||||||||||||||||||||||||||
|
|
||||||||||||||||||||||||||||||||||||||||||||||||||||||||||||||||||||||||
|
|
||||||||||||||||||||||||||||||||||||||||||||||||||||||||||||||||||||||||
|
|
||||||||||||||||||||||||||||||||||||||||||||||||||||||||||||||||||||||||
|
|
||||||||||||||||||||||||||||||||||||||||||||||||||||||||||||||||||||||||
|
|
||||||||||||||||||||||||||||||||||||||||||||||||||||||||||||||||||||||||
|
|
||||||||||||||||||||||||||||||||||||||||||||||||||||||||||||||||||||||||
|
|||||||||||||||||||||||||||||||||||||||||||||||||||||||||||||||||||||||||
