Business-to-Business (B2B)
UK

The following table provides summary statistics for permanent job vacancies with a requirement for B2B skills. Included is a benchmarking guide to the salaries offered in vacancies that have cited B2B over the 6 months to 4 December 2023 with a comparison to the same period in the previous 2 years.

6 months to
4 Dec 2023
Same period 2022 Same period 2021
Rank 183 298 242
Rank change year-on-year +115 -56 +18
Permanent jobs citing B2B 1,030 1,471 1,973
As % of all permanent jobs advertised in the UK 1.93% 1.19% 1.54%
As % of the Processes & Methodologies category 2.06% 1.24% 1.61%
Number of salaries quoted 888 919 1,151
10th Percentile - £35,000 £33,750
25th Percentile £25,000 £48,750 £42,500
Median annual salary (50th Percentile) £33,000 £62,500 £57,500
Median % change year-on-year -47.20% +8.70% -4.17%
75th Percentile £62,688 £80,000 £75,000
90th Percentile £85,375 £96,250 £95,000
UK excluding London median annual salary £27,500 £57,500 £50,000
% change year-on-year -52.17% +15.00% -

All Process and Methodology Skills
UK

B2B is in the Processes and Methodologies category. The following table is for comparison with the above and provides summary statistics for all permanent job vacancies with a requirement for process or methodology skills.

Permanent vacancies with a requirement for process or methodology skills 50,088 118,671 122,416
As % of all permanent jobs advertised in the UK 94.09% 95.74% 95.45%
Number of salaries quoted 36,209 72,079 81,851
10th Percentile £32,500 £34,492 £32,500
25th Percentile £43,750 £45,000 £42,500
Median annual salary (50th Percentile) £60,000 £60,000 £60,000
Median % change year-on-year - - +9.09%
75th Percentile £80,000 £82,000 £77,500
90th Percentile £99,025 £100,000 £95,000
UK excluding London median annual salary £52,500 £53,219 £50,000
% change year-on-year -1.35% +6.44% +4.17%

B2B
Job Vacancy Trend

Job postings citing B2B as a proportion of all IT jobs advertised.
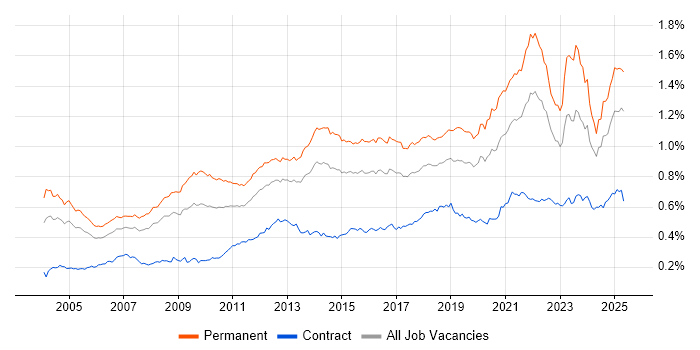
Job vacancy trend for B2B in the UK

B2B
Salary Trend

3-month moving average salary quoted in jobs citing B2B.

Salary trend for B2B in the UK

B2B
Salary Histogram

Salary distribution for jobs citing B2B over the 6 months to 4 December 2023.

Salary histogram for B2B in the UK

B2B
Top 17 Job Locations

The table below looks at the demand and provides a guide to the median salaries quoted in IT jobs citing B2B within the UK over the 6 months to 4 December 2023. The 'Rank Change' column provides an indication of the change in demand within each location based on the same 6 month period last year.

Location Rank Change
on Same Period
Last Year
Matching
Permanent
IT Job Ads
Median Salary
Past 6 Months
Median Salary
% Change
on Same Period
Last Year
Live
Jobs
UK excluding London +195 778 £27,500 -52.17% 456
England +79 750 £45,000 -28.00% 808
Work from Home +7 300 £50,000 -20.00% 351
Scotland +193 243 £25,000 -44.44% 19
Midlands +196 215 £26,500 -49.52% 87
London 0 205 £70,000 - 390
South East +96 152 £37,000 -35.65% 131
West Midlands +184 144 £26,500 -49.52% 51
North of England +124 78 £35,000 -39.13% 131
East Midlands +81 71 £28,000 -47.42% 36
South West +30 65 £51,500 -1.90% 55
Yorkshire +88 46 £28,000 -51.30% 34
North West +76 25 £47,000 -12.56% 89
East of England +73 25 £42,500 -28.99% 37
Wales +30 13 £25,000 -36.71% 8
North East +56 7 £25,000 - 12
Northern Ireland +35 7 £68,000 +18.26% 4

B2B
Co-occurring Skills and Capabilities by Category

The follow tables expand on the table above by listing co-occurrences grouped by category. The same employment type, locality and period is covered with up to 20 co-occurrences shown in each of the following categories:

Application Platforms
1 18 (1.75%) SharePoint
2 15 (1.46%) Confluence
3 5 (0.49%) CMS
3 5 (0.49%) MS Exchange
3 5 (0.49%) WordPress
4 4 (0.39%) OpenStack
5 2 (0.19%) Apache Spark
5 2 (0.19%) BizTalk Server
6 1 (0.097%) Adobe Experience Manager
6 1 (0.097%) Apache
6 1 (0.097%) IIS
Applications
1 41 (3.98%) Microsoft Office
2 19 (1.84%) Microsoft Excel
3 5 (0.49%) Sketch
4 2 (0.19%) Adobe Creative Suite
4 2 (0.19%) AutoCAD
5 1 (0.097%) InVision
5 1 (0.097%) Microsoft PowerPoint
5 1 (0.097%) Microsoft Project
Business Applications
1 12 (1.17%) Salesforce CRM
2 8 (0.78%) Shopify
3 4 (0.39%) Dynamics CRM
4 3 (0.29%) Dynamics NAV
4 3 (0.29%) Magento
4 3 (0.29%) Payment Gateway
5 2 (0.19%) SAP ERP
6 1 (0.097%) Eloqua
6 1 (0.097%) NetSuite
6 1 (0.097%) SAP CRM
6 1 (0.097%) SAP GTS
Cloud Services
1 138 (13.40%) SaaS
2 96 (9.32%) Azure
3 63 (6.12%) AWS
4 30 (2.91%) Microsoft 365
5 18 (1.75%) Azure Logic Apps
5 18 (1.75%) GCP
5 18 (1.75%) Google Analytics
6 17 (1.65%) Entra ID
7 15 (1.46%) Power Platform
8 12 (1.17%) Azure App Service
8 12 (1.17%) Azure DevOps
8 12 (1.17%) Figma
8 12 (1.17%) OneDrive
9 11 (1.07%) Serverless
10 9 (0.87%) Microsoft Purview
11 8 (0.78%) Azure Monitor
12 7 (0.68%) dbt
13 5 (0.49%) Azure Service Bus
13 5 (0.49%) GitHub
13 5 (0.49%) IaaS
Communications & Networking
1 356 (34.56%) Broadband
2 58 (5.63%) WAN
3 43 (4.17%) SD-WAN
4 41 (3.98%) 5G
5 26 (2.52%) Internet
6 22 (2.14%) Firewall
6 22 (2.14%) Network Security
7 17 (1.65%) VPN
8 15 (1.46%) LAN
9 13 (1.26%) TCP/IP
10 12 (1.17%) DNS
10 12 (1.17%) HTTP
11 11 (1.07%) Wi-Fi
12 10 (0.97%) Cisco ASA
12 10 (0.97%) Cisco Firepower
12 10 (0.97%) NGFW
13 9 (0.87%) Cisco Nexus
13 9 (0.87%) Wireless
14 7 (0.68%) DHCP
15 4 (0.39%) SAN
Database & Business Intelligence
1 31 (3.01%) SQL Server
2 24 (2.33%) NoSQL
3 19 (1.84%) PostgreSQL
4 9 (0.87%) Power BI
5 7 (0.68%) MySQL
6 6 (0.58%) Big Data
7 5 (0.49%) SQL Server Integration Services
8 3 (0.29%) Amazon RDS
8 3 (0.29%) Data Warehouse
9 2 (0.19%) Elasticsearch
9 2 (0.19%) Hadoop
9 2 (0.19%) MongoDB
9 2 (0.19%) Relational Database
10 1 (0.097%) Amazon Aurora
10 1 (0.097%) Apache Cassandra
10 1 (0.097%) Apache Hive
10 1 (0.097%) Azure SQL Database
10 1 (0.097%) Data Lake
10 1 (0.097%) Redis
10 1 (0.097%) Tableau
Development Applications
1 21 (2.04%) JIRA
1 21 (2.04%) Visual Studio
2 8 (0.78%) LabVIEW
3 7 (0.68%) Git
4 4 (0.39%) Team Foundation Server
5 3 (0.29%) Jenkins
6 2 (0.19%) Code Climate
6 2 (0.19%) Cypress.io
6 2 (0.19%) Octopus Deploy
6 2 (0.19%) Oracle Forms
6 2 (0.19%) PHPUnit
6 2 (0.19%) Selenium
6 2 (0.19%) TeamCity
7 1 (0.097%) CircleCI
7 1 (0.097%) GitLab
7 1 (0.097%) GoCD
7 1 (0.097%) JUnit
7 1 (0.097%) RSpec
7 1 (0.097%) TestNG
7 1 (0.097%) Tricentis qTest
General
1 550 (53.40%) Social Skills
2 425 (41.26%) Retail
3 395 (38.35%) Telecoms
4 356 (34.56%) Local Government
5 323 (31.36%) Games
6 168 (16.31%) Marketing
7 119 (11.55%) Finance
8 66 (6.41%) Organisational Skills
9 52 (5.05%) Analytical Skills
10 43 (4.17%) Aerospace
11 38 (3.69%) Presentation Skills
12 22 (2.14%) Inclusion and Diversity
13 20 (1.94%) Law
14 11 (1.07%) Influencing Skills
15 9 (0.87%) Advertising
15 9 (0.87%) Tech for Good
15 9 (0.87%) Wearables
16 8 (0.78%) Banking
16 8 (0.78%) French Language
16 8 (0.78%) German Language
Job Titles
1 206 (20.00%) Development Manager
2 195 (18.93%) Business Manager
3 194 (18.83%) Consultant
4 191 (18.54%) Business Development Manager
5 177 (17.18%) Enterprise Consultant
6 95 (9.22%) Senior
7 77 (7.48%) Developer
8 64 (6.21%) Sales Executive
9 60 (5.83%) Lead
10 45 (4.37%) Analyst
11 37 (3.59%) Product Manager
12 29 (2.82%) Sales Representative
13 27 (2.62%) Software Engineer
14 26 (2.52%) Project Manager
15 24 (2.33%) Junior
15 24 (2.33%) Marketing Manager
16 22 (2.14%) Linux Engineer
16 22 (2.14%) Sales Manager
17 21 (2.04%) Full Stack Developer
17 21 (2.04%) Senior Software Engineer
Libraries, Frameworks & Software Standards
1 65 (6.31%) .NET
2 45 (4.37%) React
3 23 (2.23%) .NET Core
4 20 (1.94%) .NET Framework
4 20 (1.94%) AngularJS
5 17 (1.65%) Web Services
6 16 (1.55%) JSON
6 16 (1.55%) RESTful
7 14 (1.36%) ASP.NET
8 12 (1.17%) Blazor
9 11 (1.07%) Razor View Engine
10 10 (0.97%) HTML
10 10 (0.97%) Middleware
11 9 (0.87%) CSS
11 9 (0.87%) Entity Framework
11 9 (0.87%) OAuth
12 8 (0.78%) ASP.NET Web API
12 8 (0.78%) REST
12 8 (0.78%) XML
13 7 (0.68%) RabbitMQ
Miscellaneous
1 50 (4.85%) Self-Motivation
2 27 (2.62%) GNSS
3 26 (2.52%) Product Ownership
4 24 (2.33%) Social Media
5 20 (1.94%) Driving Licence
6 14 (1.36%) Tandem
6 14 (1.36%) Virtual Team
7 11 (1.07%) Onboarding
8 10 (0.97%) Blog
9 9 (0.87%) BYOD
9 9 (0.87%) Enterprise Software
9 9 (0.87%) Greenfield Project
9 9 (0.87%) Management Information System
9 9 (0.87%) Smartphone
10 8 (0.78%) Graphic Design
11 7 (0.68%) Cloud Native
11 7 (0.68%) Mobile App
12 6 (0.58%) Credit Risk
13 5 (0.49%) Client/Server
13 5 (0.49%) Distributed Systems
Operating Systems
1 41 (3.98%) Windows
2 30 (2.91%) Linux
3 20 (1.94%) Android
4 13 (1.26%) Apple iOS
5 12 (1.17%) Unix
6 6 (0.58%) Windows Server
7 5 (0.49%) Debian
8 2 (0.19%) Windows 10
9 1 (0.097%) Ubuntu
Processes & Methodologies
1 474 (46.02%) B2C
2 393 (38.16%) Customer Experience
2 393 (38.16%) Decision-Making
3 381 (36.99%) Collaborative Working
4 266 (25.83%) Business Development
5 123 (11.94%) Agile
6 120 (11.65%) B2B Sales
7 91 (8.83%) Problem-Solving
8 88 (8.54%) Customer Service
9 85 (8.25%) CRM
10 82 (7.96%) Cybersecurity
11 72 (6.99%) Software Engineering
12 66 (6.41%) Project Management
13 58 (5.63%) Test Automation
14 56 (5.44%) Analytics
14 56 (5.44%) Mentoring
15 47 (4.56%) DevOps
16 45 (4.37%) Stakeholder Management
17 43 (4.17%) Roadmaps
18 41 (3.98%) Test Assurance
Programming Languages
1 63 (6.12%) C#
2 54 (5.24%) SQL
3 42 (4.08%) Python
4 39 (3.79%) JavaScript
5 19 (1.84%) C++
6 18 (1.75%) TypeScript
7 14 (1.36%) PHP
8 13 (1.26%) Java
9 12 (1.17%) Bash
10 10 (0.97%) Perl
10 10 (0.97%) Swift
11 9 (0.87%) PowerShell
12 8 (0.78%) Go
12 8 (0.78%) MATLAB
12 8 (0.78%) Objective-C
13 2 (0.19%) R
13 2 (0.19%) T-SQL
14 1 (0.097%) ABAP
14 1 (0.097%) ActionScript
14 1 (0.097%) VB
Qualifications
1 133 (12.91%) Degree
2 26 (2.52%) Security Cleared
3 24 (2.33%) SC Cleared
4 23 (2.23%) Computer Science Degree
5 10 (0.97%) CCNA
5 10 (0.97%) CCNP
5 10 (0.97%) CCSA
5 10 (0.97%) CCSE
5 10 (0.97%) Cisco Certification
6 9 (0.87%) Microsoft Certification
7 8 (0.78%) A+ Certification
7 8 (0.78%) CompTIA Security+
7 8 (0.78%) HND
7 8 (0.78%) MCSA
8 7 (0.68%) PMP
9 6 (0.58%) Master's Degree
10 5 (0.49%) PMI Certification
11 4 (0.39%) AWS Certification
11 4 (0.39%) AWS Certified Solutions Architect
12 3 (0.29%) CISSP
Quality Assurance & Compliance
1 28 (2.72%) PMO
2 18 (1.75%) QA
3 13 (1.26%) SLA
4 8 (0.78%) IFRS
5 5 (0.49%) ISO/IEC 27001
6 4 (0.39%) GAAP
7 3 (0.29%) Data Quality
7 3 (0.29%) GDPR
8 2 (0.19%) Accessibility
8 2 (0.19%) Actionable Recommendations
9 1 (0.097%) ISO/IEC 27002 (supersedes ISO/IEC 17799)
9 1 (0.097%) NIST
9 1 (0.097%) PCI DSS
System Software
1 32 (3.11%) Docker
2 19 (1.84%) Active Directory
3 10 (0.97%) VMware Infrastructure
4 3 (0.29%) Virtual Desktop
5 1 (0.097%) Hyper-V
5 1 (0.097%) KVM
5 1 (0.097%) QEMU
5 1 (0.097%) Virtual Machines
Systems Management
1 28 (2.72%) Kubernetes
2 14 (1.36%) Microsoft Intune
3 11 (1.07%) Terraform
4 4 (0.39%) Jamf Pro
5 3 (0.29%) SCCM
5 3 (0.29%) Single Sign-On
6 2 (0.19%) Active Directory Federation Services
6 2 (0.19%) Ansible
6 2 (0.19%) EMC NetWorker
7 1 (0.097%) Backup Exec
7 1 (0.097%) Grafana
7 1 (0.097%) Microsoft Data Protection Manager
7 1 (0.097%) Prometheus
7 1 (0.097%) SCDPM
Vendors
1 354 (34.37%) BT
2 102 (9.90%) Microsoft
3 37 (3.59%) Google
4 32 (3.11%) Salesforce
5 29 (2.82%) Cisco
6 27 (2.62%) HubSpot
7 20 (1.94%) Palo Alto
8 17 (1.65%) SAP
9 16 (1.55%) CheckPoint
10 12 (1.17%) VMware
11 10 (0.97%) Adobe
11 10 (0.97%) Apple
11 10 (0.97%) Fortinet
12 8 (0.78%) JD Edwards
13 6 (0.58%) Facebook
14 5 (0.49%) Oracle
15 4 (0.39%) Apttus
15 4 (0.39%) Rackspace
15 4 (0.39%) Veeam
16 3 (0.29%) Zerto