Internet
UK

The following table provides summary statistics for permanent job vacancies with a requirement for Internet skills. Included is a benchmarking guide to the salaries offered in vacancies that have cited Internet over the 6 months to 10 December 2023 with a comparison to the same period in the previous 2 years.

6 months to
10 Dec 2023
Same period 2022 Same period 2021
Rank 267 297 288
Rank change year-on-year +30 -9 -26
Permanent jobs citing Internet 651 1,503 1,592
As % of all permanent jobs advertised in the UK 1.25% 1.23% 1.25%
As % of the Communications & Networking category 8.20% 9.91% 9.69%
Number of salaries quoted 480 978 961
10th Percentile £30,000 £30,000 £28,750
25th Percentile £36,250 £41,250 £37,500
Median annual salary (50th Percentile) £55,000 £62,500 £52,500
Median % change year-on-year -12.00% +19.05% -
75th Percentile £77,500 £85,000 £73,750
90th Percentile £88,860 £99,232 £86,250
UK excluding London median annual salary £46,000 £50,000 £46,974
% change year-on-year -8.00% +6.44% -6.05%

All Communications and Computer Networking Skills
UK

Internet is in the Communications and Computer Networking category. The following table is for comparison with the above and provides summary statistics for all permanent job vacancies with a requirement for communications or computer networking skills.

Permanent vacancies with a requirement for communications or computer networking skills 7,935 15,167 16,426
As % of all permanent jobs advertised in the UK 15.18% 12.41% 12.93%
Number of salaries quoted 6,194 10,320 11,502
10th Percentile £26,500 £28,528 £27,500
25th Percentile £34,000 £37,500 £36,250
Median annual salary (50th Percentile) £50,000 £52,500 £50,000
Median % change year-on-year -4.76% +5.00% -
75th Percentile £67,500 £72,500 £70,000
90th Percentile £85,000 £88,750 £85,000
UK excluding London median annual salary £45,000 £46,000 £45,000
% change year-on-year -2.17% +2.22% -

Internet
Job Vacancy Trend

Job postings citing Internet as a proportion of all IT jobs advertised.
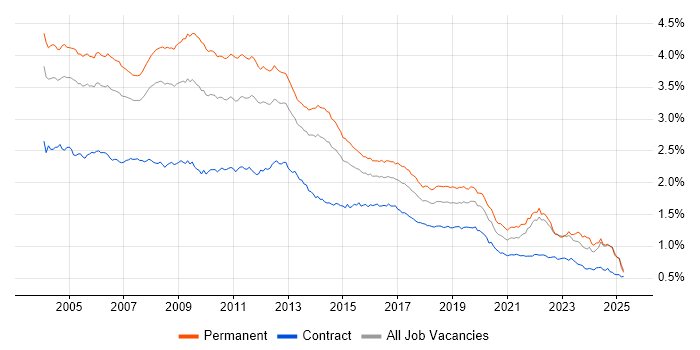
Job vacancy trend for Internet in the UK

Internet
Salary Trend

3-month moving average salary quoted in jobs citing Internet.

Salary trend for Internet in the UK

Internet
Salary Histogram

Salary distribution for jobs citing Internet over the 6 months to 10 December 2023.

Salary histogram for Internet in the UK

Internet
Top 17 Job Locations

The table below looks at the demand and provides a guide to the median salaries quoted in IT jobs citing Internet within the UK over the 6 months to 10 December 2023. The 'Rank Change' column provides an indication of the change in demand within each location based on the same 6 month period last year.

Location Rank Change
on Same Period
Last Year
Matching
Permanent
IT Job Ads
Median Salary
Past 6 Months
Median Salary
% Change
on Same Period
Last Year
Live
Jobs
England +38 581 £55,000 -9.84% 452
UK excluding London +72 397 £46,000 -8.00% 275
Work from Home +49 293 £67,500 +3.85% 227
London +13 233 £66,056 -6.62% 201
South East +90 124 £47,500 - 100
North of England +135 88 £47,500 -13.64% 71
South West +36 62 £37,500 -25.00% 31
Yorkshire +100 47 £41,250 -17.50% 31
Midlands +75 45 £39,250 -28.64% 33
North West +100 37 £65,000 +18.18% 33
East of England +82 33 £45,000 +66.67% 41
Wales +43 32 £41,250 -29.79%
West Midlands +93 29 £35,000 -36.36% 27
Scotland +6 17 £68,750 +37.50% 14
East Midlands +28 16 £55,500 -9.39% 6
North East +39 4 £49,000 -2.00% 12
Northern Ireland -7 1 £36,000 -48.57% 2

Internet
Co-occurring Skills and Capabilities by Category

The follow tables expand on the table above by listing co-occurrences grouped by category. The same employment type, locality and period is covered with up to 20 co-occurrences shown in each of the following categories:

Application Platforms
1 20 (3.07%) IIS
2 19 (2.92%) SharePoint
3 16 (2.46%) Tomcat
4 10 (1.54%) Apache
5 9 (1.38%) MS Exchange
5 9 (1.38%) nginx
5 9 (1.38%) WordPress
6 8 (1.23%) Confluence
6 8 (1.23%) Jetty
7 6 (0.92%) Joomla!
8 5 (0.77%) ColdFusion
8 5 (0.77%) OpenStack
9 4 (0.61%) Apache Spark
10 3 (0.46%) CMS
10 3 (0.46%) Drupal
11 2 (0.31%) JBoss
11 2 (0.31%) Oracle SOA Suite
11 2 (0.31%) ThingWorx
12 1 (0.15%) Apache Airflow
12 1 (0.15%) WildFly
Applications
1 59 (9.06%) Microsoft Office
2 10 (1.54%) Microsoft Excel
3 6 (0.92%) MS Visio
4 3 (0.46%) Microsoft PowerPoint
5 1 (0.15%) Acrobat
Business Applications
1 4 (0.61%) Fidessa
2 2 (0.31%) Ripple
3 1 (0.15%) Magento
3 1 (0.15%) Oracle Payables
3 1 (0.15%) osCommerce
Cloud Services
1 178 (27.34%) Azure
2 102 (15.67%) AWS
3 99 (15.21%) Microsoft 365
4 32 (4.92%) Entra ID
5 27 (4.15%) SaaS
6 26 (3.99%) Serverless
7 19 (2.92%) Azure DevOps
8 16 (2.46%) AWS Lambda
9 12 (1.84%) Azure Sentinel
9 12 (1.84%) Power Platform
10 11 (1.69%) Azure ExpressRoute
10 11 (1.69%) Cloud Computing
11 9 (1.38%) Amazon SQS
11 9 (1.38%) Azure Service Bus
11 9 (1.38%) GitHub
11 9 (1.38%) IaaS
11 9 (1.38%) WhatsApp
12 8 (1.23%) AWS IoT
12 8 (1.23%) GCP
12 8 (1.23%) PaaS
Communications & Networking
1 208 (31.95%) Firewall
2 162 (24.88%) WAN
3 155 (23.81%) VPN
4 152 (23.35%) LAN
5 112 (17.20%) DNS
6 98 (15.05%) TCP/IP
7 92 (14.13%) Wireless
8 72 (11.06%) DHCP
9 67 (10.29%) Network Security
10 56 (8.60%) HTTP
11 47 (7.22%) Wi-Fi
12 43 (6.61%) MPLS
13 40 (6.14%) SMTP
14 39 (5.99%) BGP
15 35 (5.38%) FTP
15 35 (5.38%) SAN
15 35 (5.38%) SD-WAN
16 30 (4.61%) Sourcefire
16 30 (4.61%) VoIP
17 29 (4.45%) NGFW
Database & Business Intelligence
1 44 (6.76%) SQL Server
2 27 (4.15%) Amazon RDS
3 20 (3.07%) MySQL
4 18 (2.76%) Relational Database
5 17 (2.61%) NoSQL
6 12 (1.84%) Big Data
6 12 (1.84%) Oracle Database
7 11 (1.69%) DynamoDB
7 11 (1.69%) SQL Server Integration Services
8 10 (1.54%) PostgreSQL
9 9 (1.38%) Azure SQL Database
10 8 (1.23%) Hadoop
11 6 (0.92%) Redis
12 3 (0.46%) Amazon Aurora
12 3 (0.46%) Data Warehouse
12 3 (0.46%) Elasticsearch
12 3 (0.46%) MongoDB
12 3 (0.46%) Power BI
12 3 (0.46%) SQL Server Reporting Services
13 2 (0.31%) SQL Server Analysis Services
Development Applications
1 65 (9.98%) Git
2 28 (4.30%) Jenkins
3 19 (2.92%) SonarQube
4 17 (2.61%) JIRA
5 15 (2.30%) IBM UrbanCode
6 8 (1.23%) Maven
7 6 (0.92%) Selenium
7 6 (0.92%) Sonatype Nexus
8 5 (0.77%) Cypress.io
8 5 (0.77%) FitNesse
8 5 (0.77%) Octopus Deploy
8 5 (0.77%) TeamCity
8 5 (0.77%) WebDriver
9 3 (0.46%) Burp Suite
9 3 (0.46%) Metasploit
10 2 (0.31%) Bitbucket
10 2 (0.31%) GCC
10 2 (0.31%) Jasmine
10 2 (0.31%) Karma Test Runner
11 1 (0.15%) Appium
General
1 166 (25.50%) Social Skills
2 143 (21.97%) Finance
3 108 (16.59%) Analytical Skills
4 90 (13.82%) Telecoms
5 54 (8.29%) Banking
6 51 (7.83%) Retail
7 47 (7.22%) Law
8 45 (6.91%) Legal
9 39 (5.99%) Games
10 29 (4.45%) Organisational Skills
11 23 (3.53%) Financial Institution
11 23 (3.53%) Retail Banking
12 22 (3.38%) Electronics
13 19 (2.92%) Automotive
13 19 (2.92%) Marketing
14 18 (2.76%) Multimedia
15 17 (2.61%) Public Sector
16 16 (2.46%) Military
17 14 (2.15%) Local Government
18 13 (2.00%) Presentation Skills
Job Titles
1 92 (14.13%) Senior
2 83 (12.75%) Analyst
3 70 (10.75%) Software Engineer
4 65 (9.98%) Network Engineer
5 58 (8.91%) Developer
6 57 (8.76%) Support Engineer
7 47 (7.22%) Architect
8 34 (5.22%) Support Technician
9 33 (5.07%) IT Engineer
10 30 (4.61%) SOC Analyst
11 29 (4.45%) IT Support
11 29 (4.45%) Lead
12 26 (3.99%) 3rd Line Support
13 25 (3.84%) Support Analyst
14 24 (3.69%) Security Engineer
15 23 (3.53%) 2nd Line Support
15 23 (3.53%) Desktop Support
16 22 (3.38%) DevOps Engineer
16 22 (3.38%) Infrastructure Engineer
16 22 (3.38%) Linux Engineer
Libraries, Frameworks & Software Standards
1 45 (6.91%) CSS
2 39 (5.99%) HTML
3 36 (5.53%) .NET
4 35 (5.38%) LDAP
5 30 (4.61%) REST
6 29 (4.45%) Spring
7 27 (4.15%) React
8 25 (3.84%) jQuery
9 22 (3.38%) XML
10 21 (3.23%) JSON
11 20 (3.07%) Web Services
12 19 (2.92%) OpenGL
12 19 (2.92%) RESTful
12 19 (2.92%) Vulkan
13 18 (2.76%) Direct3D
13 18 (2.76%) OpenGL ES
14 15 (2.30%) HTML5
15 10 (1.54%) CSS3
16 9 (1.38%) Node.js
17 8 (1.23%) AngularJS
Miscellaneous
1 61 (9.37%) IoT
2 49 (7.53%) Data Centre
3 37 (5.68%) Management Information System
4 36 (5.53%) Online Banking
5 35 (5.38%) PKI
6 32 (4.92%) Security Operations Centre
7 31 (4.76%) Cyber Threat
8 30 (4.61%) Analytical Mindset
8 30 (4.61%) Public Cloud
9 26 (3.99%) Self-Motivation
10 23 (3.53%) Distributed Applications
11 19 (2.92%) Mali
12 18 (2.76%) 3D Graphics
12 18 (2.76%) Smartphone
13 17 (2.61%) Robotics
14 15 (2.30%) Augmented Reality
14 15 (2.30%) Virtual Reality
15 13 (2.00%) Housing Association
16 11 (1.69%) Replication
17 9 (1.38%) Low-Code
Operating Systems
1 181 (27.80%) Windows
2 97 (14.90%) Linux
3 71 (10.91%) Windows Server
4 46 (7.07%) Android
5 36 (5.53%) Apple iOS
6 29 (4.45%) Ubuntu
7 22 (3.38%) VMS
7 22 (3.38%) Windows 10
8 20 (3.07%) Unix
9 16 (2.46%) Windows Server 2016
10 15 (2.30%) Windows Server 2019
11 10 (1.54%) CentOS
11 10 (1.54%) Debian
12 7 (1.08%) Fedora
12 7 (1.08%) openSUSE
12 7 (1.08%) Windows Server 2012
13 6 (0.92%) Windows 7
13 6 (0.92%) Windows 8
14 5 (0.77%) Mac OS
14 5 (0.77%) Mac OS X
Processes & Methodologies
1 204 (31.34%) Problem-Solving
2 107 (16.44%) Agile
3 100 (15.36%) Customer Service
4 95 (14.59%) Cybersecurity
5 84 (12.90%) Software Engineering
6 75 (11.52%) ITIL
7 72 (11.06%) DevOps
8 70 (10.75%) Computer Science
9 64 (9.83%) Actionable Insight
10 62 (9.52%) SIEM
11 60 (9.22%) SDLC
12 59 (9.06%) Time Management
13 56 (8.60%) Microservices
14 49 (7.53%) Kalman Filter
14 49 (7.53%) Roadmaps
15 45 (6.91%) Customer Experience
16 42 (6.45%) Security Operations
17 38 (5.84%) CI/CD
18 35 (5.38%) Infrastructure Engineering
18 35 (5.38%) Multi-Factor Authentication
Programming Languages
1 92 (14.13%) Python
2 74 (11.37%) JavaScript
3 63 (9.68%) SQL
4 57 (8.76%) Java
5 55 (8.45%) PowerShell
6 37 (5.68%) C
7 33 (5.07%) C#
8 29 (4.45%) C++
9 27 (4.15%) Bash
10 17 (2.61%) Go
11 16 (2.46%) PHP
12 15 (2.30%) R
13 10 (1.54%) TypeScript
14 7 (1.08%) Shell Script
15 5 (0.77%) Ruby
15 5 (0.77%) Swift
15 5 (0.77%) XAML
16 4 (0.61%) PL/SQL
17 3 (0.46%) Perl
17 3 (0.46%) T-SQL
Qualifications
1 118 (18.13%) Degree
2 68 (10.45%) Security Cleared
3 39 (5.99%) Cisco Certification
3 39 (5.99%) SC Cleared
4 32 (4.92%) CCNP
5 29 (4.45%) CISSP
6 22 (3.38%) Master's Degree
7 20 (3.07%) PhD
8 15 (2.30%) CCNA
8 15 (2.30%) Computer Science Degree
9 14 (2.15%) CISM
10 13 (2.00%) CCIE
11 9 (1.38%) DV Cleared
11 9 (1.38%) JNCIA
12 8 (1.23%) ITIL Certification
13 7 (1.08%) CEH
13 7 (1.08%) Microsoft Certification
14 6 (0.92%) JNCIE
14 6 (0.92%) JNCIP
14 6 (0.92%) JNCIS
Quality Assurance & Compliance
1 27 (4.15%) SLA
2 13 (2.00%) Cyber Essentials
3 12 (1.84%) NCSC
4 11 (1.69%) ISO/IEC 27001
5 10 (1.54%) NIST
6 9 (1.38%) Accessibility
7 8 (1.23%) QA
8 4 (0.61%) GDPR
8 4 (0.61%) RMADS
9 2 (0.31%) ISO 9001
9 2 (0.31%) PCI DSS
10 1 (0.15%) California Consumer Privacy Act
10 1 (0.15%) COPPA
10 1 (0.15%) Cyber Essentials PLUS
10 1 (0.15%) Data Quality
10 1 (0.15%) HIPAA
10 1 (0.15%) PSD2
10 1 (0.15%) Sarbanes-Oxley
10 1 (0.15%) Software Quality Assurance
System Software
1 138 (21.20%) Active Directory
2 62 (9.52%) VMware Infrastructure
3 37 (5.68%) Docker
4 19 (2.92%) Hyper-V
5 16 (2.46%) VMware ESXi
6 15 (2.30%) Firmware
7 8 (1.23%) vSphere
8 7 (1.08%) Samba
8 7 (1.08%) Virtual Servers
9 6 (0.92%) BitLocker
9 6 (0.92%) Virtual Desktop
9 6 (0.92%) Virtual Machines
10 3 (0.46%) Embedded Firmware
10 3 (0.46%) Shibboleth
10 3 (0.46%) VMware NSX
10 3 (0.46%) VMware Server
10 3 (0.46%) XenApp
10 3 (0.46%) XenDesktop
11 2 (0.31%) Microsoft Virtual Server
12 1 (0.15%) Squid
Systems Management
1 41 (6.30%) Kubernetes
2 40 (6.14%) Terraform
3 39 (5.99%) FortiGate
4 37 (5.68%) Ansible
5 19 (2.92%) Microsoft Intune
6 14 (2.15%) SCCM
7 10 (1.54%) Progress Chef
8 7 (1.08%) Puppet
9 6 (0.92%) Cisco CUCM
10 5 (0.77%) Control-M
10 5 (0.77%) Grafana
11 4 (0.61%) CASB
11 4 (0.61%) Nagios
11 4 (0.61%) Nessus
12 3 (0.46%) Failover Clustering
12 3 (0.46%) Nmap
12 3 (0.46%) Prometheus
12 3 (0.46%) Stealthwatch
12 3 (0.46%) vCenter Server
12 3 (0.46%) ZABBIX
Vendors
1 164 (25.19%) Microsoft
2 153 (23.50%) Cisco
3 69 (10.60%) VMware
4 63 (9.68%) Juniper
5 56 (8.60%) CheckPoint
6 54 (8.29%) Palo Alto
7 46 (7.07%) IBM
8 45 (6.91%) HP
9 35 (5.38%) F5
10 33 (5.07%) Meraki
10 33 (5.07%) Veeam
11 32 (4.92%) Fortinet
12 31 (4.76%) Splunk
13 30 (4.61%) ArcSight
13 30 (4.61%) TippingPoint
13 30 (4.61%) Trend Micro
14 28 (4.30%) Mitel
15 23 (3.53%) Nimble Storage
15 23 (3.53%) Oracle
15 23 (3.53%) Zerto