Business Development Jobs

Business Development
UK

The table below provides summary statistics for permanent job vacancies requiring Business Development skills. It includes a benchmarking guide to the annual salaries offered in vacancies that cited Business Development over the 6 months leading up to 26 October 2024, comparing them to the same period in the previous two years.

6 months to
26 Oct 2024
Same period 2023 Same period 2022
Rank 73 118 188
Rank change year-on-year +45 +70 +31
Permanent jobs citing Business Development 2,384 1,622 2,876
As % of all permanent jobs advertised in the UK 3.14% 2.76% 2.04%
As % of the Processes & Methodologies category 3.73% 2.93% 2.12%
Number of salaries quoted 624 876 865
10th Percentile £30,000 £25,000 £35,000
25th Percentile £38,000 £28,000 £45,500
Median annual salary (50th Percentile) £56,509 £39,085 £61,500
Median % change year-on-year +44.58% -36.45% -12.14%
75th Percentile £80,625 £71,250 £87,500
90th Percentile £105,000 £91,875 £106,250
UK excluding London median annual salary £51,242 £33,000 £55,000
% change year-on-year +55.28% -40.00% -

All Process and Methodology Skills
UK

Business Development falls under the Processes and Methodologies category. For comparison with the information above, the following table provides summary statistics for all permanent job vacancies requiring process or methodology skills.

Permanent vacancies with a requirement for process or methodology skills 63,908 55,391 135,614
As % of all permanent jobs advertised in the UK 84.07% 94.35% 96.13%
Number of salaries quoted 30,608 39,736 76,629
10th Percentile £34,000 £32,500 £34,000
25th Percentile £45,000 £44,497 £45,000
Median annual salary (50th Percentile) £60,000 £60,000 £60,000
Median % change year-on-year - - +4.35%
75th Percentile £77,500 £80,000 £81,000
90th Percentile £97,250 £97,500 £98,750
UK excluding London median annual salary £54,125 £52,500 £52,500
% change year-on-year +3.10% - +5.00%

Business Development
Job Vacancy Trend

Job postings citing Business Development as a proportion of all IT jobs advertised.
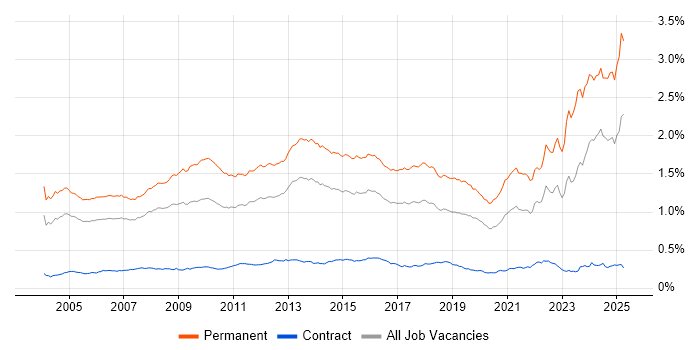
Job vacancy trend for Business Development in the UK

Business Development
Salary Trend

3-month moving average salary quoted in jobs citing Business Development.

Salary trend for Business Development in the UK

Business Development
Salary Histogram

Salary distribution for jobs citing Business Development over the 6 months to 26 October 2024.

Salary histogram for Business Development in the UK

Business Development
Top 17 Job Locations

The table below looks at the demand and provides a guide to the median salaries quoted in IT jobs citing Business Development within the UK over the 6 months to 26 October 2024. The 'Rank Change' column provides an indication of the change in demand within each location based on the same 6 month period last year.

Location Rank Change
on Same Period
Last Year
Matching
Permanent
IT Job Ads
Median Salary
Past 6 Months
Median Salary
% Change
on Same Period
Last Year
Live
Jobs
England +66 2,148 £55,750 +39.38% 614
UK excluding London +52 1,664 £51,242 +55.28% 324
London +55 631 £72,500 +20.83% 313
Midlands +83 495 £35,000 +32.08% 54
Work from Home +5 473 £42,000 -26.96% 434
North of England +78 439 £63,000 +96.88% 96
South East +32 378 £51,242 +31.10% 79
North West +78 299 £63,000 +64.71% 61
West Midlands +62 284 £32,500 +22.64% 35
East Midlands +61 211 £36,000 +35.85% 19
Scotland -30 130 £65,000 +160.00% 14
Yorkshire +56 129 £70,000 +154.55% 26
South West +12 111 £45,000 -10.00% 49
East of England -52 80 £75,000 +91.89% 28
Northern Ireland +28 27 £55,000 - 11
North East -23 18 - - 9
Wales +8 17 £35,700 +11.56% 6

Business Development
Co-occurring Skills and Capabilities by Category

The follow tables expand on the table above by listing co-occurrences grouped by category. The same employment type, locality and period is covered with up to 20 co-occurrences shown in each of the following categories:

Application Platforms
1 8 (0.34%) Apache Spark
2 4 (0.17%) WordPress
3 2 (0.084%) Confluence
3 2 (0.084%) Umbraco
4 1 (0.042%) ArcGIS
4 1 (0.042%) CMS
4 1 (0.042%) IIS
4 1 (0.042%) SAS
4 1 (0.042%) SharePoint
Applications
1 568 (23.83%) Microsoft Excel
2 540 (22.65%) Microsoft Office
3 186 (7.80%) Microsoft PowerPoint
4 7 (0.29%) MS Visio
5 4 (0.17%) Adobe XD
5 4 (0.17%) InVision
5 4 (0.17%) Sketch
6 3 (0.13%) Spreadsheet
7 2 (0.084%) InDesign
7 2 (0.084%) Photoshop
8 1 (0.042%) Adobe Creative Suite
8 1 (0.042%) Adobe Premiere
8 1 (0.042%) EPLAN
Business Applications
1 52 (2.18%) Salesforce CRM
2 44 (1.85%) Ripple
3 36 (1.51%) SAP S/4HANA
4 14 (0.59%) Dynamics CRM
5 12 (0.50%) Oracle ERP
6 5 (0.21%) NEC Housing
7 4 (0.17%) Dynamics AX
7 4 (0.17%) SAP SCM
8 3 (0.13%) Misys Midas
8 3 (0.13%) Oracle Payroll
8 3 (0.13%) SAP ERP
8 3 (0.13%) SAP HCM
8 3 (0.13%) Workday HCM
9 2 (0.084%) HiPortfolio
9 2 (0.084%) Magento
9 2 (0.084%) SAP Hybris
9 2 (0.084%) SAP IBP
9 2 (0.084%) SAP MDG
9 2 (0.084%) SAP PLM
9 2 (0.084%) Shopify
Cloud Services
1 163 (6.84%) AWS
2 152 (6.38%) Azure
3 107 (4.49%) GCP
4 91 (3.82%) Power Platform
5 62 (2.60%) SaaS
6 33 (1.38%) OCI
7 21 (0.88%) Microsoft 365
8 16 (0.67%) Entra ID
9 13 (0.55%) Dynamics 365
10 12 (0.50%) Google Workspace
11 8 (0.34%) Figma
12 7 (0.29%) Azure AKS
12 7 (0.29%) Google Kubernetes Engine
12 7 (0.29%) IaaS
12 7 (0.29%) Microsoft Copilot
12 7 (0.29%) PaaS
12 7 (0.29%) Salesforce Sales Cloud
12 7 (0.29%) Salesforce Service Cloud
13 6 (0.25%) SuccessFactors
14 5 (0.21%) Snowflake
Communications & Networking
1 35 (1.47%) Internet
2 23 (0.96%) LAN
3 18 (0.76%) Broadband
4 17 (0.71%) SD-WAN
4 17 (0.71%) Wi-Fi
5 16 (0.67%) VoIP
5 16 (0.67%) VPN
6 15 (0.63%) Ethernet
7 14 (0.59%) WAN
8 12 (0.50%) 5G
9 11 (0.46%) WLAN
10 10 (0.42%) 4G
10 10 (0.42%) Firewall
10 10 (0.42%) Unified Communications
10 10 (0.42%) Wireless
11 6 (0.25%) LTE
11 6 (0.25%) Network Security
11 6 (0.25%) PPP
11 6 (0.25%) Radio Access Network
12 4 (0.17%) VPLS
Database & Business Intelligence
1 79 (3.31%) Power BI
2 75 (3.15%) Tableau
3 33 (1.38%) Data Warehouse
4 24 (1.01%) Data Vault
5 20 (0.84%) SQL Server Reporting Services
6 19 (0.80%) SQL Server
7 15 (0.63%) Data Lake
8 12 (0.50%) Amazon Aurora
8 12 (0.50%) DynamoDB
8 12 (0.50%) Metadata
9 11 (0.46%) Big Data
10 6 (0.25%) Data Mining
10 6 (0.25%) NoSQL
11 3 (0.13%) Snowflake Schema
11 3 (0.13%) Star Schema
12 2 (0.084%) GIS
12 2 (0.084%) MongoDB
12 2 (0.084%) SQL Server Integration Services
13 1 (0.042%) Apache Cassandra
13 1 (0.042%) PostgreSQL
Development Applications
1 19 (0.80%) Visual Studio
2 4 (0.17%) Axure RP
3 3 (0.13%) Jenkins
3 3 (0.13%) JIRA
4 1 (0.042%) Balsamiq
4 1 (0.042%) Bitbucket
4 1 (0.042%) Git
4 1 (0.042%) GitLab
4 1 (0.042%) LabVIEW
4 1 (0.042%) RStudio
4 1 (0.042%) Vagrant
General
1 946 (39.68%) Finance
2 774 (32.47%) Social Skills
3 653 (27.39%) Marketing
4 639 (26.80%) Retail
5 557 (23.36%) Analytical Skills
6 282 (11.83%) Presentation Skills
7 214 (8.98%) Legal
8 180 (7.55%) Law
9 121 (5.08%) Banking
9 121 (5.08%) Public Sector
10 107 (4.49%) Billing
11 93 (3.90%) Telecoms
12 92 (3.86%) Inclusion and Diversity
13 78 (3.27%) Pharmaceutical
14 75 (3.15%) Manufacturing
15 73 (3.06%) Local Government
16 69 (2.89%) Financial Institution
17 44 (1.85%) Retail Banking
18 40 (1.68%) Aerospace
19 39 (1.64%) Aviation
Job Titles
1 1,214 (50.92%) Development Manager
2 913 (38.30%) Business Manager
3 911 (38.21%) Business Development Manager
4 202 (8.47%) Senior
5 184 (7.72%) Architect
6 129 (5.41%) Consultant
7 97 (4.07%) Senior Manager
8 94 (3.94%) Analyst
9 90 (3.78%) Solutions Architect
10 57 (2.39%) Data Architect
11 52 (2.18%) Business Development Executive
12 49 (2.06%) Software Engineer
13 47 (1.97%) Audit Manager
14 43 (1.80%) Lead
14 43 (1.80%) Project Manager
15 37 (1.55%) Infrastructure Manager
16 36 (1.51%) Senior Architect
17 34 (1.43%) IT Manager
18 31 (1.30%) Senior Audit Manager
19 29 (1.22%) Developer
Libraries, Frameworks & Software Standards
1 49 (2.06%) React
2 30 (1.26%) Spring
3 27 (1.13%) .NET
4 20 (0.84%) XML
5 19 (0.80%) .NET Core
5 19 (0.80%) .NET Framework
5 19 (0.80%) JSON
6 17 (0.71%) Middleware
7 12 (0.50%) PySpark
8 11 (0.46%) Oracle Fusion
9 8 (0.34%) CSS
9 8 (0.34%) HTML
10 7 (0.29%) ASP.NET
11 6 (0.25%) ASP.NET MVC
12 5 (0.21%) Lightning Web Components
13 2 (0.084%) Kafka
14 1 (0.042%) AngularJS
14 1 (0.042%) ASP.NET Web API
14 1 (0.042%) Entity Framework
14 1 (0.042%) Protocol Buffers
Miscellaneous
1 173 (7.26%) Life Science
2 147 (6.17%) Self-Motivation
3 89 (3.73%) Driving Licence
4 61 (2.56%) NHS
5 58 (2.43%) Onboarding
6 46 (1.93%) iPad
7 44 (1.85%) Blockchain
8 40 (1.68%) Management Information System
9 32 (1.34%) Operational Technology
10 30 (1.26%) NFT
11 29 (1.22%) Social Media
12 26 (1.09%) Public Cloud
13 23 (0.96%) Credit Risk
13 23 (0.96%) Data Centre
14 21 (0.88%) Hybrid Cloud
14 21 (0.88%) Mobile App
15 19 (0.80%) Product Ownership
16 17 (0.71%) Pharmacovigilance
17 16 (0.67%) Foreign Exchange (FX)
18 15 (0.63%) Cloud Native
Operating Systems
1 17 (0.71%) Windows
2 7 (0.29%) Windows Vista
3 6 (0.25%) Linux
4 3 (0.13%) Android
5 2 (0.084%) Android TV
6 1 (0.042%) CentOS
6 1 (0.042%) Red Hat Enterprise Linux
6 1 (0.042%) Ubuntu
6 1 (0.042%) Unix
Processes & Methodologies
1 758 (31.80%) Agile
2 485 (20.34%) Logistics
3 393 (16.48%) Facilities Management
4 391 (16.40%) Data Management
5 376 (15.77%) Customer Requirements
6 360 (15.10%) Commercial Awareness
7 355 (14.89%) Financial Modelling
8 348 (14.60%) CAD
9 339 (14.22%) CRM
10 315 (13.21%) B2B
11 304 (12.75%) Problem-Solving
12 270 (11.33%) Coaching
13 191 (8.01%) Decision-Making
14 182 (7.63%) Project Management
15 177 (7.42%) Contract Negotiation
16 168 (7.05%) Time Management
17 147 (6.17%) B2B Sales
18 143 (6.00%) Business Strategy
19 138 (5.79%) Stakeholder Management
20 136 (5.70%) Analytics
Programming Languages
1 66 (2.77%) Java
2 53 (2.22%) SQL
3 52 (2.18%) Python
4 41 (1.72%) JavaScript
5 30 (1.26%) Rust
5 30 (1.26%) Solidity
6 25 (1.05%) Scala
7 22 (0.92%) R
8 12 (0.50%) Go
9 9 (0.38%) C
9 9 (0.38%) C#
10 7 (0.29%) C++
11 6 (0.25%) Fortran
12 2 (0.084%) VBA
13 1 (0.042%) Bash
13 1 (0.042%) Data Analysis Expressions
13 1 (0.042%) Kotlin
13 1 (0.042%) Perl
13 1 (0.042%) PowerShell
13 1 (0.042%) TypeScript
Qualifications
1 201 (8.43%) Degree
2 150 (6.29%) ACCA
3 138 (5.79%) Security Cleared
4 105 (4.40%) SC Cleared
5 32 (1.34%) DV Cleared
6 31 (1.30%) Master's Degree
7 28 (1.17%) AWS Certification
8 22 (0.92%) Azure Certification
8 22 (0.92%) PhD
9 17 (0.71%) PMI Certification
10 16 (0.67%) CISM
10 16 (0.67%) CISSP
11 13 (0.55%) CFA
12 12 (0.50%) (ISC)2 CCSP
12 12 (0.50%) CCSP
12 12 (0.50%) Cisco Certification
12 12 (0.50%) ISACA
13 11 (0.46%) DBS Check
14 9 (0.38%) MBA
15 6 (0.25%) ICAEW
Quality Assurance & Compliance
1 110 (4.61%) GAAP
1 110 (4.61%) IFRS
2 67 (2.81%) SLA
3 27 (1.13%) QA
4 19 (0.80%) ISO/IEC 27001
5 17 (0.71%) Data Quality
6 13 (0.55%) Accessibility
7 12 (0.50%) Cyber Essentials
7 12 (0.50%) Cyber Essentials PLUS
7 12 (0.50%) IASME
7 12 (0.50%) NIST
8 11 (0.46%) PCI DSS
9 10 (0.42%) ISO 14001
9 10 (0.42%) ISO 9001
10 6 (0.25%) Good Clinical Practice
11 4 (0.17%) GDPR
11 4 (0.17%) GRC
11 4 (0.17%) ISO 22301
11 4 (0.17%) NCSC
11 4 (0.17%) NIST 800
System Software
1 38 (1.59%) Docker
2 28 (1.17%) Active Directory
3 24 (1.01%) VMware Infrastructure
4 1 (0.042%) Embedded Firmware
4 1 (0.042%) Firmware
4 1 (0.042%) HDFS
4 1 (0.042%) Virtual Desktop
4 1 (0.042%) Virtual Machines
Systems Management
1 44 (1.85%) Kubernetes
2 16 (0.67%) Microsoft Intune
3 10 (0.42%) Terraform
4 2 (0.084%) EMC NetWorker
4 2 (0.084%) Functional Safety
5 1 (0.042%) Ansible
5 1 (0.042%) CSIRT
5 1 (0.042%) MOM
5 1 (0.042%) Podman
5 1 (0.042%) WMI
Vendors
1 748 (31.38%) Microsoft
2 253 (10.61%) Salesforce
3 106 (4.45%) SAP
4 49 (2.06%) Oracle
5 37 (1.55%) YouTube
6 28 (1.17%) Google
7 24 (1.01%) VMware
8 22 (0.92%) Intel
9 19 (0.80%) HubSpot
10 16 (0.67%) Barracuda Networks
10 16 (0.67%) Databricks
10 16 (0.67%) Nimble Storage
10 16 (0.67%) Palo Alto
11 12 (0.50%) BT
12 8 (0.34%) NEC
13 7 (0.29%) Alteryx
13 7 (0.29%) NetApp
14 6 (0.25%) Adobe
14 6 (0.25%) IBM
14 6 (0.25%) Logitech