Azure DevOps Contracts in London

Microsoft Azure DevOps
England > London

The table below provides summary statistics for contract job vacancies advertised in London requiring Azure DevOps skills. It includes a benchmarking guide to the contractor rates offered in vacancies that cited Azure DevOps over the 6 months leading up to 11 January 2025, comparing them to the same period in the previous two years.

6 months to
11 Jan 2025
Same period 2024 Same period 2023
Rank 75 80 80
Rank change year-on-year +5 0 +8
Contract jobs citing Azure DevOps 455 512 1,002
As % of all contract jobs advertised in London 3.24% 2.82% 3.11%
As % of the Cloud Services category 7.90% 7.47% 8.09%
Number of daily rates quoted 309 380 683
10th Percentile £387 £425 £450
25th Percentile £463 £505 £503
Median daily rate (50th Percentile) £550 £575 £575
Median % change year-on-year -4.35% - -
75th Percentile £638 £641 £675
90th Percentile £725 £713 £775
England median daily rate £528 £550 £550
% change year-on-year -4.09% - -
Number of hourly rates quoted 0 0 1
Median hourly rate - - £65.79
England median hourly rate £73.75 £62.00 £55.00
% change year-on-year +18.95% +12.73% -

All Cloud Skills
London

Azure DevOps falls under the Cloud Services category. For comparison with the information above, the following table provides summary statistics for all contract job vacancies requiring cloud computing skills in London.

Contract vacancies with a requirement for cloud computing skills 5,761 6,855 12,388
As % of all contract IT jobs advertised in London 41.02% 37.76% 38.47%
Number of daily rates quoted 3,871 5,068 8,884
10th Percentile £350 £325 £400
25th Percentile £454 £450 £495
Median daily rate (50th Percentile) £550 £550 £600
Median % change year-on-year - -8.33% +5.26%
75th Percentile £675 £675 £688
90th Percentile £775 £765 £775
England median daily rate £525 £525 £550
% change year-on-year - -4.55% +3.77%
Number of hourly rates quoted 44 66 89
10th Percentile £21.56 £17.50 £16.51
25th Percentile £23.80 £20.69 £20.75
Median hourly rate £30.80 £35.32 £25.85
Median % change year-on-year -12.80% +36.64% +3.38%
75th Percentile £46.90 £58.75 £57.50
90th Percentile £64.63 £71.25 £74.62
England median hourly rate £28.46 £22.50 £22.50
% change year-on-year +26.47% - +7.60%

Azure DevOps
Job Vacancy Trend in London

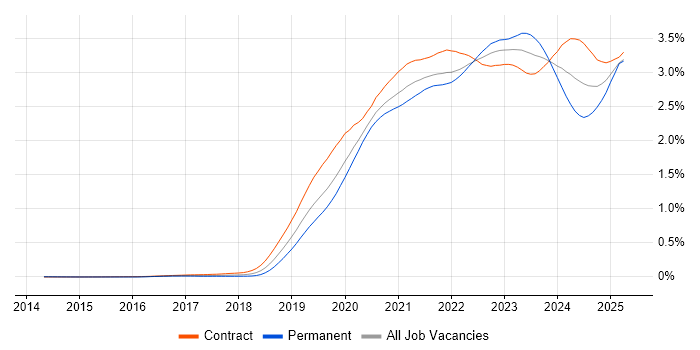
Job postings citing Azure DevOps as a proportion of all IT jobs advertised in London.

Job vacancy trend for Azure DevOps in London

Azure DevOps
Contractor Daily Rate Trend in London

3-month moving average daily rate quoted in jobs citing Azure DevOps in London.

Daily rate trend for Azure DevOps in London

Azure DevOps
Daily Rate Histogram in London

Daily rate distribution for jobs citing Azure DevOps in London over the 6 months to 11 January 2025.

Daily rate histogram for Azure DevOps in London

Azure DevOps
Contractor Hourly Rate Trend in London

3-month moving average hourly rates quoted in jobs citing Azure DevOps in London.

Hourly rate trend for Azure DevOps in London

Azure DevOps
Contract Job Locations in London

The table below looks at the demand and provides a guide to the median contractor rates quoted in IT jobs citing Azure DevOps within the London region over the 6 months to 11 January 2025. The 'Rank Change' column provides an indication of the change in demand within each location based on the same 6 month period last year.

Location Rank Change
on Same Period
Last Year
Matching
Contract
IT Job Ads
Median
Daily Rate
Past 6 Months
Median Daily Rate
% Change
on Same Period
Last Year
Live
Jobs
Central London +4 76 £558 -3.04% 21
West London +20 8 £475 -18.10% 3
East London +19 8 £498 -5.24% 5
South London +5 7 £380 -30.91% 1
Azure DevOps
England

Azure DevOps
Co-occurring Skills and Capabilities in London by Category

The follow tables expand on the table above by listing co-occurrences grouped by category. The same employment type, locality and period is covered with up to 20 co-occurrences shown in each of the following categories:

Application Platforms
1 13 (2.86%) Apache Spark
2 6 (1.32%) Apache
2 6 (1.32%) Confluence
2 6 (1.32%) SharePoint
3 4 (0.88%) Apache Airflow
3 4 (0.88%) IIS
4 2 (0.44%) BizTalk Server
4 2 (0.44%) nginx
5 1 (0.22%) Apache Solr
5 1 (0.22%) CMS
5 1 (0.22%) Drupal
5 1 (0.22%) Luigi
5 1 (0.22%) Microsoft Exchange
5 1 (0.22%) Sitecore CMS
5 1 (0.22%) Tomcat
Applications
1 5 (1.10%) Microsoft Project
2 3 (0.66%) Microsoft Office
2 3 (0.66%) MS Visio
3 1 (0.22%) Microsoft Excel
3 1 (0.22%) Microsoft PowerPoint
Business Applications
1 25 (5.49%) Dynamics CRM
2 5 (1.10%) Aladdin
3 2 (0.44%) Kondor
3 2 (0.44%) SAP S/4HANA
4 1 (0.22%) Elite 3E
4 1 (0.22%) Salesforce CRM
4 1 (0.22%) SAP BPC
4 1 (0.22%) SAP Hybris
4 1 (0.22%) SAP Oil and Gas
Cloud Services
1 455 (100.00%) Azure
2 62 (13.63%) Power Platform
3 61 (13.41%) GitHub
4 55 (12.09%) Dynamics 365
5 45 (9.89%) Serverless
6 41 (9.01%) Azure Monitor
7 37 (8.13%) Azure Functions
8 34 (7.47%) Azure AKS
8 34 (7.47%) GitHub Actions
9 32 (7.03%) AWS
9 32 (7.03%) Azure Cosmos DB
10 31 (6.81%) Azure Logic Apps
10 31 (6.81%) PaaS
11 28 (6.15%) Power Automate
12 25 (5.49%) Azure Data Factory
13 24 (5.27%) Azure Key Vault
14 22 (4.84%) Azure Service Bus
14 22 (4.84%) IaaS
15 17 (3.74%) Entra ID
15 17 (3.74%) PowerApps
Communications & Networking
1 20 (4.40%) Firewall
2 13 (2.86%) DNS
3 11 (2.42%) Network Security
4 8 (1.76%) TCP/IP
5 6 (1.32%) SSL
5 6 (1.32%) VPN
6 5 (1.10%) WAN
7 4 (0.88%) DHCP
8 3 (0.66%) HTTP
8 3 (0.66%) Internet
9 2 (0.44%) BGP
9 2 (0.44%) FTP
9 2 (0.44%) IPsec
9 2 (0.44%) MPLS
10 1 (0.22%) Cisco ISE
10 1 (0.22%) HTTPS
10 1 (0.22%) RTP
10 1 (0.22%) SMTP
10 1 (0.22%) X.400
Database & Business Intelligence
1 39 (8.57%) SQL Server
2 37 (8.13%) Power BI
3 32 (7.03%) Azure SQL Database
4 13 (2.86%) Big Data
5 12 (2.64%) Data Lake
6 11 (2.42%) NoSQL
6 11 (2.42%) PostgreSQL
7 9 (1.98%) Data Warehouse
7 9 (1.98%) Relational Database
8 7 (1.54%) Redis
9 6 (1.32%) MongoDB
10 5 (1.10%) MySQL
10 5 (1.10%) SQL Server Integration Services
11 4 (0.88%) Apache Hive
11 4 (0.88%) Metadata
12 3 (0.66%) Data Hub
12 3 (0.66%) Snowflake Schema
12 3 (0.66%) Spark SQL
12 3 (0.66%) Star Schema
13 2 (0.44%) OLAP
Development Applications
1 98 (21.54%) Git
2 35 (7.69%) Android Studio
3 27 (5.93%) GitLab
4 23 (5.05%) Jenkins
5 21 (4.62%) JIRA
6 9 (1.98%) Selenium
6 9 (1.98%) SpecFlow
7 8 (1.76%) Cucumber
7 8 (1.76%) SonarQube
8 7 (1.54%) TeamCity
9 6 (1.32%) Bitbucket
9 6 (1.32%) Octopus Deploy
9 6 (1.32%) Team Foundation Server
10 5 (1.10%) CircleCI
10 5 (1.10%) eggPlant
10 5 (1.10%) MLflow
10 5 (1.10%) Visual Studio
11 4 (0.88%) Ant
11 4 (0.88%) JMeter
11 4 (0.88%) NUnit
General
1 115 (25.27%) Social Skills
2 85 (18.68%) Finance
3 74 (16.26%) Public Sector
4 32 (7.03%) Analytical Skills
5 23 (5.05%) Presentation Skills
6 20 (4.40%) Banking
7 18 (3.96%) Back Office
8 15 (3.30%) Marketing
9 12 (2.64%) Telecoms
10 8 (1.76%) Local Government
10 8 (1.76%) Manufacturing
11 7 (1.54%) Electronics
11 7 (1.54%) Front Office
11 7 (1.54%) Inclusion and Diversity
11 7 (1.54%) Influencing Skills
11 7 (1.54%) Investment Banking
11 7 (1.54%) Legal
12 6 (1.32%) Organisational Skills
12 6 (1.32%) Retail
13 4 (0.88%) Law
Job Titles
1 127 (27.91%) Developer
2 84 (18.46%) Azure Engineer
3 70 (15.38%) DevOps Engineer
4 54 (11.87%) Senior
5 50 (10.99%) Azure DevOps Engineer
6 43 (9.45%) Lead
7 35 (7.69%) Android Developer
8 34 (7.47%) Architect
9 27 (5.93%) .NET Developer
10 26 (5.71%) Senior Developer
11 21 (4.62%) Data Engineer
12 20 (4.40%) Technical Leader
13 18 (3.96%) Platform Engineer
14 16 (3.52%) Azure Developer
14 16 (3.52%) C# Developer
14 16 (3.52%) Scrum Master
14 16 (3.52%) Senior Android Developer
15 15 (3.30%) Azure Architect
15 15 (3.30%) Cloud Platform Engineer
16 13 (2.86%) Analyst
Libraries, Frameworks & Software Standards
1 115 (25.27%) .NET
2 39 (8.57%) XML
3 36 (7.91%) .NET Core
4 35 (7.69%) Android Jetpack
4 35 (7.69%) Jetpack Compose
5 30 (6.59%) YAML
6 26 (5.71%) .NET Framework
7 25 (5.49%) AngularJS
8 21 (4.62%) Kafka
8 21 (4.62%) REST
9 20 (4.40%) ASP.NET
10 19 (4.18%) React
11 18 (3.96%) ARM Templates
12 15 (3.30%) CSS
12 15 (3.30%) RESTful
13 14 (3.08%) ADO
13 14 (3.08%) HTML
13 14 (3.08%) PySpark
14 10 (2.20%) Entity Framework
15 8 (1.76%) Node.js
Miscellaneous
1 51 (11.21%) Product Ownership
2 36 (7.91%) Mobile App
3 15 (3.30%) Cloud Native
4 11 (2.42%) Derivative
4 11 (2.42%) Greenfield Project
5 9 (1.98%) Enterprise Software
5 9 (1.98%) Public Cloud
6 6 (1.32%) Data Centre
7 5 (1.10%) Algorithms
7 5 (1.10%) Fixed Income
7 5 (1.10%) Hybrid Cloud
7 5 (1.10%) Linux Command Line
8 4 (0.88%) Data Structures
8 4 (0.88%) Market Risk
8 4 (0.88%) Reinsurance
8 4 (0.88%) Renewable Energy
8 4 (0.88%) Solar Panel
8 4 (0.88%) Sports Betting
9 3 (0.66%) Legacy Systems
9 3 (0.66%) Security Posture
Operating Systems
1 35 (7.69%) Android
2 26 (5.71%) Linux
3 12 (2.64%) Windows
4 4 (0.88%) Red Hat Enterprise Linux
4 4 (0.88%) Windows Server
5 3 (0.66%) VMS
6 1 (0.22%) Windows 10
6 1 (0.22%) Windows 7
Processes & Methodologies
1 455 (100.00%) DevOps
2 226 (49.67%) CI/CD
3 193 (42.42%) Agile
4 90 (19.78%) Scrum
5 79 (17.36%) Problem-Solving
6 74 (16.26%) Analytics
7 66 (14.51%) Infrastructure as Code
8 62 (13.63%) Test Automation
9 47 (10.33%) Business Intelligence
9 47 (10.33%) Design Patterns
10 40 (8.79%) Project Management
11 37 (8.13%) Continuous Improvement
12 36 (7.91%) SDLC
12 36 (7.91%) TDD
13 35 (7.69%) MVVM
13 35 (7.69%) User Experience
14 31 (6.81%) Android Development
15 29 (6.37%) Containerisation
15 29 (6.37%) Microservices
16 28 (6.15%) CRM
Programming Languages
1 110 (24.18%) C#
2 106 (23.30%) SQL
3 91 (20.00%) Python
4 79 (17.36%) PowerShell
5 51 (11.21%) JavaScript
6 36 (7.91%) Java
7 35 (7.69%) Kotlin
8 32 (7.03%) Bicep
9 27 (5.93%) Bash
10 8 (1.76%) T-SQL
10 8 (1.76%) TypeScript
11 6 (1.32%) Ruby
12 5 (1.10%) Apex Code
12 5 (1.10%) Scala
13 3 (0.66%) C++
13 3 (0.66%) Rust
13 3 (0.66%) VB.NET
14 2 (0.44%) Cypher
14 2 (0.44%) Kusto Query Language
14 2 (0.44%) PHP
Qualifications
1 73 (16.04%) Security Cleared
2 57 (12.53%) SC Cleared
3 38 (8.35%) Degree
4 24 (5.27%) Azure Certification
5 13 (2.86%) Computer Science Degree
6 8 (1.76%) DV Cleared
6 8 (1.76%) Microsoft Certification
7 4 (0.88%) Master's Degree
7 4 (0.88%) Numerate Degree
8 3 (0.66%) BPSS Clearance
9 2 (0.44%) PMI Certification
9 2 (0.44%) PMP
9 2 (0.44%) PRINCE2 Certification
10 1 (0.22%) AWS Certification
10 1 (0.22%) CISM
10 1 (0.22%) CISSP
Quality Assurance & Compliance
1 15 (3.30%) QA
2 13 (2.86%) Data Quality
3 12 (2.64%) PCI DSS
4 10 (2.20%) Accessibility
5 6 (1.32%) GDPR
6 4 (0.88%) ISO/IEC 27001
7 3 (0.66%) PMO
8 2 (0.44%) WCAG
9 1 (0.22%) ISO 20022
9 1 (0.22%) ISO/IEC 27002 (supersedes ISO/IEC 17799)
9 1 (0.22%) NCSC
System Software
1 54 (11.87%) Docker
2 18 (3.96%) Active Directory
3 16 (3.52%) Virtual Machines
4 3 (0.66%) VMware Infrastructure
5 1 (0.22%) Microsoft Virtual Server
5 1 (0.22%) Virtual Servers
Systems Management
1 98 (21.54%) Terraform
2 81 (17.80%) Kubernetes
3 19 (4.18%) Ansible
4 6 (1.32%) Prometheus
5 5 (1.10%) Puppet
5 5 (1.10%) Single Sign-On
6 4 (0.88%) Active Directory Federation Services
6 4 (0.88%) Packer
7 3 (0.66%) Grafana
7 3 (0.66%) Kibana
7 3 (0.66%) Nagios
8 2 (0.44%) Istio
8 2 (0.44%) Microsoft Intune
8 2 (0.44%) Progress Chef
8 2 (0.44%) SCCM
9 1 (0.22%) Argo
9 1 (0.22%) FortiGate
9 1 (0.22%) ITRS Geneos
9 1 (0.22%) Salt
9 1 (0.22%) ZABBIX
Vendors
1 139 (30.55%) Microsoft
2 34 (7.47%) Databricks
3 12 (2.64%) SAP
4 11 (2.42%) Salesforce
5 10 (2.20%) Google
5 10 (2.20%) Oracle
6 8 (1.76%) VMware
7 7 (1.54%) ServiceNow
8 6 (1.32%) Cloudera
9 5 (1.10%) Atlassian
9 5 (1.10%) Murex
10 4 (0.88%) Keysight
10 4 (0.88%) MuleSoft
10 4 (0.88%) Splunk
11 3 (0.66%) Cisco
11 3 (0.66%) Commvault
11 3 (0.66%) Red Hat
12 2 (0.44%) Calypso
12 2 (0.44%) CheckPoint
12 2 (0.44%) Informatica