Mentoring Contracts in London

Mentorship
England > London

The table below provides summary statistics for contract job vacancies advertised in London requiring Mentoring skills. It includes a benchmarking guide to the contractor rates offered in vacancies that cited Mentoring over the 6 months leading up to 14 August 2025, comparing them to the same period in the previous two years.

6 months to
14 Aug 2025
Same period 2024 Same period 2023
Rank 74 94 83
Rank change year-on-year +20 -11 +21
Contract jobs citing Mentoring 485 448 680
As % of all contract jobs advertised in London 3.59% 2.76% 2.88%
As % of the Processes & Methodologies category 3.88% 3.11% 3.17%
Number of daily rates quoted 331 302 415
10th Percentile £380 £413 £413
25th Percentile £450 £500 £505
Median daily rate (50th Percentile) £537 £575 £625
Median % change year-on-year -6.61% -8.00% -
75th Percentile £650 £688 £731
90th Percentile £738 £875 £830
England median daily rate £520 £550 £575
% change year-on-year -5.45% -4.35% -4.17%
Number of hourly rates quoted 5 2 6
10th Percentile £30.37 £48.25 £50.00
25th Percentile £46.25 £51.25 £66.25
Median hourly rate £55.00 £57.50 £72.50
Median % change year-on-year -4.35% -20.69% +38.10%
75th Percentile £78.75 £63.75 £79.38
90th Percentile £91.50 £66.75 £85.00
England median hourly rate £72.50 £57.44 £57.33
% change year-on-year +26.22% +0.19% +14.66%

All Process and Methodology Skills
London

Mentoring falls under the Processes and Methodologies category. For comparison with the information above, the following table provides summary statistics for all contract job vacancies requiring process or methodology skills in London.

Contract vacancies with a requirement for process or methodology skills 12,490 14,392 21,431
As % of all contract IT jobs advertised in London 92.33% 88.79% 90.65%
Number of daily rates quoted 8,321 10,076 15,575
10th Percentile £325 £350 £363
25th Percentile £425 £450 £463
Median daily rate (50th Percentile) £540 £550 £575
Median % change year-on-year -1.82% -4.35% -
75th Percentile £675 £688 £700
90th Percentile £778 £800 £800
England median daily rate £513 £525 £550
% change year-on-year -2.38% -4.55% -
Number of hourly rates quoted 250 201 228
10th Percentile £16.50 £17.08 £18.00
25th Percentile £24.66 £22.00 £23.35
Median hourly rate £29.50 £35.71 £40.25
Median % change year-on-year -17.39% -11.28% +8.46%
75th Percentile £49.31 £53.75 £65.00
90th Percentile £63.75 £71.25 £82.33
England median hourly rate £25.15 £43.00 £41.50
% change year-on-year -41.51% +3.61% +56.60%

Mentoring
Job Vacancy Trend in London

Job postings citing Mentoring as a proportion of all IT jobs advertised in London.
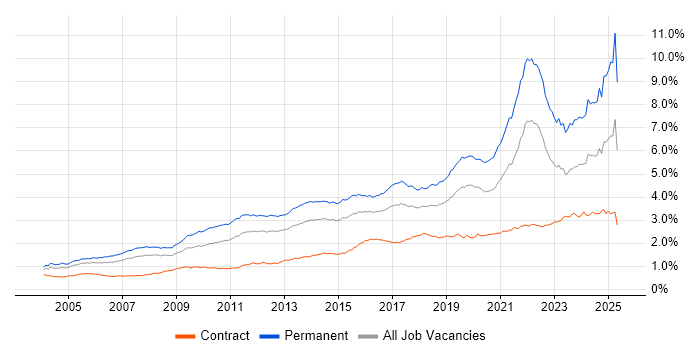
Job vacancy trend for Mentoring in London

Mentoring
Contractor Daily Rate Trend in London

3-month moving average daily rate quoted in jobs citing Mentoring in London.

Daily rate trend for Mentoring in London

Mentoring
Daily Rate Histogram in London

Daily rate distribution for jobs citing Mentoring in London over the 6 months to 14 August 2025.

Daily rate histogram for Mentoring in London

Mentoring
Contractor Hourly Rate Trend in London

3-month moving average hourly rates quoted in jobs citing Mentoring in London.

Hourly rate trend for Mentoring in London

Mentoring
Hourly Rate Histogram in London

Hourly rate distribution of jobs citing Mentoring in London over the 6 months to 14 August 2025.

Hourly rate histogram for Mentoring in London

Mentoring
Contract Job Locations in London

The table below looks at the demand and provides a guide to the median contractor rates quoted in IT jobs citing Mentoring within the London region over the 6 months to 14 August 2025. The 'Rank Change' column provides an indication of the change in demand within each location based on the same 6 month period last year.

Location Rank Change
on Same Period
Last Year
Matching
Contract
IT Job Ads
Median
Daily Rate
Past 6 Months
Median Daily Rate
% Change
on Same Period
Last Year
Live
Jobs
Central London +12 75 £644 +9.15% 202
West London +11 22 £475 -20.83% 55
South London -1 5 £474 -5.25% 34
East London +7 1 £513 -5.09% 40
North London - 1 £550 - 12
Mentoring
England

Mentoring
Co-occurring Skills and Capabilities in London by Category

The follow tables expand on the table above by listing co-occurrences grouped by category. The same employment type, locality and period is covered with up to 20 co-occurrences shown in each of the following categories:

Application Platforms
1 16 (3.30%) Apache
2 13 (2.68%) Apache Spark
2 13 (2.68%) CMS
3 10 (2.06%) Apache Airflow
3 10 (2.06%) SharePoint
4 8 (1.65%) Confluence
5 7 (1.44%) Microsoft Exchange
6 5 (1.03%) Headless CMS
7 3 (0.62%) Camunda
7 3 (0.62%) Drupal
7 3 (0.62%) SAS
8 2 (0.41%) Adobe Experience Manager
8 2 (0.41%) Apache Solr
9 1 (0.21%) Alfresco
9 1 (0.21%) CICS
9 1 (0.21%) JBoss
9 1 (0.21%) Oracle Service Bus
9 1 (0.21%) Oracle SOA Suite
9 1 (0.21%) Oracle Workflow
9 1 (0.21%) WordPress
Applications
1 3 (0.62%) Microsoft Excel
2 2 (0.41%) Chatbot
3 1 (0.21%) Adobe After Effects
3 1 (0.21%) Adobe Premiere
3 1 (0.21%) DaVinci Resolve
3 1 (0.21%) Final Cut Pro
3 1 (0.21%) Microsoft Office
3 1 (0.21%) Microsoft PowerPoint
3 1 (0.21%) Microsoft Project
3 1 (0.21%) MS Visio
Business Applications
1 5 (1.03%) Shopify
2 4 (0.82%) Magento
3 3 (0.62%) Dynamics CRM
3 3 (0.62%) SAP HCM
4 2 (0.41%) Actimize
4 2 (0.41%) Endur
4 2 (0.41%) Oracle Financials
4 2 (0.41%) Temenos T24
5 1 (0.21%) Dynamics AX
5 1 (0.21%) iTrent
5 1 (0.21%) Maximo
5 1 (0.21%) Oracle EBS
5 1 (0.21%) Oracle Procure-to-Pay
5 1 (0.21%) ResourceLink
5 1 (0.21%) SAP Hybris
5 1 (0.21%) SAP PP
5 1 (0.21%) SAP S/4HANA
5 1 (0.21%) SAP SCM
Cloud Services
1 155 (31.96%) AWS
2 132 (27.22%) Azure
3 46 (9.48%) Serverless
4 42 (8.66%) AWS Lambda
5 39 (8.04%) GCP
6 38 (7.84%) Amazon S3
7 32 (6.60%) GitHub
8 26 (5.36%) Power Platform
9 25 (5.15%) AWS CloudFormation
10 21 (4.33%) Microsoft 365
11 20 (4.12%) GitHub Actions
12 19 (3.92%) AWS Step Functions
12 19 (3.92%) Azure DevOps
13 18 (3.71%) Azure Data Factory
14 16 (3.30%) Entra ID
15 15 (3.09%) Amazon ECS
16 13 (2.68%) Amazon CloudWatch
16 13 (2.68%) Snowflake
17 12 (2.47%) Amazon Cognito
17 12 (2.47%) Amazon SQS
Communications & Networking
1 17 (3.51%) Firewall
2 13 (2.68%) VPN
2 13 (2.68%) WAN
3 12 (2.47%) DNS
4 11 (2.27%) LAN
4 11 (2.27%) TCP/IP
5 10 (2.06%) DHCP
5 10 (2.06%) Network Security
6 7 (1.44%) Wireless
7 6 (1.24%) 4G
8 5 (1.03%) HTTP
8 5 (1.03%) HTTPS
9 4 (0.82%) BGP
9 4 (0.82%) OSPF
10 3 (0.62%) Bluetooth
10 3 (0.62%) Ethernet VPN
10 3 (0.62%) Internet
10 3 (0.62%) MPLS
10 3 (0.62%) VXLAN
10 3 (0.62%) Wi-Fi
Database & Business Intelligence
1 31 (6.39%) PostgreSQL
2 29 (5.98%) DynamoDB
3 18 (3.71%) Amazon RDS
3 18 (3.71%) Data Warehouse
3 18 (3.71%) Power BI
4 16 (3.30%) Redis
5 15 (3.09%) SQL Server
6 13 (2.68%) MongoDB
7 12 (2.47%) MySQL
8 9 (1.86%) Big Data
8 9 (1.86%) Oracle Database
9 8 (1.65%) BigQuery
9 8 (1.65%) Data Lake
10 7 (1.44%) Amazon Redshift
11 5 (1.03%) Amazon Athena
12 4 (0.82%) GIS
12 4 (0.82%) SQL Server Integration Services
12 4 (0.82%) Tableau
13 3 (0.62%) Hadoop
13 3 (0.62%) Pentaho
Development Applications
1 57 (11.75%) Git
2 30 (6.19%) Jenkins
3 28 (5.77%) JIRA
4 20 (4.12%) GitLab
5 12 (2.47%) JUnit
5 12 (2.47%) Maven
6 11 (2.27%) Cypress.io
6 11 (2.27%) SonarQube
7 9 (1.86%) Mockito
7 9 (1.86%) REST Assured
8 7 (1.44%) Postman
9 6 (1.24%) Atlassian Bamboo
9 6 (1.24%) CircleCI
9 6 (1.24%) SoapUI
9 6 (1.24%) Subversion
9 6 (1.24%) Xcode
9 6 (1.24%) XCTest
10 4 (0.82%) Bitbucket
10 4 (0.82%) Selenium
11 3 (0.62%) Gradle
General
1 157 (32.37%) Social Skills
2 99 (20.41%) Finance
3 68 (14.02%) Analytical Skills
4 56 (11.55%) Public Sector
5 42 (8.66%) Banking
6 16 (3.30%) Marketing
7 14 (2.89%) Telecoms
8 12 (2.47%) Inclusion and Diversity
9 10 (2.06%) Back Office
10 9 (1.86%) Investment Banking
10 9 (1.86%) Law
10 9 (1.86%) Presentation Skills
11 7 (1.44%) Publishing
12 6 (1.24%) Influencing Skills
12 6 (1.24%) Manufacturing
12 6 (1.24%) Retail
13 5 (1.03%) Financial Institution
13 5 (1.03%) Legal
13 5 (1.03%) Organisational Skills
14 4 (0.82%) Electronics
Job Titles
1 127 (26.19%) Senior
2 96 (19.79%) Developer
3 79 (16.29%) Lead
4 65 (13.40%) Architect
5 31 (6.39%) Senior Developer
6 28 (5.77%) Data Engineer
7 24 (4.95%) AWS Engineer
7 24 (4.95%) Software Engineer
8 21 (4.33%) Consultant
9 20 (4.12%) Analyst
10 18 (3.71%) Designer
10 18 (3.71%) Solutions Architect
11 16 (3.30%) Node.js Developer
12 15 (3.09%) Technical Architect
13 14 (2.89%) Technical Leader
14 13 (2.68%) Python Engineer
15 12 (2.47%) Azure Engineer
15 12 (2.47%) Cloud Engineer
15 12 (2.47%) Platform Engineer
15 12 (2.47%) Senior Software Engineer
Libraries, Frameworks & Software Standards
1 46 (9.48%) Node.js
2 45 (9.28%) React
3 34 (7.01%) Kafka
4 32 (6.60%) HTML
5 30 (6.19%) REST
6 28 (5.77%) GraphQL
7 27 (5.57%) CSS
8 23 (4.74%) AngularJS
9 21 (4.33%) RESTful
9 21 (4.33%) Spring Boot
10 20 (4.12%) OAuth
10 20 (4.12%) Spring
11 19 (3.92%) .NET
11 19 (3.92%) Web Services
12 17 (3.51%) Redux
13 16 (3.30%) SOAP
14 14 (2.89%) OpenID
15 12 (2.47%) Hibernate
15 12 (2.47%) HTML5
16 11 (2.27%) SAML
Miscellaneous
1 38 (7.84%) Cloud Native
2 35 (7.22%) Product Ownership
3 19 (3.92%) Distributed Systems
4 17 (3.51%) Mobile App
4 17 (3.51%) Public Cloud
5 12 (2.47%) Data Centre
5 12 (2.47%) Data Protection Act
5 12 (2.47%) PKI
5 12 (2.47%) Self-Motivation
6 11 (2.27%) Management Information System
7 9 (1.86%) Algorithms
7 9 (1.86%) Data Structures
7 9 (1.86%) Hybrid Cloud
8 8 (1.65%) Analytical Mindset
9 7 (1.44%) Greenfield Project
9 7 (1.44%) Security Posture
9 7 (1.44%) Virtual Team
10 6 (1.24%) Legacy Applications
10 6 (1.24%) Security Operations Centre
11 5 (1.03%) Foreign Exchange (FX)
Operating Systems
1 24 (4.95%) Linux
2 21 (4.33%) Windows
3 11 (2.27%) Android
4 10 (2.06%) Unix
5 8 (1.65%) Apple iOS
6 7 (1.44%) Windows Server
7 2 (0.41%) CentOS
8 1 (0.21%) Mac OS
8 1 (0.21%) VMS
8 1 (0.21%) Windows 10
Processes & Methodologies
1 188 (38.76%) Agile
2 121 (24.95%) Problem-Solving
3 119 (24.54%) CI/CD
4 115 (23.71%) DevOps
5 75 (15.46%) Coaching
5 75 (15.46%) Technical Leadership
6 73 (15.05%) Software Engineering
7 66 (13.61%) Infrastructure as Code
8 54 (11.13%) Continuous Improvement
8 54 (11.13%) Microservices
9 53 (10.93%) Scrum
10 50 (10.31%) Analytics
10 50 (10.31%) Roadmaps
11 48 (9.90%) Stakeholder Management
12 46 (9.48%) Containerisation
13 45 (9.28%) Test Automation
14 44 (9.07%) User Experience
15 38 (7.84%) Clean Code
15 38 (7.84%) Computer Science
15 38 (7.84%) Performance Optimisation
Programming Languages
1 121 (24.95%) Python
2 99 (20.41%) Java
3 82 (16.91%) JavaScript
4 70 (14.43%) SQL
5 50 (10.31%) TypeScript
6 21 (4.33%) C#
7 20 (4.12%) C++
7 20 (4.12%) Go
8 13 (2.68%) Bash
9 12 (2.47%) PowerShell
10 10 (2.06%) Apex Code
11 9 (1.86%) Kotlin
12 8 (1.65%) Groovy
13 7 (1.44%) Scala
14 6 (1.24%) PHP
14 6 (1.24%) Shell Script
15 3 (0.62%) COBOL
15 3 (0.62%) R
15 3 (0.62%) SOQL
15 3 (0.62%) T-SQL
Qualifications
1 88 (18.14%) Security Cleared
2 68 (14.02%) SC Cleared
3 57 (11.75%) Degree
4 34 (7.01%) Computer Science Degree
5 29 (5.98%) AWS Certification
6 20 (4.12%) DV Cleared
7 11 (2.27%) Master's Degree
8 10 (2.06%) Azure Certification
9 9 (1.86%) AWS Certified Solutions Architect
10 8 (1.65%) PMI Certification
11 5 (1.03%) CCNA
11 5 (1.03%) CCNP
11 5 (1.03%) Cisco Certification
11 5 (1.03%) OCP
11 5 (1.03%) Oracle Certification
11 5 (1.03%) PMP
12 3 (0.62%) AWS Certified DevOps Engineer
12 3 (0.62%) BPSS Clearance
12 3 (0.62%) Microsoft Certification
13 2 (0.41%) CSPO
Quality Assurance & Compliance
1 26 (5.36%) QA
2 21 (4.33%) Data Quality
3 16 (3.30%) GDPR
3 16 (3.30%) NIST
4 15 (3.09%) Accessibility
5 9 (1.86%) ISO/IEC 27001
6 6 (1.24%) SLA
7 5 (1.03%) ISO/IEC 27002 (supersedes ISO/IEC 17799)
7 5 (1.03%) Sarbanes-Oxley
8 4 (0.82%) PMO
9 3 (0.62%) Cyber Essentials
9 3 (0.62%) Cyber Essentials PLUS
9 3 (0.62%) GRC
9 3 (0.62%) HIPAA
9 3 (0.62%) NCSC
9 3 (0.62%) WCAG
10 2 (0.41%) DICOM
10 2 (0.41%) HL7
10 2 (0.41%) IFRS
10 2 (0.41%) MiFID
System Software
1 52 (10.72%) Docker
2 16 (3.30%) Active Directory
3 4 (0.82%) zsh
4 3 (0.62%) Virtual Machines
5 2 (0.41%) Apache ZooKeeper
5 2 (0.41%) Hyper-V
5 2 (0.41%) VMware Infrastructure
6 1 (0.21%) OpenAM
6 1 (0.21%) OpenDJ
6 1 (0.21%) OpenIDM
6 1 (0.21%) Virtual Servers
6 1 (0.21%) vSphere
Systems Management
1 66 (13.61%) Kubernetes
1 66 (13.61%) Terraform
2 18 (3.71%) Ansible
3 14 (2.89%) Prometheus
4 9 (1.86%) Grafana
4 9 (1.86%) Microsoft Intune
5 7 (1.44%) FortiGate
6 6 (1.24%) Puppet
7 5 (1.03%) SCCM
7 5 (1.03%) Single Sign-On
8 4 (0.82%) Kibana
9 3 (0.62%) Argo
10 2 (0.41%) Istio
10 2 (0.41%) Progress Chef
11 1 (0.21%) Control-M
11 1 (0.21%) Docker Swarm
11 1 (0.21%) HAProxy
11 1 (0.21%) Packer
11 1 (0.21%) QRadar
11 1 (0.21%) Rancher
Vendors
1 62 (12.78%) Microsoft
2 28 (5.77%) Oracle
3 25 (5.15%) Google
4 19 (3.92%) Salesforce
5 18 (3.71%) SAP
6 15 (3.09%) Databricks
7 14 (2.89%) Splunk
8 12 (2.47%) ServiceNow
9 8 (1.65%) Adobe
9 8 (1.65%) IBM
10 7 (1.44%) ForgeRock
11 6 (1.24%) CA Agile Central
11 6 (1.24%) Cisco
11 6 (1.24%) Dynatrace
12 5 (1.03%) Sitecore
13 4 (0.82%) Informatica
13 4 (0.82%) MuleSoft
13 4 (0.82%) Palantir
13 4 (0.82%) Palo Alto
13 4 (0.82%) VMware