Performance Tuning Contracts in London

Performance Tuning
England > London

The table below provides summary statistics for contract job vacancies advertised in London requiring Performance Tuning skills. It includes a benchmarking guide to the contractor rates offered in vacancies that cited Performance Tuning over the 6 months leading up to 29 May 2025, comparing them to the same period in the previous two years.

6 months to
29 May 2025
Same period 2024 Same period 2023
Rank 146 259 239
Rank change year-on-year +113 -20 +29
Contract jobs citing Performance Tuning 226 139 259
As % of all contract jobs advertised in London 1.86% 0.80% 1.02%
As % of the Processes & Methodologies category 2.02% 0.90% 1.12%
Number of daily rates quoted 145 91 151
10th Percentile £403 £340 £413
25th Percentile £450 £413 £463
Median daily rate (50th Percentile) £550 £525 £575
Median % change year-on-year +4.76% -8.70% -17.86%
75th Percentile £656 £694 £738
90th Percentile £775 £838 £800
England median daily rate £500 £510 £525
% change year-on-year -1.96% -2.86% -12.50%
Number of hourly rates quoted 0 1 0
Median hourly rate - £48.50 -
England median hourly rate £70.00 £61.60 £72.50
% change year-on-year +13.64% -15.03% +61.11%

All Process and Methodology Skills
London

Performance Tuning falls under the Processes and Methodologies category. For comparison with the information above, the following table provides summary statistics for all contract job vacancies requiring process or methodology skills in London.

Contract vacancies with a requirement for process or methodology skills 11,178 15,459 23,168
As % of all contract IT jobs advertised in London 92.22% 88.48% 90.85%
Number of daily rates quoted 7,507 11,105 16,762
10th Percentile £350 £340 £375
25th Percentile £431 £450 £475
Median daily rate (50th Percentile) £550 £550 £590
Median % change year-on-year - -6.78% +2.61%
75th Percentile £688 £675 £700
90th Percentile £800 £800 £800
England median daily rate £525 £525 £550
% change year-on-year - -4.55% +1.85%
Number of hourly rates quoted 187 316 266
10th Percentile £16.50 £15.72 £18.25
25th Percentile £23.78 £20.00 £22.50
Median hourly rate £30.81 £28.00 £39.63
Median % change year-on-year +10.02% -29.34% +12.29%
75th Percentile £49.75 £48.75 £64.50
90th Percentile £63.10 £66.88 £82.50
England median hourly rate £28.00 £37.18 £37.32
% change year-on-year -24.69% -0.38% +49.28%

Performance Tuning
Job Vacancy Trend in London

Job postings citing Performance Tuning as a proportion of all IT jobs advertised in London.
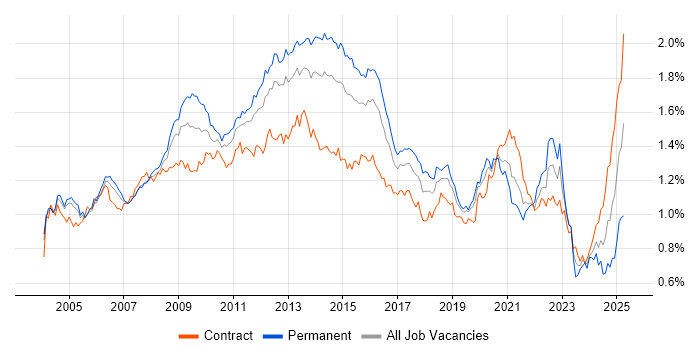
Job vacancy trend for Performance Tuning in London

Performance Tuning
Contractor Daily Rate Trend in London

3-month moving average daily rate quoted in jobs citing Performance Tuning in London.

Daily rate trend for Performance Tuning in London

Performance Tuning
Daily Rate Histogram in London

Daily rate distribution for jobs citing Performance Tuning in London over the 6 months to 29 May 2025.

Daily rate histogram for Performance Tuning in London

Performance Tuning
Contractor Hourly Rate Trend in London

3-month moving average hourly rates quoted in jobs citing Performance Tuning in London.

Hourly rate trend for Performance Tuning in London

Performance Tuning
Contract Job Locations in London

The table below looks at the demand and provides a guide to the median contractor rates quoted in IT jobs citing Performance Tuning within the London region over the 6 months to 29 May 2025. The 'Rank Change' column provides an indication of the change in demand within each location based on the same 6 month period last year.

Location Rank Change
on Same Period
Last Year
Matching
Contract
IT Job Ads
Median
Daily Rate
Past 6 Months
Median Daily Rate
% Change
on Same Period
Last Year
Live
Jobs
Central London +38 37 £525 -2.33% 23
West London - 6 £475 - 38
South London - 3 - -
East London +21 2 £625 +38.89% 5
Performance Tuning
England

Performance Tuning
Co-occurring Skills and Capabilities in London by Category

The follow tables expand on the table above by listing co-occurrences grouped by category. The same employment type, locality and period is covered with up to 20 co-occurrences shown in each of the following categories:

Application Platforms
1 14 (6.19%) Apache
2 13 (5.75%) Confluence
3 12 (5.31%) Apache Spark
4 11 (4.87%) Oracle Coherence
5 8 (3.54%) GemFire
6 3 (1.33%) SharePoint
7 2 (0.88%) Apache Airflow
7 2 (0.88%) IIS
7 2 (0.88%) MQSeries
7 2 (0.88%) NetWeaver
7 2 (0.88%) Oracle Workflow
8 1 (0.44%) JBoss
8 1 (0.44%) SAS
Applications
1 1 (0.44%) Microsoft Excel
Business Applications
1 8 (3.54%) Dynamics CRM
2 6 (2.65%) SAP S/4HANA
3 4 (1.77%) Aladdin
4 3 (1.33%) SAP SD
5 2 (0.88%) BASE24
5 2 (0.88%) SAP IBP
6 1 (0.44%) FastStats
6 1 (0.44%) Oracle Applications
6 1 (0.44%) Oracle ERP
6 1 (0.44%) SAP Convergent Charging
6 1 (0.44%) SAP CRM
6 1 (0.44%) SAP MDG
6 1 (0.44%) SAP Oil and Gas
6 1 (0.44%) SAP PLM
6 1 (0.44%) SAP VC
Cloud Services
1 49 (21.68%) AWS
2 48 (21.24%) Azure
3 23 (10.18%) Power Platform
4 22 (9.73%) GCP
5 11 (4.87%) GitHub
6 10 (4.42%) IaaS
6 10 (4.42%) Snowflake
7 8 (3.54%) Dynamics 365
7 8 (3.54%) Power Automate
7 8 (3.54%) Serverless
8 7 (3.10%) Azure Data Factory
8 7 (3.10%) GitHub Actions
8 7 (3.10%) PowerApps
9 6 (2.65%) Amazon CloudWatch
9 6 (2.65%) Amazon S3
10 4 (1.77%) AWS CloudFormation
10 4 (1.77%) AWS Lambda
10 4 (1.77%) Azure Functions
10 4 (1.77%) Azure Synapse Analytics
10 4 (1.77%) OCI
Communications & Networking
1 13 (5.75%) Network Security
2 11 (4.87%) Firewall
3 7 (3.10%) SSH
3 7 (3.10%) VPN
4 6 (2.65%) HTTPS
5 4 (1.77%) SNMP
5 4 (1.77%) SSL
6 3 (1.33%) DNS
6 3 (1.33%) HTTP
6 3 (1.33%) Kerberos
6 3 (1.33%) Remote Desktop
6 3 (1.33%) TCP/IP
6 3 (1.33%) Telnet
6 3 (1.33%) Wireshark
7 2 (0.88%) Multicast
7 2 (0.88%) NAS
7 2 (0.88%) NGFW
7 2 (0.88%) SAN
7 2 (0.88%) VLAN
7 2 (0.88%) VSAN
Database & Business Intelligence
1 35 (15.49%) Relational Database
2 34 (15.04%) SQL Server
3 20 (8.85%) Data Warehouse
4 19 (8.41%) MongoDB
5 17 (7.52%) Power BI
6 16 (7.08%) Oracle Database
7 14 (6.19%) DB2
8 12 (5.31%) Big Data
8 12 (5.31%) Snowflake Schema
9 10 (4.42%) Hadoop
10 9 (3.98%) PostgreSQL
11 8 (3.54%) RDBMS
12 7 (3.10%) Amazon RDS
12 7 (3.10%) Data Lake
12 7 (3.10%) SQL Server Reporting Services
13 6 (2.65%) Azure SQL Database
13 6 (2.65%) NoSQL
14 5 (2.21%) SAP HANA
14 5 (2.21%) Spotfire
14 5 (2.21%) Star Schema
Development Applications
1 20 (8.85%) Git
2 17 (7.52%) JIRA
3 16 (7.08%) Jenkins
4 14 (6.19%) GitLab
4 14 (6.19%) JUnit
5 10 (4.42%) ScriptRunner
6 5 (2.21%) TeamCity
7 4 (1.77%) Bitbucket
8 3 (1.33%) JMeter
8 3 (1.33%) Liquibase
8 3 (1.33%) LSMW
9 2 (0.88%) git-flow
9 2 (0.88%) IntelliJ
9 2 (0.88%) LoadRunner
9 2 (0.88%) Subversion
10 1 (0.44%) Eclipse
10 1 (0.44%) Maven
10 1 (0.44%) Mocha
10 1 (0.44%) Team Foundation Server
10 1 (0.44%) Toad
General
1 71 (31.42%) Social Skills
2 70 (30.97%) Finance
3 61 (26.99%) Analytical Skills
4 37 (16.37%) Banking
5 24 (10.62%) Investment Banking
6 10 (4.42%) Public Sector
7 7 (3.10%) Front Office
8 3 (1.33%) Documentation Skills
8 3 (1.33%) Financial Institution
8 3 (1.33%) Games
8 3 (1.33%) Military
8 3 (1.33%) Telecoms
9 2 (0.88%) Advertising
9 2 (0.88%) Legal
9 2 (0.88%) Local Government
9 2 (0.88%) Organisational Skills
9 2 (0.88%) Presentation Skills
10 1 (0.44%) French Language
10 1 (0.44%) General Ledger
10 1 (0.44%) Pharmaceutical
Job Titles
1 66 (29.20%) Developer
2 64 (28.32%) Senior
3 46 (20.35%) Java Developer
4 31 (13.72%) Senior Developer
5 29 (12.83%) Senior Java Developer
6 23 (10.18%) DBA
7 17 (7.52%) Architect
7 17 (7.52%) Investment Banking Java Developer
8 16 (7.08%) Data Engineer
9 15 (6.64%) Administrator
9 15 (6.64%) Consultant
9 15 (6.64%) SQL Developer
10 14 (6.19%) Linux Developer
10 14 (6.19%) Senior Investment Banking Java Developer
10 14 (6.19%) Senior SQL Developer
11 10 (4.42%) Oracle Developer
11 10 (4.42%) SQL DBA
12 9 (3.98%) Analyst
13 8 (3.54%) Oracle DBA
13 8 (3.54%) Senior Oracle Developer
Libraries, Frameworks & Software Standards
1 19 (8.41%) .NET
2 18 (7.96%) Kafka
3 16 (7.08%) Spring
4 14 (6.19%) JMS
4 14 (6.19%) XML
5 10 (4.42%) FIX Protocol
5 10 (4.42%) JSON
6 9 (3.98%) AngularJS
6 9 (3.98%) ASP.NET
7 8 (3.54%) CSS
7 8 (3.54%) HTML
7 8 (3.54%) Spark Streaming
8 6 (2.65%) ASP.NET Web API
8 6 (2.65%) Elastic Stack
8 6 (2.65%) REST
9 5 (2.21%) .NET Framework
9 5 (2.21%) HTML5 Canvas
9 5 (2.21%) Middleware
9 5 (2.21%) WCF
9 5 (2.21%) Web Services
Miscellaneous
1 20 (8.85%) Data Structures
2 16 (7.08%) Clustering
3 14 (6.19%) Equities
3 14 (6.19%) Foreign Exchange (FX)
4 12 (5.31%) Distributed Computing
4 12 (5.31%) Replication
5 9 (3.98%) Analytical Mindset
5 9 (3.98%) Distributed Systems
5 9 (3.98%) Legacy Systems
5 9 (3.98%) Market Risk
6 7 (3.10%) Data Protection Act
6 7 (3.10%) Hedge funds
6 7 (3.10%) Onboarding
7 6 (2.65%) Fixed Income
8 5 (2.21%) Greenfield Project
9 4 (1.77%) Distributed Architecture
9 4 (1.77%) Reference Data
9 4 (1.77%) Self-Motivation
10 3 (1.33%) Distributed Applications
10 3 (1.33%) Product Ownership
Operating Systems
1 42 (18.58%) Linux
2 12 (5.31%) Unix
2 12 (5.31%) Windows
3 7 (3.10%) Red Hat Enterprise Linux
4 3 (1.33%) Rocky
5 2 (0.88%) Windows Server
6 1 (0.44%) Android
6 1 (0.44%) Apple iOS
6 1 (0.44%) OpenVMS
6 1 (0.44%) Oracle Linux
6 1 (0.44%) Solaris
6 1 (0.44%) VMS
6 1 (0.44%) Windows Server 2019
Processes & Methodologies
1 69 (30.53%) Agile
2 66 (29.20%) Problem-Solving
3 52 (23.01%) Migration
4 41 (18.14%) DevOps
5 38 (16.81%) High Availability
6 35 (15.49%) CI/CD
7 32 (14.16%) Analytics
8 30 (13.27%) Database Tuning
8 30 (13.27%) ETL
9 29 (12.83%) Data Modelling
10 25 (11.06%) Data Pipeline
11 23 (10.18%) Disaster Recovery
11 23 (10.18%) Multithreading
12 21 (9.29%) Performance Optimisation
13 20 (8.85%) Business Intelligence
14 19 (8.41%) Infrastructure as Code
14 19 (8.41%) SDLC
15 17 (7.52%) Low Latency
15 17 (7.52%) Open Source
16 16 (7.08%) Validation
Programming Languages
1 100 (44.25%) SQL
2 64 (28.32%) Python
3 56 (24.78%) Java
4 19 (8.41%) Shell Script
5 12 (5.31%) C#
5 12 (5.31%) JavaScript
5 12 (5.31%) PowerShell
6 10 (4.42%) Groovy
6 10 (4.42%) PL/SQL
7 8 (3.54%) Bash
7 8 (3.54%) TypeScript
8 6 (2.65%) ActionScript
8 6 (2.65%) ActionScript 2.0
8 6 (2.65%) C++
9 5 (2.21%) ABAP
10 4 (1.77%) C
10 4 (1.77%) T-SQL
11 3 (1.33%) Data Analysis Expressions
11 3 (1.33%) Scala
12 2 (0.88%) Ruby
Qualifications
1 17 (7.52%) Degree
1 17 (7.52%) Security Cleared
2 13 (5.75%) SC Cleared
3 8 (3.54%) Numerate Degree
4 3 (1.33%) Computer Science Degree
5 2 (0.88%) AWS Certification
5 2 (0.88%) Azure Certification
5 2 (0.88%) Cisco Certification
5 2 (0.88%) Master's Degree
6 1 (0.44%) CCIE
6 1 (0.44%) CCNA
6 1 (0.44%) CCNP
6 1 (0.44%) CCSE
6 1 (0.44%) Citrix Certification
6 1 (0.44%) IBM Certification
6 1 (0.44%) Microsoft Certification
6 1 (0.44%) OCP
6 1 (0.44%) Oracle Certification
6 1 (0.44%) PhD
6 1 (0.44%) RHCE
Quality Assurance & Compliance
1 9 (3.98%) SLA
2 7 (3.10%) Data Quality
2 7 (3.10%) GDPR
3 6 (2.65%) PCI DSS
4 5 (2.21%) Accessibility
4 5 (2.21%) QA
5 3 (1.33%) HIPAA
5 3 (1.33%) ISO/IEC 27001
6 2 (0.88%) Actionable Recommendations
6 2 (0.88%) Sarbanes-Oxley
7 1 (0.44%) Cyber Essentials
7 1 (0.44%) HL7
7 1 (0.44%) ISO 8583
7 1 (0.44%) NIST
7 1 (0.44%) SOC 2
System Software
1 20 (8.85%) Docker
2 8 (3.54%) GridGain
3 7 (3.10%) VMware Infrastructure
4 5 (2.21%) Oracle RAC
4 5 (2.21%) VMware ESXi
5 4 (1.77%) vSphere
6 3 (1.33%) Active Directory
6 3 (1.33%) FreeRADIUS
6 3 (1.33%) iptables
7 2 (0.88%) Virtual Desktop
7 2 (0.88%) Virtual Machines
7 2 (0.88%) VMware NSX
8 1 (0.44%) Citrix Hypervisor
8 1 (0.44%) Firmware
8 1 (0.44%) Hyper-V
8 1 (0.44%) Veritas Cluster Server
Systems Management
1 20 (8.85%) Ansible
1 20 (8.85%) Terraform
2 19 (8.41%) Kubernetes
3 8 (3.54%) Prometheus
3 8 (3.54%) Puppet
4 6 (2.65%) Grafana
5 5 (2.21%) Oracle Enterprise Manager
6 4 (1.77%) Nagios
6 4 (1.77%) Netcool
6 4 (1.77%) vCenter Server
7 3 (1.33%) Cacti
7 3 (1.33%) Oracle RMAN
7 3 (1.33%) Packer
7 3 (1.33%) Proxmox
7 3 (1.33%) ZABBIX
8 2 (0.88%) Data Guard
8 2 (0.88%) ITRS Geneos
8 2 (0.88%) logstash
8 2 (0.88%) Microsoft Intune
9 1 (0.44%) Kibana
Vendors
1 33 (14.60%) Oracle
2 23 (10.18%) Microsoft
3 19 (8.41%) Sybase
4 17 (7.52%) SAP
5 12 (5.31%) Databricks
6 11 (4.87%) VMware
7 10 (4.42%) Atlassian
8 9 (3.98%) IBM
9 8 (3.54%) Google
10 6 (2.65%) Cisco
10 6 (2.65%) IBM Sterling
10 6 (2.65%) ServiceNow
10 6 (2.65%) Splunk
11 5 (2.21%) Informatica
11 5 (2.21%) Teradata
12 3 (1.33%) Guidewire
12 3 (1.33%) Juniper
12 3 (1.33%) Nokia
12 3 (1.33%) Palo Alto
12 3 (1.33%) Talend