Business Analysis Jobs in England

Business Analysis
UK > England

The table below provides summary statistics for permanent job vacancies advertised in England requiring Business Analysis skills. It includes a benchmarking guide to the annual salaries offered in vacancies that cited Business Analysis over the 6 months leading up to 11 May 2025, comparing them to the same period in the previous two years.

6 months to
11 May 2025
Same period 2024 Same period 2023
Rank 209 191 166
Rank change year-on-year -18 -25 0
Permanent jobs citing Business Analysis 749 1,254 2,045
As % of all permanent jobs advertised in England 1.55% 1.46% 2.27%
As % of the Processes & Methodologies category 1.65% 1.71% 2.38%
Number of salaries quoted 506 733 1,414
10th Percentile £42,500 £34,250 £41,250
25th Percentile £50,967 £44,250 £49,750
Median annual salary (50th Percentile) £60,000 £55,000 £60,000
Median % change year-on-year +9.09% -8.33% -
75th Percentile £77,500 £73,410 £72,500
90th Percentile £102,500 £92,500 £85,875
UK median annual salary £60,000 £54,000 £60,000
% change year-on-year +11.11% -10.00% +4.35%

All Process and Methodology Skills
England

Business Analysis falls under the Processes and Methodologies category. For comparison with the information above, the following table provides summary statistics for all permanent job vacancies requiring process or methodology skills in England.

Permanent vacancies with a requirement for process or methodology skills 45,472 73,407 86,016
As % of all permanent jobs advertised in England 94.00% 85.49% 95.63%
Number of salaries quoted 24,183 53,973 50,952
10th Percentile £30,000 £29,000 £34,256
25th Percentile £42,500 £40,000 £46,000
Median annual salary (50th Percentile) £57,500 £55,000 £62,500
Median % change year-on-year +4.55% -12.00% +4.17%
75th Percentile £76,250 £73,410 £82,500
90th Percentile £100,000 £93,750 £101,250
UK median annual salary £57,500 £55,000 £61,180
% change year-on-year +4.55% -10.10% +1.97%

Business Analysis
Job Vacancy Trend in England

Job postings citing Business Analysis as a proportion of all IT jobs advertised in England.
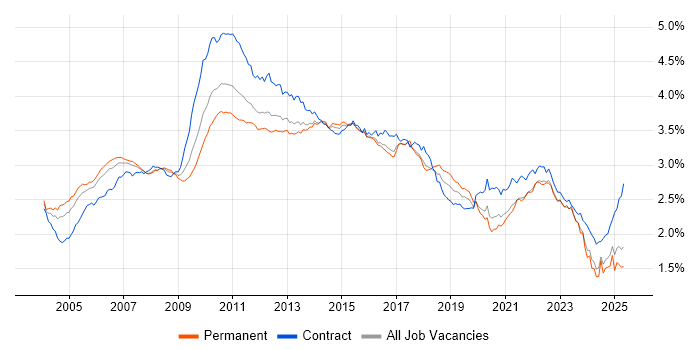
Job vacancy trend for Business Analysis in England

Business Analysis
Salary Trend in England

3-month moving average salary quoted in jobs citing Business Analysis in England.

Salary trend for Business Analysis in England

Business Analysis
Salary Histogram in England

Salary distribution for jobs citing Business Analysis in England over the 6 months to 11 May 2025.

Salary histogram for Business Analysis in England

Business Analysis
Job Locations in England

The table below looks at the demand and provides a guide to the median salaries quoted in IT jobs citing Business Analysis within the England region over the 6 months to 11 May 2025. The 'Rank Change' column provides an indication of the change in demand within each location based on the same 6 month period last year.

Location Rank Change
on Same Period
Last Year
Matching
Permanent
IT Job Ads
Median Salary
Past 6 Months
Median Salary
% Change
on Same Period
Last Year
Live
Jobs
London +45 287 £80,000 +14.29% 449
North of England +17 164 £60,000 +14.29% 99
North West +12 152 £60,000 +26.32% 59
South East +4 86 £50,967 -2.92% 175
East of England -15 85 £50,967 +9.49% 44
South West +44 60 £57,500 +12.20% 52
Midlands -38 59 £59,000 +24.21% 66
West Midlands -12 47 £55,000 +15.79% 44
East Midlands +10 12 £65,000 +35.15% 19
Yorkshire +24 8 £71,991 +37.13% 28
North East +30 4 £40,000 -23.81% 12
Business Analysis
UK

Business Analysis
Co-occurring Skills and Capabilities in England by Category

The follow tables expand on the table above by listing co-occurrences grouped by category. The same employment type, locality and period is covered with up to 20 co-occurrences shown in each of the following categories:

Application Platforms
1 60 (8.01%) Oracle Application Server
2 28 (3.74%) Confluence
3 18 (2.40%) SharePoint
4 6 (0.80%) CMS
5 3 (0.40%) Microsoft Exchange
6 2 (0.27%) Apache Spark
7 1 (0.13%) Apache
7 1 (0.13%) Apache Airflow
7 1 (0.13%) Oracle SOA Suite
7 1 (0.13%) Skype for Business
Applications
1 54 (7.21%) Microsoft Excel
2 31 (4.14%) MS Visio
3 19 (2.54%) Microsoft Office
3 19 (2.54%) Microsoft PowerPoint
4 5 (0.67%) Microsoft Project
4 5 (0.67%) Trello
5 2 (0.27%) Adobe XD
Business Applications
1 45 (6.01%) Aladdin
2 36 (4.81%) thinkFolio
3 12 (1.60%) Dynamics CRM
4 8 (1.07%) Teamcenter
5 5 (0.67%) Dynamics AX
6 4 (0.53%) iTrent
7 2 (0.27%) SAP S/4HANA
8 1 (0.13%) Eloqua
8 1 (0.13%) Odoo
8 1 (0.13%) Oracle EBS R12
8 1 (0.13%) Oracle Procure-to-Pay
8 1 (0.13%) SAP ERP
8 1 (0.13%) Siebel CRM
Cloud Services
1 44 (5.87%) Power Platform
2 34 (4.54%) SaaS
3 29 (3.87%) Azure
4 20 (2.67%) Dynamics 365
5 17 (2.27%) AWS
6 11 (1.47%) Microsoft 365
7 10 (1.34%) Azure DevOps
8 6 (0.80%) Google Analytics
8 6 (0.80%) Power Automate
8 6 (0.80%) PowerApps
9 5 (0.67%) PaaS
10 4 (0.53%) Azure Data Factory
10 4 (0.53%) Lucidchart
11 3 (0.40%) Figma
11 3 (0.40%) Serverless
12 2 (0.27%) Azure Functions
12 2 (0.27%) Azure Logic Apps
12 2 (0.27%) Miro
12 2 (0.27%) Snowflake
12 2 (0.27%) WhatsApp
Communications & Networking
1 5 (0.67%) BGP
1 5 (0.67%) EIGRP
1 5 (0.67%) Firewall
1 5 (0.67%) HSRP
1 5 (0.67%) IPsec
1 5 (0.67%) OSPF
1 5 (0.67%) SNMP
1 5 (0.67%) VPN
1 5 (0.67%) VRRP
1 5 (0.67%) Wi-Fi
2 1 (0.13%) Kerberos
2 1 (0.13%) Skype
Database & Business Intelligence
1 83 (11.08%) Data Warehouse
2 67 (8.95%) Enterprise Data Warehouse
3 60 (8.01%) Oracle Reports
4 39 (5.21%) Power BI
5 36 (4.81%) SQL Server
6 10 (1.34%) Tableau
7 9 (1.20%) Relational Database
8 6 (0.80%) Data Lake
9 5 (0.67%) SQL Server Integration Services
10 4 (0.53%) Big Data
11 2 (0.27%) Data Mining
11 2 (0.27%) MongoDB
11 2 (0.27%) NoSQL
11 2 (0.27%) PostgreSQL
11 2 (0.27%) RDBMS
11 2 (0.27%) SQL Server Reporting Services
12 1 (0.13%) BusinessObjects
12 1 (0.13%) DTS
12 1 (0.13%) MS Access
12 1 (0.13%) Snowflake Schema
Development Applications
1 49 (6.54%) JIRA
2 2 (0.27%) Maven
2 2 (0.27%) SQL Server Management Studio (SSMS)
3 1 (0.13%) Git
3 1 (0.13%) MSBuild
3 1 (0.13%) NUnit
3 1 (0.13%) Oracle APEX
3 1 (0.13%) Postman
General
1 332 (44.33%) Social Skills
2 286 (38.18%) Analytical Skills
3 275 (36.72%) Finance
4 101 (13.48%) Influencing Skills
5 90 (12.02%) Organisational Skills
6 67 (8.95%) Manufacturing
7 60 (8.01%) Military
8 57 (7.61%) Front Office
9 43 (5.74%) Retail
10 32 (4.27%) Banking
11 29 (3.87%) Marketing
12 24 (3.20%) Legal
13 20 (2.67%) Inclusion and Diversity
14 19 (2.54%) Law
15 17 (2.27%) Presentation Skills
16 16 (2.14%) Documentation Skills
17 13 (1.74%) Public Sector
17 13 (1.74%) Publishing
18 7 (0.93%) General Ledger
18 7 (0.93%) German Language
Job Titles
1 407 (54.34%) Analyst
2 262 (34.98%) Business Analyst
3 92 (12.28%) Change Analyst
4 90 (12.02%) Business Change Analyst
5 85 (11.35%) Architect
6 79 (10.55%) Senior
7 71 (9.48%) Solutions Architect
8 57 (7.61%) Business Manager
9 51 (6.81%) Senior Analyst
10 50 (6.68%) Fixed Income Business Analyst
11 47 (6.28%) Developer
12 44 (5.87%) Senior Business Analyst
13 28 (3.74%) Software Developer
14 25 (3.34%) Lead
15 23 (3.07%) Project Manager
16 21 (2.80%) Business IT Analyst
16 21 (2.80%) IT Analyst
16 21 (2.80%) IT Business Analyst
16 21 (2.80%) Senior Manager
17 20 (2.67%) Financial Analyst
Libraries, Frameworks & Software Standards
1 12 (1.60%) .NET
2 9 (1.20%) CSS
2 9 (1.20%) HTML
3 5 (0.67%) Gherkin
3 5 (0.67%) OAuth
3 5 (0.67%) REST
4 4 (0.53%) ASP.NET
4 4 (0.53%) MACH
4 4 (0.53%) Middleware
5 3 (0.40%) AngularJS
5 3 (0.40%) LDAP
5 3 (0.40%) SOAP
5 3 (0.40%) XML
6 2 (0.27%) .NET Framework
6 2 (0.27%) FIX Protocol
6 2 (0.27%) JSON
6 2 (0.27%) Node.js
6 2 (0.27%) Pandas
6 2 (0.27%) Visualforce
6 2 (0.27%) Web Services
Miscellaneous
1 62 (8.28%) Management Information System
2 58 (7.74%) Derivative
3 50 (6.68%) Fixed Income
3 50 (6.68%) Hedge funds
4 49 (6.54%) Onboarding
5 43 (5.74%) Analytical Mindset
6 42 (5.61%) Product Ownership
7 12 (1.60%) Data Protection Act
8 8 (1.07%) PMI
9 7 (0.93%) OTC Derivatives
10 6 (0.80%) Legacy Systems
10 6 (0.80%) Marketing Technology
10 6 (0.80%) Social Media
11 5 (0.67%) IPTV
11 5 (0.67%) Self-Motivation
12 4 (0.53%) Data Structures
12 4 (0.53%) Equities
12 4 (0.53%) Operational Technology
13 3 (0.40%) Mobile App
13 3 (0.40%) SWIFT Messaging Network
Operating Systems
1 6 (0.80%) Windows
2 4 (0.53%) Linux
2 4 (0.53%) Windows Vista
3 3 (0.40%) Unix
4 2 (0.27%) Android
4 2 (0.27%) Apple iOS
5 1 (0.13%) AIX
5 1 (0.13%) Windows Server
Processes & Methodologies
1 349 (46.60%) Agile
2 253 (33.78%) Problem-Solving
3 150 (20.03%) Continuous Improvement
4 144 (19.23%) Workshop Facilitation
5 133 (17.76%) Project Management
6 131 (17.49%) Stakeholder Engagement
7 128 (17.09%) Analytics
8 127 (16.96%) Business Case
9 126 (16.82%) Roadmaps
9 126 (16.82%) Use Case
10 124 (16.56%) Change Management
11 122 (16.29%) ITIL
12 113 (15.09%) Stakeholder Management
13 102 (13.62%) Collaborative Working
14 97 (12.95%) Business Intelligence
15 95 (12.68%) Strategic Thinking
16 94 (12.55%) MoSCoW
17 89 (11.88%) Requirements Gathering
18 87 (11.62%) User Stories
19 86 (11.48%) Data Analysis
Programming Languages
1 97 (12.95%) SQL
2 64 (8.54%) Python
3 36 (4.81%) C#
4 32 (4.27%) Java
5 7 (0.93%) JavaScript
6 6 (0.80%) T-SQL
7 5 (0.67%) PowerShell
8 4 (0.53%) C++
9 3 (0.40%) Data Analysis Expressions
10 2 (0.27%) Apex Code
10 2 (0.27%) Bash
10 2 (0.27%) Shell Script
10 2 (0.27%) SOQL
11 1 (0.13%) ABAP
11 1 (0.13%) Kotlin
11 1 (0.13%) R
11 1 (0.13%) VBA
Qualifications
1 182 (24.30%) Degree
2 128 (17.09%) CBAP
3 69 (9.21%) BPSS Clearance
4 67 (8.95%) DBS Check
5 33 (4.41%) PMI Certification
6 26 (3.47%) Master's Degree
7 25 (3.34%) PMP
8 12 (1.60%) Computer Science Degree
8 12 (1.60%) Security Cleared
9 11 (1.47%) IIBA
10 9 (1.20%) ITIL Foundation Certificate
11 7 (0.93%) TOGAF Certification
12 6 (0.80%) Cisco Certification
12 6 (0.80%) CSPO
12 6 (0.80%) Microsoft Certification
13 5 (0.67%) CCNA
13 5 (0.67%) ISEB
13 5 (0.67%) SC Cleared
14 4 (0.53%) DV Cleared
14 4 (0.53%) PRINCE2 Certification
Quality Assurance & Compliance
1 40 (5.34%) QA
2 21 (2.80%) PMO
3 8 (1.07%) Actionable Recommendations
4 7 (0.93%) Data Quality
5 5 (0.67%) GDPR
6 4 (0.53%) Accessibility
7 3 (0.40%) EMIR
7 3 (0.40%) MiFID
8 2 (0.27%) GRC
8 2 (0.27%) ISO 20022
8 2 (0.27%) ISO/IEC 27001
8 2 (0.27%) SEPA
9 1 (0.13%) HIPAA
9 1 (0.13%) ISO 9001
9 1 (0.13%) Solvency II
System Software
1 1 (0.13%) Active Directory
1 1 (0.13%) Virtual Machines
Systems Management
1 2 (0.27%) Kubernetes
2 1 (0.13%) Single Sign-On
Vendors
1 92 (12.28%) Oracle
2 69 (9.21%) Microsoft
3 43 (5.74%) BISAM
4 42 (5.61%) Charles River
5 36 (4.81%) Calypso
5 36 (4.81%) SimCorp
6 17 (2.27%) YouTube
7 12 (1.60%) Salesforce
8 10 (1.34%) Guidewire
9 9 (1.20%) Atlassian
9 9 (1.20%) SAP
9 9 (1.20%) ServiceNow
10 8 (1.07%) Siemens
11 7 (0.93%) Anaplan
11 7 (0.93%) Google
12 5 (0.67%) Bloomberg
12 5 (0.67%) CheckPoint
12 5 (0.67%) Fortinet
12 5 (0.67%) Meraki
12 5 (0.67%) SolarWinds