Test Automation Jobs in the UK excluding London

Automated Testing
UK > UK excluding London

The table below provides summary statistics for permanent job vacancies advertised in the UK excluding London requiring Test Automation skills. It includes a benchmarking guide to the annual salaries offered in vacancies that cited Test Automation over the 6 months leading up to 28 May 2025, comparing them to the same period in the previous two years.

6 months to
28 May 2025
Same period 2024 Same period 2023
Rank 94 95 35
Rank change year-on-year +1 -60 0
Permanent jobs citing Test Automation 1,196 1,957 3,987
As % of all permanent jobs advertised in the UK excluding London 3.08% 2.66% 6.83%
As % of the Processes & Methodologies category 3.32% 3.22% 7.15%
Number of salaries quoted 614 1,151 1,448
10th Percentile £40,748 £36,250 £36,750
25th Percentile £47,500 £42,500 £45,000
Median annual salary (50th Percentile) £59,900 £52,500 £57,500
Median % change year-on-year +14.10% -8.70% +9.23%
75th Percentile £71,250 £66,875 £70,000
90th Percentile £93,394 £75,000 £84,056
UK median annual salary £60,000 £57,500 £65,000
% change year-on-year +4.35% -11.54% +8.33%

All Process and Methodology Skills
UK excluding London

Test Automation falls under the Processes and Methodologies category. For comparison with the information above, the following table provides summary statistics for all permanent job vacancies requiring process or methodology skills in the UK excluding London.

Permanent vacancies with a requirement for process or methodology skills 36,047 60,812 55,780
As % of all permanent jobs advertised in the UK excluding London 92.70% 82.57% 95.55%
Number of salaries quoted 17,118 41,900 28,987
10th Percentile £26,338 £27,300 £30,500
25th Percentile £37,000 £36,250 £40,000
Median annual salary (50th Percentile) £51,645 £50,000 £55,000
Median % change year-on-year +3.29% -9.09% +4.76%
75th Percentile £65,000 £65,000 £70,000
90th Percentile £77,500 £77,500 £82,500
UK median annual salary £57,500 £55,000 £61,000
% change year-on-year +4.55% -9.84% +1.67%

Test Automation
Job Vacancy Trend in the UK excluding London

Job postings citing Test Automation as a proportion of all IT jobs advertised in the UK excluding London.
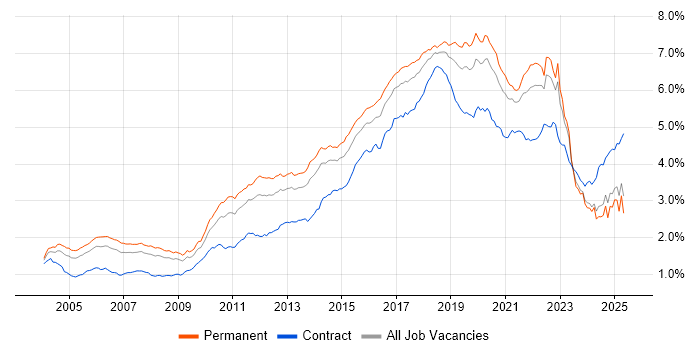
Job vacancy trend for Test Automation in the UK excluding London

Test Automation
Salary Trend in the UK excluding London

3-month moving average salary quoted in jobs citing Test Automation in the UK excluding London.

Salary trend for Test Automation in the UK excluding London

Test Automation
Salary Histogram in the UK excluding London

Salary distribution for jobs citing Test Automation in the UK excluding London over the 6 months to 28 May 2025.

Salary histogram for Test Automation in the UK excluding London

Test Automation
Job Locations in the UK excluding London

The table below looks at the demand and provides a guide to the median salaries quoted in IT jobs citing Test Automation within the UK excluding London region over the 6 months to 28 May 2025. The 'Rank Change' column provides an indication of the change in demand within each location based on the same 6 month period last year.

Location Rank Change
on Same Period
Last Year
Matching
Permanent
IT Job Ads
Median Salary
Past 6 Months
Median Salary
% Change
on Same Period
Last Year
Live
Jobs
South East +7 326 £60,000 +9.09% 432
North of England +3 308 £55,000 - 361
North West -21 222 £55,000 - 196
Midlands +5 174 £58,000 +16.00% 182
South West +56 153 £60,000 +6.19% 180
Scotland 0 135 £58,000 +16.00% 118
West Midlands +2 96 £66,250 +26.19% 95
East Midlands +56 78 £47,500 - 82
East of England +11 75 £57,000 +3.64% 135
Yorkshire +15 63 £52,723 -4.14% 114
North East +40 23 £59,002 -1.66% 53
Wales +3 23 £60,000 +20.00% 49
Northern Ireland +41 10 £55,000 -4.35% 53
Isle of Man - 1 £52,500 - 2
Test Automation
UK

Test Automation
Co-occurring Skills and Capabilities in the UK excluding London by Category

The follow tables expand on the table above by listing co-occurrences grouped by category. The same employment type, locality and period is covered with up to 20 co-occurrences shown in each of the following categories:

Application Platforms
1 185 (15.47%) Confluence
2 17 (1.42%) Apache Spark
3 9 (0.75%) SharePoint
4 6 (0.50%) Apache
4 6 (0.50%) Appian
4 6 (0.50%) CMS
4 6 (0.50%) nginx
4 6 (0.50%) Tomcat
5 5 (0.42%) Apache Airflow
5 5 (0.42%) JBoss
6 4 (0.33%) IIS
6 4 (0.33%) SAS
7 2 (0.17%) Apache Solr
7 2 (0.17%) CICS
7 2 (0.17%) Umbraco
8 1 (0.084%) Headless CMS
8 1 (0.084%) Mendix
8 1 (0.084%) Moodle
8 1 (0.084%) Strapi
8 1 (0.084%) Totara
Applications
1 5 (0.42%) Chatbot
1 5 (0.42%) Microsoft Excel
2 4 (0.33%) Microsoft Office
2 4 (0.33%) SOLIDWORKS
3 1 (0.084%) AutoCAD
Business Applications
1 2 (0.17%) Dynamics CRM
1 2 (0.17%) Oracle BPM
2 1 (0.084%) Magento
2 1 (0.084%) Payment Gateway
2 1 (0.084%) SAP S/4HANA
2 1 (0.084%) Siebel CRM
Cloud Services
1 471 (39.38%) Azure
2 424 (35.45%) AWS
3 248 (20.74%) GCP
4 93 (7.78%) Azure DevOps
5 64 (5.35%) Serverless
6 51 (4.26%) GitHub
7 49 (4.10%) AWS Lambda
8 39 (3.26%) SaaS
9 28 (2.34%) PaaS
10 24 (2.01%) Amazon S3
11 22 (1.84%) GitHub Actions
12 19 (1.59%) Power Platform
13 18 (1.51%) Azure Logic Apps
14 16 (1.34%) Amazon EC2
15 15 (1.25%) npm
16 13 (1.09%) OpenShift
16 13 (1.09%) Power Automate
17 12 (1.00%) Google Kubernetes Engine
18 11 (0.92%) Amazon SQS
18 11 (0.92%) Azure Service Bus
Communications & Networking
1 70 (5.85%) TCP/IP
2 65 (5.43%) VPN
3 19 (1.59%) 5G
3 19 (1.59%) SD-WAN
3 19 (1.59%) WAN
4 11 (0.92%) Internet
5 8 (0.67%) Network Security
6 7 (0.59%) BGP
6 7 (0.59%) Firewall
7 6 (0.50%) DNS
7 6 (0.50%) OSPF
7 6 (0.50%) SAN
8 5 (0.42%) Bluetooth
8 5 (0.42%) Multicast
8 5 (0.42%) Wi-Fi
9 4 (0.33%) EIGRP
10 3 (0.25%) Broadband
11 2 (0.17%) FTP
11 2 (0.17%) VLAN
12 1 (0.084%) MPLS
Database & Business Intelligence
1 291 (24.33%) SQL Server
2 44 (3.68%) NoSQL
3 41 (3.43%) DynamoDB
4 38 (3.18%) PostgreSQL
5 35 (2.93%) MongoDB
6 28 (2.34%) MySQL
7 21 (1.76%) Relational Database
8 19 (1.59%) Big Data
9 13 (1.09%) Power BI
10 12 (1.00%) Amazon RDS
11 11 (0.92%) Amazon Aurora
12 10 (0.84%) Cloud Spanner
13 8 (0.67%) DB2
14 7 (0.59%) Elasticsearch
15 6 (0.50%) Oracle Database
16 4 (0.33%) Amazon Athena
17 3 (0.25%) Azure SQL Database
17 3 (0.25%) Couchbase
18 2 (0.17%) Apache Cassandra
18 2 (0.17%) HBase
Development Applications
1 371 (31.02%) JIRA
2 369 (30.85%) Selenium
3 352 (29.43%) Cucumber
4 281 (23.49%) SonarQube
5 280 (23.41%) Maven
6 276 (23.08%) GitLab
7 271 (22.66%) Sonatype Nexus
8 255 (21.32%) Bitbucket
9 134 (11.20%) Git
10 94 (7.86%) Jenkins
11 70 (5.85%) Robot Framework
12 49 (4.10%) Postman
13 42 (3.51%) Cypress.io
14 33 (2.76%) JUnit
15 22 (1.84%) Appium
16 21 (1.76%) eggPlant
16 21 (1.76%) Visual Studio
17 20 (1.67%) SpecFlow
18 18 (1.51%) JMeter
19 16 (1.34%) webpack
General
1 457 (38.21%) Finance
2 368 (30.77%) Inclusion and Diversity
3 348 (29.10%) Banking
4 294 (24.58%) Social Skills
5 105 (8.78%) Retail
6 91 (7.61%) Investment Banking
7 90 (7.53%) Corporate Banking
8 76 (6.35%) Analytical Skills
9 65 (5.43%) Telecoms
10 47 (3.93%) Public Sector
11 44 (3.68%) Law
12 36 (3.01%) Electronics
13 34 (2.84%) Presentation Skills
14 23 (1.92%) Aerospace
15 21 (1.76%) Manufacturing
16 16 (1.34%) Games
17 15 (1.25%) Organisational Skills
18 12 (1.00%) Legal
19 10 (0.84%) Documentation Skills
19 10 (0.84%) Marketing
Job Titles
1 403 (33.70%) Software Engineer
2 288 (24.08%) Senior
3 170 (14.21%) Lead
4 167 (13.96%) Test Engineer
5 124 (10.37%) Developer
6 83 (6.94%) Test Automation Engineer
7 78 (6.52%) Senior Software Engineer
8 70 (5.85%) Analyst
9 65 (5.43%) DevOps Engineer
10 64 (5.35%) Senior Developer
10 64 (5.35%) Senior Test Engineer
11 61 (5.10%) Software Test Engineer
12 56 (4.68%) Test Analyst
13 55 (4.60%) Senior Software Test Engineer
14 46 (3.85%) Software Developer
15 41 (3.43%) Software Team Leader
15 41 (3.43%) Team Leader
16 36 (3.01%) Java Engineer
16 36 (3.01%) QA Engineer
17 35 (2.93%) Automation Engineer
Libraries, Frameworks & Software Standards
1 351 (29.35%) React
2 329 (27.51%) Spring Boot
3 304 (25.42%) Spring
4 297 (24.83%) HTML
5 296 (24.75%) CSS
6 286 (23.91%) Kafka
7 254 (21.24%) JPA
7 254 (21.24%) Redux
8 172 (14.38%) Hibernate
9 158 (13.21%) RESTful
10 142 (11.87%) REST
11 108 (9.03%) Jest
12 98 (8.19%) CSS3
12 98 (8.19%) HTML5
13 93 (7.78%) Sass
14 82 (6.86%) .NET
15 64 (5.35%) Node.js
16 51 (4.26%) Playwright
17 34 (2.84%) GraphQL
18 30 (2.51%) AngularJS
Miscellaneous
1 296 (24.75%) Product Ownership
2 256 (21.40%) Enterprise Software
3 64 (5.35%) Linux Command Line
4 44 (3.68%) Public Cloud
5 38 (3.18%) e-Learning
6 35 (2.93%) Hybrid Cloud
7 34 (2.84%) Mobile App
8 30 (2.51%) Cloud Native
9 22 (1.84%) Algorithms
9 22 (1.84%) Distributed Systems
10 19 (1.59%) Operational Technology
10 19 (1.59%) SCADA
10 19 (1.59%) Self-Driving Car
10 19 (1.59%) Self-Motivation
11 18 (1.51%) Data Structures
11 18 (1.51%) Embedded Systems
12 17 (1.42%) Management Information System
12 17 (1.42%) Satnav
12 17 (1.42%) Virtual Team
13 16 (1.34%) Replication
Operating Systems
1 132 (11.04%) Linux
2 106 (8.86%) Windows
3 26 (2.17%) Apple iOS
4 22 (1.84%) Android
5 16 (1.34%) Unix
6 7 (0.59%) Windows Server 2019
7 5 (0.42%) Windows 10
7 5 (0.42%) Windows Server
7 5 (0.42%) Windows Server 2012
7 5 (0.42%) Windows Server 2016
8 2 (0.17%) Red Hat Enterprise Linux
9 1 (0.084%) VMS
9 1 (0.084%) zOS
Processes & Methodologies
1 720 (60.20%) Agile
2 553 (46.24%) DevOps
3 524 (43.81%) CI/CD
4 492 (41.14%) Software Engineering
5 397 (33.19%) Microservices
6 382 (31.94%) Containerisation
7 339 (28.34%) SDLC
8 335 (28.01%) Mentoring
9 332 (27.76%) Full-Stack Development
10 273 (22.83%) Front End Development
11 263 (21.99%) Software Testing
12 259 (21.66%) TDD
13 254 (21.24%) Performance Optimisation
14 250 (20.90%) Problem-Solving
15 203 (16.97%) Clean Code
16 200 (16.72%) Continuous Improvement
17 191 (15.97%) Computer Science
18 173 (14.46%) User Experience
19 134 (11.20%) Coaching
20 133 (11.12%) Scrum
Programming Languages
1 489 (40.89%) Java
2 476 (39.80%) JavaScript
3 360 (30.10%) SQL
4 252 (21.07%) Python
5 188 (15.72%) TypeScript
6 135 (11.29%) C#
7 89 (7.44%) PowerShell
8 71 (5.94%) Bash
8 71 (5.94%) C++
9 60 (5.02%) Rust
10 39 (3.26%) C
11 29 (2.42%) PHP
12 17 (1.42%) Go
13 14 (1.17%) Ada
14 10 (0.84%) Groovy
14 10 (0.84%) Kotlin
15 8 (0.67%) MATLAB
15 8 (0.67%) Scala
16 7 (0.59%) Embedded C
17 6 (0.50%) Bicep
Qualifications
1 285 (23.83%) Degree
2 103 (8.61%) BPSS Clearance
3 63 (5.27%) ISTQB
4 51 (4.26%) Security Cleared
5 43 (3.60%) Computer Science Degree
6 26 (2.17%) SC Cleared
7 21 (1.76%) DV Cleared
7 21 (1.76%) HND
8 18 (1.51%) Master's Degree
9 16 (1.34%) HNC
10 14 (1.17%) Chartered Engineer
11 11 (0.92%) ISTQB Foundation Certification
12 7 (0.59%) DBS Check
13 5 (0.42%) ACCA
13 5 (0.42%) CIMA
14 3 (0.25%) AWS Certification
14 3 (0.25%) ISEB
14 3 (0.25%) OCP
14 3 (0.25%) Oracle Certification
15 2 (0.17%) Cisco Certification
Quality Assurance & Compliance
1 434 (36.29%) QA
2 104 (8.70%) Accessibility
3 50 (4.18%) ISO/IEC 12207
4 21 (1.76%) NCSC
5 16 (1.34%) ISO/IEC 27001
6 15 (1.25%) NIST
7 12 (1.00%) PMO
8 4 (0.33%) Basel II
8 4 (0.33%) Basel III
8 4 (0.33%) Dodd-Frank
8 4 (0.33%) GDPR
8 4 (0.33%) IFRS
8 4 (0.33%) IFRS 9
8 4 (0.33%) PCI DSS
9 3 (0.25%) Data Quality
9 3 (0.25%) PMBOK
9 3 (0.25%) WCAG
10 2 (0.17%) GxP
10 2 (0.17%) SEPA
11 1 (0.084%) JTAG
System Software
1 375 (31.35%) Docker
2 11 (0.92%) VMware Infrastructure
3 7 (0.59%) Firmware
4 6 (0.50%) Active Directory
5 5 (0.42%) Hyper-V
6 4 (0.33%) VMware NSX
7 3 (0.25%) Embedded Firmware
8 2 (0.17%) HDFS
9 1 (0.084%) Terminal Server
9 1 (0.084%) Virtual Machines
9 1 (0.084%) vSphere
Systems Management
1 379 (31.69%) Kubernetes
2 84 (7.02%) Terraform
3 37 (3.09%) Ansible
4 12 (1.00%) Istio
5 10 (0.84%) Grafana
6 6 (0.50%) Packer
6 6 (0.50%) Prometheus
7 5 (0.42%) Kustomize
8 4 (0.33%) Progress Chef
9 3 (0.25%) Argo
10 2 (0.17%) Iperf
10 2 (0.17%) Puppet
10 2 (0.17%) Rancher
10 2 (0.17%) SCCM
10 2 (0.17%) SCOM
11 1 (0.084%) CA Service Virtualization
11 1 (0.084%) FortiGate
11 1 (0.084%) Microsoft Intune
11 1 (0.084%) Opsgenie
11 1 (0.084%) vRealize
Vendors
1 246 (20.57%) Solace
2 80 (6.69%) Microsoft
3 50 (4.18%) IBM
4 39 (3.26%) Red Hat
5 29 (2.42%) Oracle
6 22 (1.84%) Salesforce
7 21 (1.76%) Keysight
7 21 (1.76%) VMware
8 16 (1.34%) Google
9 12 (1.00%) Cisco
10 11 (0.92%) Atlassian
10 11 (0.92%) Databricks
11 7 (0.59%) UiPath
12 5 (0.42%) Alteryx
12 5 (0.42%) BiZZdesign
12 5 (0.42%) Black Duck
12 5 (0.42%) F5
13 4 (0.33%) Adobe
13 4 (0.33%) Agilent
13 4 (0.33%) Intel