Prototyping Jobs in England

Prototyping
UK > England

The table below provides summary statistics for permanent job vacancies advertised in England requiring Prototyping skills. It includes a benchmarking guide to the annual salaries offered in vacancies that cited Prototyping over the 6 months leading up to 22 May 2025, comparing them to the same period in the previous two years.

6 months to
22 May 2025
Same period 2024 Same period 2023
Rank 305 373 315
Rank change year-on-year +68 -58 -100
Permanent jobs citing Prototyping 463 605 940
As % of all permanent jobs advertised in England 0.95% 0.70% 1.07%
As % of the Processes & Methodologies category 1.01% 0.82% 1.12%
Number of salaries quoted 145 321 521
10th Percentile £33,700 £38,066 £45,000
25th Percentile £45,628 £42,500 £55,000
Median annual salary (50th Percentile) £60,000 £57,500 £65,000
Median % change year-on-year +4.35% -11.54% +8.33%
75th Percentile £75,000 £72,500 £78,453
90th Percentile £93,267 £96,539 £96,250
UK median annual salary £60,000 £57,500 £65,000
% change year-on-year +4.35% -11.54% +8.33%

All Process and Methodology Skills
England

Prototyping falls under the Processes and Methodologies category. For comparison with the information above, the following table provides summary statistics for all permanent job vacancies requiring process or methodology skills in England.

Permanent vacancies with a requirement for process or methodology skills 45,797 73,583 84,076
As % of all permanent jobs advertised in England 94.20% 85.02% 95.61%
Number of salaries quoted 22,691 53,859 49,933
10th Percentile £30,000 £29,000 £34,324
25th Percentile £42,000 £40,000 £46,125
Median annual salary (50th Percentile) £57,500 £55,000 £62,500
Median % change year-on-year +4.55% -12.00% +4.17%
75th Percentile £75,000 £73,000 £82,500
90th Percentile £98,750 £93,750 £102,500
UK median annual salary £57,500 £55,000 £61,000
% change year-on-year +4.55% -9.84% +1.67%

Prototyping
Job Vacancy Trend in England

Job postings citing Prototyping as a proportion of all IT jobs advertised in England.
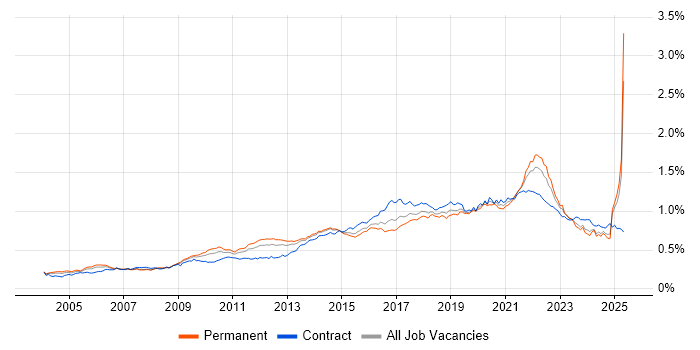
Job vacancy trend for Prototyping in England

Prototyping
Salary Trend in England

3-month moving average salary quoted in jobs citing Prototyping in England.

Salary trend for Prototyping in England

Prototyping
Salary Histogram in England

Salary distribution for jobs citing Prototyping in England over the 6 months to 22 May 2025.

Salary histogram for Prototyping in England

Prototyping
Job Locations in England

The table below looks at the demand and provides a guide to the median salaries quoted in IT jobs citing Prototyping within the England region over the 6 months to 22 May 2025. The 'Rank Change' column provides an indication of the change in demand within each location based on the same 6 month period last year.

Location Rank Change
on Same Period
Last Year
Matching
Permanent
IT Job Ads
Median Salary
Past 6 Months
Median Salary
% Change
on Same Period
Last Year
Live
Jobs
London +167 166 £57,500 -14.81% 384
South East -1 57 £60,000 +13.21% 489
North of England -47 54 £65,000 +18.18% 372
East of England +32 42 £45,000 -30.77% 263
North West -55 39 £55,000 -5.11% 179
South West +75 34 £68,525 +24.59% 211
Midlands +17 24 £57,500 +35.29% 289
West Midlands +44 16 £60,000 +41.18% 148
Yorkshire +29 8 £85,253 +100.59% 148
East Midlands +13 8 £33,000 -32.65% 124
North East +29 7 £67,192 +24.47% 45
Prototyping
UK

Prototyping
Co-occurring Skills and Capabilities in England by Category

The follow tables expand on the table above by listing co-occurrences grouped by category. The same employment type, locality and period is covered with up to 20 co-occurrences shown in each of the following categories:

Application Platforms
1 8 (1.73%) CMS
2 6 (1.30%) Confluence
3 5 (1.08%) Apache Spark
4 4 (0.86%) Headless CMS
5 2 (0.43%) Kinematics
6 1 (0.22%) Apache
6 1 (0.22%) Camunda
6 1 (0.22%) SharePoint
6 1 (0.22%) Sitefinity
6 1 (0.22%) WordPress
Applications
1 22 (4.75%) Adobe XD
2 20 (4.32%) Sketch
3 8 (1.73%) InVision
4 7 (1.51%) Adobe Creative Suite
5 5 (1.08%) Microsoft Excel
6 3 (0.65%) Maya
6 3 (0.65%) Microsoft Office
7 2 (0.43%) Adobe Illustrator
7 2 (0.43%) Autodesk Inventor
7 2 (0.43%) CATIA
7 2 (0.43%) Chatbot
7 2 (0.43%) InDesign
7 2 (0.43%) MS Visio
7 2 (0.43%) Photoshop
7 2 (0.43%) SOLIDWORKS
8 1 (0.22%) Adobe After Effects
8 1 (0.22%) GNU Octave
8 1 (0.22%) Simulink
Business Applications
1 4 (0.86%) Shopify
2 3 (0.65%) SAP CO
2 3 (0.65%) SAP FI
2 3 (0.65%) SAP FI/CO
2 3 (0.65%) SAP FSCM
2 3 (0.65%) SAP IBP
2 3 (0.65%) SAP IS-U
2 3 (0.65%) SAP S/4HANA
Cloud Services
1 58 (12.53%) AWS
2 48 (10.37%) Figma
3 34 (7.34%) Azure
4 20 (4.32%) GitHub
5 17 (3.67%) SaaS
6 14 (3.02%) Cloud Computing
6 14 (3.02%) GCP
7 11 (2.38%) Amazon ECS
7 11 (2.38%) AWS CloudFormation
8 10 (2.16%) Amazon ECR
8 10 (2.16%) Amazon ElastiCache
8 10 (2.16%) Amazon OpenSearch
8 10 (2.16%) AWS CodeBuild
8 10 (2.16%) dbt
8 10 (2.16%) Pulumi
9 9 (1.94%) Power Platform
10 8 (1.73%) Sentry
11 5 (1.08%) Amazon EKS
12 4 (0.86%) GitHub Actions
12 4 (0.86%) Miro
Communications & Networking
1 215 (46.44%) Broadband
2 10 (2.16%) TCP/IP
3 5 (1.08%) RS-485
4 3 (0.65%) Internet
5 2 (0.43%) Ethernet
6 1 (0.22%) Intranet
6 1 (0.22%) MQTT
6 1 (0.22%) RS-232
6 1 (0.22%) Software-Defined Networking
6 1 (0.22%) VSAN
6 1 (0.22%) Wideband
6 1 (0.22%) Wi-Fi
Database & Business Intelligence
1 24 (5.18%) PostgreSQL
2 14 (3.02%) SQL Server
3 10 (2.16%) Amazon RDS
3 10 (2.16%) Elasticsearch
3 10 (2.16%) Redis
4 9 (1.94%) Power BI
5 7 (1.51%) MySQL
6 5 (1.08%) MongoDB
6 5 (1.08%) Relational Database
7 4 (0.86%) Amazon Redshift
7 4 (0.86%) Apache Hive
7 4 (0.86%) Biml
7 4 (0.86%) Data Warehouse
7 4 (0.86%) Hadoop
7 4 (0.86%) NoSQL
7 4 (0.86%) SQL Server Analysis Services
7 4 (0.86%) SQL Server Integration Services
7 4 (0.86%) SQL Server Reporting Services
8 3 (0.65%) Data Lake
8 3 (0.65%) SAP BW
Development Applications
1 15 (3.24%) JIRA
2 14 (3.02%) Git
3 12 (2.59%) Axure RP
4 8 (1.73%) GitLab
4 8 (1.73%) Visual Studio
5 5 (1.08%) Balsamiq
6 4 (0.86%) Subversion
7 3 (0.65%) Jenkins
8 2 (0.43%) Cucumber
8 2 (0.43%) MSI
8 2 (0.43%) Selenium
9 1 (0.22%) Babel
9 1 (0.22%) Carbide.c++
9 1 (0.22%) Jasmine
9 1 (0.22%) LabVIEW
9 1 (0.22%) MLflow
9 1 (0.22%) SpecFlow
9 1 (0.22%) Spinnaker
9 1 (0.22%) Storybook
9 1 (0.22%) webpack
General
1 230 (49.68%) Games
2 91 (19.65%) Social Skills
3 54 (11.66%) Finance
4 35 (7.56%) Electronics
5 34 (7.34%) Analytical Skills
6 30 (6.48%) Inclusion and Diversity
7 23 (4.97%) Law
8 21 (4.54%) Presentation Skills
9 19 (4.10%) Manufacturing
10 18 (3.89%) Marketing
11 15 (3.24%) Public Sector
12 11 (2.38%) Retail
13 10 (2.16%) Banking
14 9 (1.94%) Aerospace
15 5 (1.08%) Advertising
15 5 (1.08%) Aviation
16 4 (0.86%) Financial Institution
16 4 (0.86%) Local Government
16 4 (0.86%) Retail Banking
17 3 (0.65%) Automotive
Job Titles
1 277 (59.83%) Senior
2 44 (9.50%) Developer
3 39 (8.42%) Designer
4 29 (6.26%) Software Engineer
5 26 (5.62%) Electronics Engineer
6 23 (4.97%) Design Engineer
6 23 (4.97%) Senior Electronics Engineer
7 17 (3.67%) Electronics Design Engineer
7 17 (3.67%) UX Designer
8 15 (3.24%) Senior Design Engineer
8 15 (3.24%) Senior Electronics Design Engineer
9 14 (3.02%) Lead
10 12 (2.59%) Product Manager
11 11 (2.38%) Delivery Manager
11 11 (2.38%) Principal Engineer
12 10 (2.16%) Android Developer
13 9 (1.94%) Consultant
13 9 (1.94%) Data Scientist
13 9 (1.94%) FPGA Engineer
13 9 (1.94%) Product Delivery Manager
Libraries, Frameworks & Software Standards
1 217 (46.87%) GraphQL
2 216 (46.65%) Unity (Game Engine)
3 215 (46.44%) WebGL
4 22 (4.75%) CSS
4 22 (4.75%) React
5 15 (3.24%) HTML
6 14 (3.02%) .NET
6 14 (3.02%) Django
7 11 (2.38%) .NET Framework
8 10 (2.16%) Node.js
9 8 (1.73%) Express.js
9 8 (1.73%) Next.js
9 8 (1.73%) RESTful
10 7 (1.51%) Spring Boot
11 5 (1.08%) Spring
11 5 (1.08%) TensorFlow
12 4 (0.86%) Flask
12 4 (0.86%) Lambda Expressions
12 4 (0.86%) NHibernate
12 4 (0.86%) Swagger
Miscellaneous
1 215 (46.44%) Animation
2 26 (5.62%) FPGA
3 17 (3.67%) Mobile App
4 16 (3.46%) Optoelectronics
4 16 (3.46%) Product Ownership
5 15 (3.24%) Verilog
5 15 (3.24%) VHDL
6 12 (2.59%) Algorithms
6 12 (2.59%) Educational Technology
7 10 (2.16%) Distributed Systems
7 10 (2.16%) Mobile Games
8 9 (1.94%) Analogue Electronics
9 7 (1.51%) Cloud Native
9 7 (1.51%) Life Science
10 6 (1.30%) Hackathon
10 6 (1.30%) Management Information System
11 5 (1.08%) CPLD
11 5 (1.08%) Robotics
12 4 (0.86%) N-Tier
12 4 (0.86%) Wiki
Operating Systems
1 22 (4.75%) Linux
2 13 (2.81%) Apple iOS
3 11 (2.38%) Android
4 10 (2.16%) Unix
5 4 (0.86%) Windows
6 1 (0.22%) FreeRTOS
Processes & Methodologies
1 272 (58.75%) Problem-Solving
2 252 (54.43%) Rapid Prototyping
3 242 (52.27%) Artificial Intelligence
4 221 (47.73%) Storytelling
5 215 (46.44%) 3D Animation
5 215 (46.44%) Visual Effects
6 102 (22.03%) Agile
7 76 (16.41%) User Experience
8 49 (10.58%) Software Engineering
9 43 (9.29%) DevOps
10 40 (8.64%) User Research
10 40 (8.64%) Wireframes
11 39 (8.42%) CI/CD
12 35 (7.56%) Requirements Analysis
12 35 (7.56%) Stakeholder Management
13 34 (7.34%) UX Design
14 31 (6.70%) Roadmaps
14 31 (6.70%) Test Automation
15 30 (6.48%) User-Centered Design (UCD)
15 30 (6.48%) Validation
Programming Languages
1 215 (46.44%) HLSL
2 46 (9.94%) Python
3 30 (6.48%) C#
4 26 (5.62%) Java
5 25 (5.40%) JavaScript
6 22 (4.75%) TypeScript
7 20 (4.32%) C++
7 20 (4.32%) SQL
8 19 (4.10%) C
9 10 (2.16%) Kotlin
9 10 (2.16%) MATLAB
9 10 (2.16%) Objective-C
9 10 (2.16%) Swift
10 4 (0.86%) Embedded C
10 4 (0.86%) Embedded C++
10 4 (0.86%) R
10 4 (0.86%) T-SQL
11 2 (0.43%) PowerShell
12 1 (0.22%) Data Analysis Expressions
12 1 (0.22%) Ruby
Qualifications
1 71 (15.33%) Degree
2 30 (6.48%) Security Cleared
3 25 (5.40%) SC Cleared
4 15 (3.24%) Master's Degree
5 10 (2.16%) DBS Check
6 6 (1.30%) DV Cleared
7 4 (0.86%) PhD
8 3 (0.65%) BPSS Clearance
8 3 (0.65%) Computer Science Degree
8 3 (0.65%) HNC
8 3 (0.65%) Microsoft Certification
8 3 (0.65%) Numerate Degree
9 1 (0.22%) AWS Certification
Quality Assurance & Compliance
1 26 (5.62%) Accessibility
2 18 (3.89%) QA
3 14 (3.02%) WCAG
4 5 (1.08%) ISO 9001
5 3 (0.65%) ISO/IEC 27001
5 3 (0.65%) NCSC
6 2 (0.43%) COBIT
6 2 (0.43%) SEPA
7 1 (0.22%) DO-254
7 1 (0.22%) GDPR
7 1 (0.22%) HIPAA
7 1 (0.22%) ISO 13485
System Software
1 31 (6.70%) Firmware
2 21 (4.54%) Docker
3 18 (3.89%) Embedded Firmware
4 1 (0.22%) VMware Infrastructure
Systems Management
1 21 (4.54%) Terraform
2 10 (2.16%) AWS Copilot
2 10 (2.16%) Kubernetes
3 5 (1.08%) Grafana
4 2 (0.43%) WMI
5 1 (0.22%) Ansible
5 1 (0.22%) Progress Chef
5 1 (0.22%) Prometheus
Vendors
1 28 (6.05%) Adobe
2 20 (4.32%) Microsoft
3 13 (2.81%) Google
4 10 (2.16%) EMC
5 4 (0.86%) Agilent
5 4 (0.86%) SAP
6 3 (0.65%) Bloomberg
6 3 (0.65%) Guidewire
6 3 (0.65%) Oracle
7 2 (0.43%) Alteryx
7 2 (0.43%) Autodesk
7 2 (0.43%) Databricks
7 2 (0.43%) IBM
8 1 (0.22%) Murex
8 1 (0.22%) Pega
8 1 (0.22%) Sitecore
8 1 (0.22%) Splunk
8 1 (0.22%) VMware
8 1 (0.22%) Xilinx