Security Engineer Jobs in England

Security Engineer
UK > England

The median Security Engineer salary in England is £55,000 per year, according to job vacancies posted during the 6 months leading to 28 May 2025.

The table below provides salary benchmarking and summary statistics, comparing them to the same period in the previous two years.

6 months to
28 May 2025
Same period 2024 Same period 2023
Rank 272 361 394
Rank change year-on-year +89 +33 +44
Permanent jobs requiring a Security Engineer 567 631 710
As % of all permanent jobs advertised in England 1.17% 0.71% 0.82%
As % of the Job Titles category 1.29% 0.75% 0.89%
Number of salaries quoted 296 518 540
10th Percentile £41,640 £35,000 £41,625
25th Percentile £48,869 £45,000 £51,750
Median annual salary (50th Percentile) £55,000 £60,000 £70,000
Median % change year-on-year -8.33% -14.29% +3.70%
75th Percentile £77,500 £81,250 £87,500
90th Percentile £92,500 £92,500 £102,500
UK median annual salary £55,000 £60,000 £68,515
% change year-on-year -8.33% -12.43% +5.41%

All Permanent IT Job Vacancies
England

For comparison with the information above, the following table provides summary statistics for all permanent IT job vacancies in England. Most job vacancies include a discernible job title that can be normalized. As such, the figures in the second row provide an indication of the number of permanent jobs in our overall sample.

Permanent vacancies in England with a recognized job title 43,919 83,679 79,671
% of permanent jobs with a recognized job title 90.79% 94.64% 91.48%
Number of salaries quoted 23,116 62,210 50,998
10th Percentile £29,250 £28,500 £32,750
25th Percentile £41,250 £38,084 £45,000
Median annual salary (50th Percentile) £56,000 £52,500 £60,800
Median % change year-on-year +6.67% -13.65% +1.33%
75th Percentile £75,000 £71,250 £81,250
90th Percentile £97,500 £90,000 £100,000
UK median annual salary £55,000 £52,500 £60,000
% change year-on-year +4.76% -12.50% -

Security Engineer
Job Vacancy Trend in England

Job postings that featured Security Engineer in the job title as a proportion of all IT jobs advertised in England.
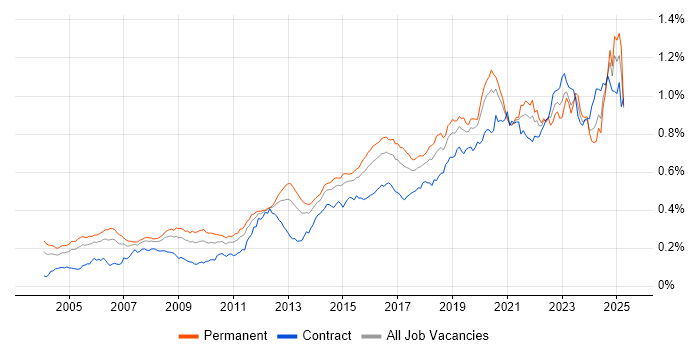
Job vacancy trend for Security Engineer in England

Security Engineer
Salary Trend in England

3-month moving average salary quoted in jobs citing Security Engineer in England.

Salary trend for Security Engineer in England

Security Engineer
Salary Histogram in England

Salary distribution for jobs citing Security Engineer in England over the 6 months to 28 May 2025.

Salary histogram for Security Engineer in England

Security Engineer
Job Locations in England

The table below looks at the demand and provides a guide to the median salaries quoted in IT jobs citing Security Engineer within the England region over the 6 months to 28 May 2025. The 'Rank Change' column provides an indication of the change in demand within each location based on the same 6 month period last year.

Location Rank Change
on Same Period
Last Year
Matching
Permanent
IT Job Ads
Median Salary
Past 6 Months
Median Salary
% Change
on Same Period
Last Year
Live
Jobs
Midlands +165 220 £49,000 -14.78% 80
West Midlands +141 149 £50,000 -16.67% 57
London -4 129 £75,000 -6.25% 258
South East +58 88 £53,000 +11.58% 121
North of England +19 84 £55,000 +4.76% 95
East Midlands +89 71 £44,500 -19.09% 23
North West +14 69 £55,000 - 63
South West +130 35 £51,058 +11.96% 81
Yorkshire +32 10 £52,500 +10.53% 21
East of England +27 10 £46,250 -19.57% 46
North East +43 5 £57,500 +16.27% 11
Security Engineer
UK

Security Engineer Skill Set
Top 30 Co-occurring Skills and Capabilities in England

For the 6 months to 28 May 2025, Security Engineer job roles required the following skills and capabilities in order of popularity. The figures indicate the absolute number co-occurrences and as a proportion of all permanent job ads across the England region featuring Security Engineer in the job title.

1 341 (60.14%) Cybersecurity
2 301 (53.09%) Degree
3 230 (40.56%) BPSS Clearance
4 222 (39.15%) NIST
5 215 (37.92%) ISO/IEC 27001
6 213 (37.57%) Risk Management
6 213 (37.57%) Information Security
7 194 (34.22%) CISSP
8 174 (30.69%) CISM
9 172 (30.34%) Security Testing
10 154 (27.16%) JSP 440
11 150 (26.46%) Cyber Resilience
12 149 (26.28%) Project Management
13 147 (25.93%) RMADS
13 147 (25.93%) CESG Certified Professional
14 110 (19.40%) Azure
15 97 (17.11%) Cloud Security
16 95 (16.75%) Firewall
17 92 (16.23%) Social Skills
18 91 (16.05%) Microsoft
19 80 (14.11%) AWS
20 79 (13.93%) Finance
21 72 (12.70%) Computer Science
22 66 (11.64%) Vulnerability Management
22 66 (11.64%) Security Posture
23 64 (11.29%) PowerShell
24 63 (11.11%) Network Security
25 60 (10.58%) Python
26 57 (10.05%) Problem-Solving
26 57 (10.05%) Incident Response

Security Engineer Skill Set
Co-occurring Skills and Capabilities in England by Category

The follow tables expand on the table above by listing co-occurrences grouped by category. The same employment type, locality and period is covered with up to 20 co-occurrences shown in each of the following categories:

Application Platforms
1 4 (0.71%) Microsoft Exchange
1 4 (0.71%) SharePoint
2 3 (0.53%) Confluence
3 1 (0.18%) IIS
Applications
1 1 (0.18%) MS Visio
Business Applications
1 1 (0.18%) C-CURE
Cloud Services
1 110 (19.40%) Azure
2 80 (14.11%) AWS
3 28 (4.94%) PaaS
4 26 (4.59%) Microsoft 365
5 22 (3.88%) Entra ID
6 20 (3.53%) Azure DevOps
7 18 (3.17%) Azure Sentinel
7 18 (3.17%) GCP
8 12 (2.12%) SaaS
9 11 (1.94%) Cloud Computing
9 11 (1.94%) Microsoft Purview
10 10 (1.76%) IaaS
11 8 (1.41%) GitHub
12 4 (0.71%) Azure AKS
12 4 (0.71%) OneDrive
12 4 (0.71%) Serverless
13 3 (0.53%) Amazon GuardDuty
13 3 (0.53%) AWS Lambda
13 3 (0.53%) IBM Cloud
13 3 (0.53%) Snowflake
Communications & Networking
1 95 (16.75%) Firewall
2 63 (11.11%) Network Security
3 31 (5.47%) VPN
4 27 (4.76%) BGP
5 24 (4.23%) OSPF
6 23 (4.06%) DNS
6 23 (4.06%) EIGRP
7 20 (3.53%) TCP/IP
8 16 (2.82%) Wireless
9 13 (2.29%) DHCP
9 13 (2.29%) HTTP
10 11 (1.94%) Intrusion Detection
10 11 (1.94%) WAN
11 9 (1.59%) SMTP
12 6 (1.06%) Cisco ASA
12 6 (1.06%) SD-WAN
12 6 (1.06%) VLAN
13 4 (0.71%) HTTPS
13 4 (0.71%) LAN
13 4 (0.71%) MPLS
Database & Business Intelligence
1 6 (1.06%) PostgreSQL
2 3 (0.53%) SQL Server
3 1 (0.18%) Big Data
3 1 (0.18%) DB2
3 1 (0.18%) Elasticsearch
3 1 (0.18%) GIS
3 1 (0.18%) Hadoop
3 1 (0.18%) MongoDB
Development Applications
1 8 (1.41%) Git
2 5 (0.88%) Jenkins
3 3 (0.53%) Bitbucket
3 3 (0.53%) GitLab
3 3 (0.53%) JIRA
4 2 (0.35%) Robot Framework
General
1 92 (16.23%) Social Skills
2 79 (13.93%) Finance
3 27 (4.76%) Law
4 26 (4.59%) Analytical Skills
5 24 (4.23%) Banking
6 16 (2.82%) Inclusion and Diversity
6 16 (2.82%) Pharmaceutical
7 14 (2.47%) Telecoms
8 10 (1.76%) Legal
9 9 (1.59%) Manufacturing
10 8 (1.41%) Retail
11 7 (1.23%) Organisational Skills
12 6 (1.06%) Influencing Skills
13 4 (0.71%) Local Government
13 4 (0.71%) Marketing
14 3 (0.53%) Automotive
14 3 (0.53%) Documentation Skills
14 3 (0.53%) Police
15 2 (0.35%) Games
15 2 (0.35%) Investment Banking
Libraries, Frameworks & Software Standards
1 20 (3.53%) YAML
2 12 (2.12%) REST
3 9 (1.59%) React
4 8 (1.41%) GraphQL
5 7 (1.23%) AngularJS
6 6 (1.06%) Middleware
7 5 (0.88%) SailPoint
7 5 (0.88%) SLSA
8 4 (0.71%) .NET
8 4 (0.71%) Web Services
9 2 (0.35%) Azure Blueprints
9 2 (0.35%) Django
9 2 (0.35%) JSON
9 2 (0.35%) OAuth
9 2 (0.35%) OAuth2
10 1 (0.18%) 802.1X
10 1 (0.18%) Elastic Stack
10 1 (0.18%) Kafka
10 1 (0.18%) LDAP
10 1 (0.18%) Microsoft Graph
Miscellaneous
1 66 (11.64%) Security Posture
2 26 (4.59%) CCTV
3 25 (4.41%) Management Information System
4 17 (3.00%) Cloud Native
5 16 (2.82%) Cyber Threat
6 12 (2.12%) Public Cloud
7 11 (1.94%) Cloud Security Posture
7 11 (1.94%) Product Ownership
8 10 (1.76%) Greenfield Project
9 9 (1.59%) Hybrid Cloud
10 8 (1.41%) Driving Licence
10 8 (1.41%) PKI
11 7 (1.23%) Security Operations Centre
12 6 (1.06%) Mobile App
13 5 (0.88%) Blog
13 5 (0.88%) Self-Motivation
14 4 (0.71%) Analytical Mindset
14 4 (0.71%) Cyber Defence
14 4 (0.71%) Cyberattack
15 3 (0.53%) Virtual Team
Operating Systems
1 29 (5.11%) Windows
2 25 (4.41%) Linux
3 16 (2.82%) Windows Server
4 15 (2.65%) Red Hat Enterprise Linux
5 4 (0.71%) Android
5 4 (0.71%) Apple iOS
6 3 (0.53%) VMS
6 3 (0.53%) Windows Server 2019
7 2 (0.35%) Rocky
8 1 (0.18%) Mac OS
8 1 (0.18%) Windows 10
8 1 (0.18%) Windows Server 2012
8 1 (0.18%) Windows Server 2016
Processes & Methodologies
1 341 (60.14%) Cybersecurity
2 213 (37.57%) Information Security
2 213 (37.57%) Risk Management
3 172 (30.34%) Security Testing
4 150 (26.46%) Cyber Resilience
5 149 (26.28%) Project Management
6 97 (17.11%) Cloud Security
7 72 (12.70%) Computer Science
8 66 (11.64%) Vulnerability Management
9 57 (10.05%) Incident Response
9 57 (10.05%) Problem-Solving
10 52 (9.17%) SIEM
11 49 (8.64%) DevOps
12 48 (8.47%) CI/CD
12 48 (8.47%) DevSecOps
13 44 (7.76%) Application Security
14 43 (7.58%) Systems Engineering
15 41 (7.23%) Threat Modelling
16 40 (7.05%) Security Operations
17 38 (6.70%) Product Strategy
Programming Languages
1 64 (11.29%) PowerShell
2 60 (10.58%) Python
3 16 (2.82%) Bash
4 13 (2.29%) Java
5 11 (1.94%) TypeScript
6 10 (1.76%) C++
7 9 (1.59%) Go
7 9 (1.59%) Perl
8 8 (1.41%) C
8 8 (1.41%) Kusto Query Language
9 4 (0.71%) JavaScript
9 4 (0.71%) Kotlin
9 4 (0.71%) Objective-C
9 4 (0.71%) Rust
9 4 (0.71%) SQL
10 2 (0.35%) Bicep
10 2 (0.35%) Solidity
11 1 (0.18%) Ruby
Qualifications
1 301 (53.09%) Degree
2 230 (40.56%) BPSS Clearance
3 194 (34.22%) CISSP
4 174 (30.69%) CISM
5 147 (25.93%) CESG Certified Professional
6 51 (8.99%) Security Cleared
7 45 (7.94%) SC Cleared
8 27 (4.76%) DV Cleared
9 23 (4.06%) Computer Science Degree
10 21 (3.70%) Cisco Certification
10 21 (3.70%) Master's Degree
11 19 (3.35%) HNC
11 19 (3.35%) HND
12 17 (3.00%) CEH
13 15 (2.65%) AWS Certification
13 15 (2.65%) GIAC
14 13 (2.29%) SANS
15 11 (1.94%) (ISC)2 CCSP
16 10 (1.76%) CISA
16 10 (1.76%) CompTIA Security+
Quality Assurance & Compliance
1 222 (39.15%) NIST
2 215 (37.92%) ISO/IEC 27001
3 154 (27.16%) JSP 440
4 147 (25.93%) RMADS
5 42 (7.41%) GDPR
6 36 (6.35%) NCSC
7 20 (3.53%) Cyber Essentials
8 14 (2.47%) Accessibility
9 13 (2.29%) PCI DSS
10 12 (2.12%) Cyber Essentials PLUS
11 8 (1.41%) GRC
12 7 (1.23%) HIPAA
13 5 (0.88%) SLA
13 5 (0.88%) SOC 2
14 4 (0.71%) California Consumer Privacy Act
15 3 (0.53%) ISO/IEC 27002 (supersedes ISO/IEC 17799)
15 3 (0.53%) Sarbanes-Oxley
16 1 (0.18%) ISO/IEC 27005
System Software
1 16 (2.82%) Virtual Machines
2 15 (2.65%) Active Directory
3 9 (1.59%) VMware ESXi
4 6 (1.06%) Docker
4 6 (1.06%) VMware Infrastructure
5 4 (0.71%) vSphere
6 3 (0.53%) Firmware
6 3 (0.53%) Hyper-V
7 1 (0.18%) BitLocker
Systems Management
1 26 (4.59%) Terraform
2 17 (3.00%) FortiGate
2 17 (3.00%) Microsoft Intune
3 12 (2.12%) Ansible
3 12 (2.12%) Nessus
4 11 (1.94%) Kubernetes
5 6 (1.06%) SCCM
6 5 (0.88%) CASB
6 5 (0.88%) Single Sign-On
7 4 (0.71%) QRadar
8 3 (0.53%) vCenter Server
8 3 (0.53%) WSUS
9 2 (0.35%) EnCase
9 2 (0.35%) FTK
9 2 (0.35%) Host Intrusion Detection System
9 2 (0.35%) Istio
9 2 (0.35%) linkerd
9 2 (0.35%) RSA Security Analytics
10 1 (0.18%) Active Directory Federation Services
10 1 (0.18%) Computer Incident Response Team
Vendors
1 91 (16.05%) Microsoft
2 50 (8.82%) Cisco
3 33 (5.82%) Fortinet
4 19 (3.35%) VMware
5 17 (3.00%) Splunk
6 16 (2.82%) Juniper
7 14 (2.47%) Palo Alto
8 13 (2.29%) Google
9 11 (1.94%) Tenable
10 10 (1.76%) CrowdStrike
11 7 (1.23%) CyberArk
12 6 (1.06%) Okta
12 6 (1.06%) Ping Identity
12 6 (1.06%) ServiceNow
13 5 (0.88%) Qualys
14 4 (0.71%) AlienVault
14 4 (0.71%) Extreme Networks
14 4 (0.71%) IBM
15 3 (0.53%) Meraki
15 3 (0.53%) Rapid7