Front End Development Jobs in England

Front End Development (Client-Side Development)
UK > England

The following table provides summary statistics for permanent job vacancies advertised in England with a requirement for Front End Development skills. Included is a benchmarking guide to the salaries offered in vacancies that have cited Front End Development over the 6 months to 27 April 2024 with a comparison to the same period in the previous 2 years.

6 months to
27 Apr 2024
Same period 2023 Same period 2022
Rank 227 212 84
Rank change year-on-year -15 -128 -12
Permanent jobs citing Front End Development 1,094 1,682 5,201
As % of all permanent jobs advertised in England 1.29% 1.80% 3.98%
As % of the Processes & Methodologies category 1.50% 1.89% 4.16%
Number of salaries quoted 939 1,141 2,771
10th Percentile £32,500 £40,000 £37,500
25th Percentile £42,500 £47,500 £47,500
Median annual salary (50th Percentile) £60,000 £65,000 £65,000
Median % change year-on-year -7.69% - +23.81%
75th Percentile £77,500 £81,250 £85,000
90th Percentile £90,000 £102,500 £98,750
UK median annual salary £60,000 £62,500 £62,500
% change year-on-year -4.00% - +19.05%

All Process and Methodology Skills
England

Front End Development is in the Processes and Methodologies category. The following table is for comparison with the above and provides summary statistics for all permanent job vacancies advertised in England with a requirement for process or methodology skills.

Permanent vacancies with a requirement for process or methodology skills 72,814 89,178 125,034
As % of all permanent jobs advertised in England 85.85% 95.66% 95.65%
Number of salaries quoted 53,731 52,642 73,765
10th Percentile £29,000 £34,250 £33,327
25th Percentile £39,750 £46,000 £44,250
Median annual salary (50th Percentile) £55,000 £62,500 £60,000
Median % change year-on-year -12.00% +4.17% +9.09%
75th Percentile £73,750 £82,500 £80,000
90th Percentile £93,750 £101,250 £97,500
UK median annual salary £55,000 £62,000 £60,000
% change year-on-year -11.29% +3.33% +9.09%

Front End Development
Job Vacancy Trend in England

Job postings citing Front End Development as a proportion of all IT jobs advertised in England.
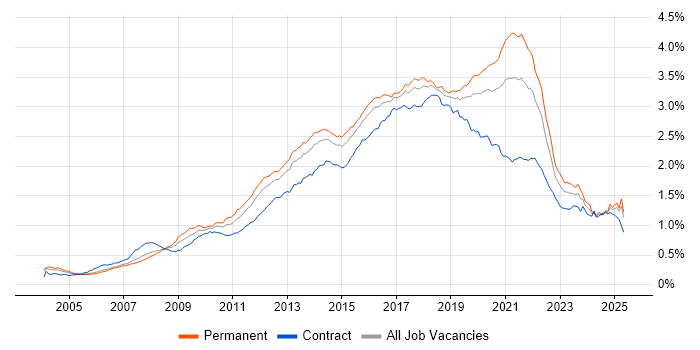
Job vacancy trend for Front End Development in England

Front End Development
Salary Trend in England

3-month moving average salary quoted in jobs citing Front End Development in England.

Salary trend for Front End Development in England

Front End Development
Salary Histogram in England

Salary distribution for jobs citing Front End Development in England over the 6 months to 27 April 2024.

Salary histogram for Front End Development in England

Front End Development
Job Locations in England

The table below looks at the demand and provides a guide to the median salaries quoted in IT jobs citing Front End Development within the England region over the 6 months to 27 April 2024. The 'Rank Change' column provides an indication of the change in demand within each location based on the same 6 month period last year.

Location Rank Change
on Same Period
Last Year
Matching
Permanent
IT Job Ads
Median Salary
Past 6 Months
Median Salary
% Change
on Same Period
Last Year
Live
Jobs
London -73 322 £80,000 +14.29% 130
North of England +64 267 £50,000 - 84
South East -34 171 £60,000 - 25
North West +43 161 £53,847 -2.10% 61
Midlands +58 148 £42,500 -22.73% 25
South West +23 122 £50,000 -9.09% 22
West Midlands +82 99 £45,000 -24.05% 19
Yorkshire +61 80 £45,000 - 17
East of England -41 54 £70,750 +15.98% 26
East Midlands -15 48 £40,000 -27.27% 6
North East +13 26 £52,500 +10.53% 8
Front End Development
UK

Front End Development
Co-occurring Skills and Capabilities in England by Category

The follow tables expand on the table above by listing co-occurrences grouped by category. The same employment type, locality and period is covered with up to 20 co-occurrences shown in each of the following categories:

Application Platforms
1 66 (6.03%) CMS
2 54 (4.94%) WordPress
3 37 (3.38%) Tuxedo
4 17 (1.55%) JBoss
4 17 (1.55%) Red Hat Fuse
5 16 (1.46%) Apache
6 15 (1.37%) Headless CMS
7 13 (1.19%) nginx
8 10 (0.91%) Apache Airflow
8 10 (0.91%) Confluence
9 8 (0.73%) IIS
10 6 (0.55%) Ethereum
11 5 (0.46%) Kentico
11 5 (0.46%) SharePoint
11 5 (0.46%) Umbraco
12 3 (0.27%) Cloud Foundry
12 3 (0.27%) SAS
13 2 (0.18%) Drupal
13 2 (0.18%) Moodle
14 1 (0.091%) Apache Spark
Applications
1 20 (1.83%) Adobe XD
2 17 (1.55%) Photoshop
3 7 (0.64%) Adobe Illustrator
4 5 (0.46%) Adobe Creative Suite
4 5 (0.46%) Microsoft Office
5 4 (0.37%) Maya
5 4 (0.37%) Microsoft Excel
5 4 (0.37%) Microsoft PowerPoint
6 3 (0.27%) Sketch
7 2 (0.18%) Chatbot
7 2 (0.18%) Notion
8 1 (0.091%) InVision
Business Applications
1 26 (2.38%) Shopify
2 5 (0.46%) Magento
3 3 (0.27%) Payment Gateway
4 1 (0.091%) JDE EnterpriseOne
Cloud Services
1 248 (22.67%) AWS
2 200 (18.28%) Azure
3 72 (6.58%) SaaS
4 45 (4.11%) Figma
4 45 (4.11%) GCP
5 43 (3.93%) Azure DevOps
6 33 (3.02%) GitHub
7 25 (2.29%) npm
8 19 (1.74%) Serverless
9 17 (1.55%) Google Analytics
10 14 (1.28%) AWS Lambda
11 10 (0.91%) Azure Service Bus
11 10 (0.91%) Cloud Computing
12 7 (0.64%) Amazon S3
12 7 (0.64%) Firebase
13 6 (0.55%) Adobe Creative Cloud
13 6 (0.55%) Amazon Kinesis
13 6 (0.55%) dbt
13 6 (0.55%) Google Tag Manager
13 6 (0.55%) WeChat
Communications & Networking
1 9 (0.82%) Internet
2 8 (0.73%) DNS
3 7 (0.64%) OpenVPN
4 6 (0.55%) Wi-Fi
5 5 (0.46%) HTTP
6 2 (0.18%) SSH
7 1 (0.091%) MQTT
7 1 (0.091%) Unified Communications
Database & Business Intelligence
1 73 (6.67%) SQL Server
2 66 (6.03%) MySQL
3 42 (3.84%) PostgreSQL
4 39 (3.56%) Relational Database
5 27 (2.47%) NoSQL
6 22 (2.01%) Redis
7 13 (1.19%) Azure SQL Database
7 13 (1.19%) MongoDB
8 11 (1.01%) MS Access
9 10 (0.91%) Apache Ignite
9 10 (0.91%) Elasticsearch
10 9 (0.82%) Amazon RDS
11 6 (0.55%) MariaDB
12 4 (0.37%) Big Data
12 4 (0.37%) Power BI
13 3 (0.27%) Amazon Aurora
13 3 (0.27%) Event Store
13 3 (0.27%) GIS
13 3 (0.27%) Looker
14 2 (0.18%) Metabase
Development Applications
1 223 (20.38%) Git
2 57 (5.21%) Cypress.io
3 52 (4.75%) Selenium
4 42 (3.84%) JIRA
5 30 (2.74%) gulp
5 30 (2.74%) Jenkins
6 28 (2.56%) IntelliJ
7 27 (2.47%) Visual Studio
7 27 (2.47%) webpack
8 22 (2.01%) Bitbucket
9 19 (1.74%) GitLab
9 19 (1.74%) Storybook
10 15 (1.37%) Cucumber
10 15 (1.37%) Jasmine
11 11 (1.01%) Postman
12 9 (0.82%) Eclipse
12 9 (0.82%) Mockito
12 9 (0.82%) Subversion
13 8 (0.73%) Maven
13 8 (0.73%) Vite
General
1 220 (20.11%) Social Skills
2 151 (13.80%) Finance
3 69 (6.31%) Marketing
4 64 (5.85%) Analytical Skills
5 55 (5.03%) Public Sector
6 47 (4.30%) Retail
7 35 (3.20%) Manufacturing
8 29 (2.65%) Law
9 28 (2.56%) Games
10 21 (1.92%) Inclusion and Diversity
11 18 (1.65%) Tech for Good
12 14 (1.28%) Automotive
12 14 (1.28%) Front Office
12 14 (1.28%) Organisational Skills
13 13 (1.19%) Financial Institution
13 13 (1.19%) Health Technology
13 13 (1.19%) Legal
13 13 (1.19%) Telecoms
14 12 (1.10%) Advertising
15 11 (1.01%) Electronics
Job Titles
1 848 (77.51%) Developer
2 474 (43.33%) Front-End Developer (Client-Side Developer)
3 349 (31.90%) Senior
4 246 (22.49%) Senior Developer
5 155 (14.17%) Senior Front-End Developer
6 130 (11.88%) Lead
7 100 (9.14%) React Developer
8 86 (7.86%) Full Stack Developer
9 85 (7.77%) Software Engineer
10 68 (6.22%) Lead Developer
11 63 (5.76%) Software Developer
12 50 (4.57%) Web Developer
13 46 (4.20%) .NET Developer
14 45 (4.11%) PHP Developer
15 43 (3.93%) Angular Developer
16 42 (3.84%) Front-End Engineer (Client-Side Engineer)
17 39 (3.56%) Senior Software Engineer
17 39 (3.56%) Technical Leader
18 33 (3.02%) C# Developer
19 32 (2.93%) Senior React Developer
Libraries, Frameworks & Software Standards
1 521 (47.62%) CSS
2 503 (45.98%) HTML
3 494 (45.16%) React
4 263 (24.04%) AngularJS
5 201 (18.37%) .NET
6 195 (17.82%) Node.js
7 154 (14.08%) Vue
8 131 (11.97%) HTML5
9 123 (11.24%) RESTful
10 116 (10.60%) CSS3
11 106 (9.69%) REST
12 100 (9.14%) Sass
13 94 (8.59%) .NET Core
14 80 (7.31%) jQuery
15 76 (6.95%) Jest
16 70 (6.40%) Redux
17 57 (5.21%) .NET Framework
17 57 (5.21%) ASP.NET
18 55 (5.03%) Next.js
19 53 (4.84%) GraphQL
Miscellaneous
1 56 (5.12%) Greenfield Project
2 42 (3.84%) Mobile App
3 28 (2.56%) Onboarding
4 25 (2.29%) Product Ownership
5 23 (2.10%) Foreign Exchange (FX)
6 20 (1.83%) Client/Server
7 18 (1.65%) Self-Motivation
8 15 (1.37%) Data Structures
9 14 (1.28%) Blockchain
9 14 (1.28%) Cloud Native
10 12 (1.10%) Algorithms
11 11 (1.01%) Animation
12 10 (0.91%) Fixed Income
12 10 (0.91%) Social Media
13 9 (0.82%) Low-Code
14 8 (0.73%) Data Protection Act
14 8 (0.73%) Digital Media
14 8 (0.73%) Virtual Team
15 6 (0.55%) Graphic Design
15 6 (0.55%) Hedge funds
Operating Systems
1 45 (4.11%) Linux
2 11 (1.01%) Android
3 10 (0.91%) Windows
4 8 (0.73%) Apple iOS
5 7 (0.64%) CentOS
6 5 (0.46%) Ubuntu
7 3 (0.27%) Mac OS
8 1 (0.091%) Unix
8 1 (0.091%) VMS
Processes & Methodologies
1 386 (35.28%) Agile
2 323 (29.52%) User Experience
3 250 (22.85%) Problem-Solving
4 234 (21.39%) Full Stack Development
5 211 (19.29%) Software Engineering
6 184 (16.82%) Computer Science
7 180 (16.45%) UX Design
8 151 (13.80%) Mentoring
9 150 (13.71%) Web Development
10 136 (12.43%) DevOps
11 116 (10.60%) E-Commerce
12 91 (8.32%) CI/CD
13 87 (7.95%) Microservices
14 79 (7.22%) Artificial Intelligence
14 79 (7.22%) Continuous Integration
15 75 (6.86%) Clean Code
15 75 (6.86%) Roadmaps
16 66 (6.03%) Test Automation
17 62 (5.67%) Analytics
17 62 (5.67%) TDD
Programming Languages
1 616 (56.31%) JavaScript
2 397 (36.29%) TypeScript
3 239 (21.85%) C#
4 171 (15.63%) SQL
5 167 (15.27%) Java
6 143 (13.07%) PHP
7 98 (8.96%) Python
8 42 (3.84%) COBOL
8 42 (3.84%) Micro Focus COBOL
9 28 (2.56%) T-SQL
10 18 (1.65%) Go
11 14 (1.28%) VB.NET
12 7 (0.64%) Ruby
12 7 (0.64%) Shell Script
13 6 (0.55%) C
13 6 (0.55%) Kotlin
13 6 (0.55%) Rust
14 5 (0.46%) C++
15 4 (0.37%) Scala
16 3 (0.27%) Bash
Qualifications
1 235 (21.48%) Degree
2 87 (7.95%) Computer Science Degree
3 69 (6.31%) Security Cleared
4 59 (5.39%) SC Cleared
5 35 (3.20%) Master's Degree
6 7 (0.64%) BPSS Clearance
7 6 (0.55%) HND
8 5 (0.46%) Azure Certification
9 3 (0.27%) DBS Check
10 2 (0.18%) DV Cleared
11 1 (0.091%) PMI Certification
11 1 (0.091%) Postgraduate
Quality Assurance & Compliance
1 68 (6.22%) Accessibility
2 54 (4.94%) WCAG
3 47 (4.30%) QA
4 9 (0.82%) GDPR
5 4 (0.37%) Data Quality
6 3 (0.27%) HIPAA
7 2 (0.18%) ISO/IEC 27001
7 2 (0.18%) WAI
8 1 (0.091%) Actionable Recommendations
8 1 (0.091%) ISO 9001
System Software
1 137 (12.52%) Docker
2 4 (0.37%) VMware ESXi
3 3 (0.27%) Active Directory
Systems Management
1 84 (7.68%) Kubernetes
2 12 (1.10%) Terraform
3 6 (0.55%) Ansible
4 4 (0.37%) Rancher
5 1 (0.091%) cPanel
5 1 (0.091%) Enterprise Manager Cloud Control
5 1 (0.091%) Grafana
5 1 (0.091%) Oracle Enterprise Manager
5 1 (0.091%) Prometheus
Vendors
1 99 (9.05%) Microsoft
2 64 (5.85%) Google
3 54 (4.94%) Adobe
4 46 (4.20%) Oracle
5 42 (3.84%) Micro Focus
6 11 (1.01%) SAP
6 11 (1.01%) WooCommerce
7 9 (0.82%) IBM
8 8 (0.73%) Atlassian
8 8 (0.73%) DevExpress
8 8 (0.73%) Facebook
9 5 (0.46%) Xamarin
10 4 (0.37%) Mercator
10 4 (0.37%) Salesforce
10 4 (0.37%) VMware
11 3 (0.27%) OutSystems
11 3 (0.27%) Sybase
12 2 (0.18%) Apple
12 2 (0.18%) F5
13 1 (0.091%) Splunk