User Experience Jobs in London

UX
England > London

The table below provides summary statistics for permanent job vacancies advertised in London requiring User Experience skills. It includes a benchmarking guide to the annual salaries offered in vacancies that cited User Experience over the 6 months leading up to 9 May 2025, comparing them to the same period in the previous two years.

6 months to
9 May 2025
Same period 2024 Same period 2023
Rank 60 107 51
Rank change year-on-year +47 -56 -24
Permanent jobs citing User Experience 607 655 1,923
As % of all permanent jobs advertised in London 4.75% 2.78% 5.59%
As % of the Processes & Methodologies category 4.94% 3.05% 5.86%
Number of salaries quoted 388 494 1,235
10th Percentile £41,250 £39,500 £45,000
25th Percentile £55,000 £47,500 £52,500
Median annual salary (50th Percentile) £72,500 £65,000 £70,000
Median % change year-on-year +11.54% -7.14% +3.70%
75th Percentile £92,500 £83,438 £87,500
90th Percentile £117,500 £100,000 £107,500
England median annual salary £57,500 £51,000 £65,000
% change year-on-year +12.75% -21.54% +8.33%

All Process and Methodology Skills
London

User Experience falls under the Processes and Methodologies category. For comparison with the information above, the following table provides summary statistics for all permanent job vacancies requiring process or methodology skills in London.

Permanent vacancies with a requirement for process or methodology skills 12,287 21,502 32,794
As % of all permanent jobs advertised in London 96.16% 91.13% 95.35%
Number of salaries quoted 7,368 15,970 23,578
10th Percentile £42,500 £37,800 £43,477
25th Percentile £56,250 £51,750 £55,000
Median annual salary (50th Percentile) £75,000 £70,565 £75,000
Median % change year-on-year +6.28% -5.91% +7.14%
75th Percentile £100,000 £95,000 £95,000
90th Percentile £123,750 £115,000 £115,000
England median annual salary £57,500 £55,000 £62,500
% change year-on-year +4.55% -12.00% +4.17%

User Experience
Job Vacancy Trend in London

Job postings citing User Experience as a proportion of all IT jobs advertised in London.
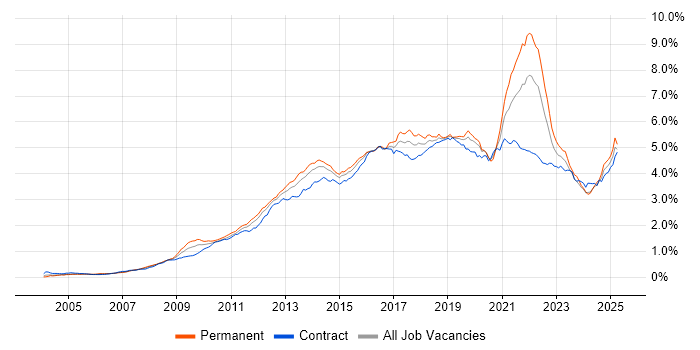
Job vacancy trend for User Experience in London

User Experience
Salary Trend in London

3-month moving average salary quoted in jobs citing User Experience in London.

Salary trend for User Experience in London

User Experience
Salary Histogram in London

Salary distribution for jobs citing User Experience in London over the 6 months to 9 May 2025.

Salary histogram for User Experience in London

User Experience
Job Locations in London

The table below looks at the demand and provides a guide to the median salaries quoted in IT jobs citing User Experience within the London region over the 6 months to 9 May 2025. The 'Rank Change' column provides an indication of the change in demand within each location based on the same 6 month period last year.

Location Rank Change
on Same Period
Last Year
Matching
Permanent
IT Job Ads
Median Salary
Past 6 Months
Median Salary
% Change
on Same Period
Last Year
Live
Jobs
Central London +34 141 £75,000 +9.09% 83
South London +18 13 £34,000 -47.69% 14
West London +29 12 £30,000 -55.56% 29
East London +4 8 £72,250 -6.17% 13
User Experience
England

User Experience
Co-occurring Skills and Capabilities in London by Category

The follow tables expand on the table above by listing co-occurrences grouped by category. The same employment type, locality and period is covered with up to 20 co-occurrences shown in each of the following categories:

Application Platforms
1 28 (4.61%) CMS
2 17 (2.80%) SharePoint
3 16 (2.64%) WordPress
4 12 (1.98%) Confluence
5 11 (1.81%) Microsoft Exchange
6 10 (1.65%) Drupal
6 10 (1.65%) nginx
7 7 (1.15%) Apache
7 7 (1.15%) Apache Airflow
8 4 (0.66%) Liferay
9 3 (0.49%) Apache Spark
10 2 (0.33%) OpenEdge
11 1 (0.16%) Apache Solr
11 1 (0.16%) Appian
11 1 (0.16%) Oracle Workflow
11 1 (0.16%) SharePoint Server
11 1 (0.16%) Umbraco
Applications
1 24 (3.95%) Adobe XD
2 17 (2.80%) Sketch
3 13 (2.14%) Microsoft Excel
4 11 (1.81%) Microsoft Office
5 9 (1.48%) Microsoft PowerPoint
5 9 (1.48%) Trello
6 7 (1.15%) Adobe Premiere
6 7 (1.15%) InVision
7 6 (0.99%) MS Visio
8 4 (0.66%) Adobe Creative Suite
9 3 (0.49%) UserZoom
10 2 (0.33%) Adobe Illustrator
10 2 (0.33%) Blender
10 2 (0.33%) InDesign
10 2 (0.33%) Maya
10 2 (0.33%) Photoshop
11 1 (0.16%) Adobe Captivate
11 1 (0.16%) Chatbot
11 1 (0.16%) Final Cut Pro
Business Applications
1 9 (1.48%) Shopify
2 7 (1.15%) Dynamics CRM
3 3 (0.49%) Elite 3E
4 2 (0.33%) Oracle ERP
4 2 (0.33%) Salesforce CRM
5 1 (0.16%) Oracle EBS
5 1 (0.16%) Oracle EBS R12
5 1 (0.16%) Payment Gateway
5 1 (0.16%) SAP ERP
Cloud Services
1 123 (20.26%) AWS
2 92 (15.16%) Azure
3 68 (11.20%) SaaS
4 67 (11.04%) Figma
5 43 (7.08%) GCP
6 36 (5.93%) Microsoft 365
7 26 (4.28%) Power Platform
8 20 (3.29%) Azure DevOps
9 18 (2.97%) Entra ID
9 18 (2.97%) GitHub
9 18 (2.97%) Google Analytics
9 18 (2.97%) Microsoft Copilot
10 14 (2.31%) Adobe Analytics
10 14 (2.31%) Serverless
11 12 (1.98%) Azure AI
11 12 (1.98%) PowerApps
12 10 (1.65%) Dynamics 365
13 9 (1.48%) Amazon S3
13 9 (1.48%) AWS Lambda
13 9 (1.48%) ChatGPT
Communications & Networking
1 4 (0.66%) Intranet
1 4 (0.66%) VPN
2 3 (0.49%) DNS
2 3 (0.49%) NetScaler
2 3 (0.49%) SMS
2 3 (0.49%) TCP/IP
3 2 (0.33%) Broadband
3 2 (0.33%) Firewall
3 2 (0.33%) OpenVPN
3 2 (0.33%) Softphone
3 2 (0.33%) WebEx
3 2 (0.33%) Wireshark
4 1 (0.16%) DHCP
4 1 (0.16%) SSL
4 1 (0.16%) X.21
Database & Business Intelligence
1 47 (7.74%) PostgreSQL
2 27 (4.45%) Tableau
3 14 (2.31%) MySQL
4 13 (2.14%) Power BI
5 12 (1.98%) Relational Database
6 11 (1.81%) SQL Server
7 10 (1.65%) MongoDB
8 8 (1.32%) NoSQL
8 8 (1.32%) RDBMS
9 7 (1.15%) Amazon RDS
10 6 (0.99%) DB2
10 6 (0.99%) Redis
11 5 (0.82%) Metadata
12 4 (0.66%) Azure SQL Database
12 4 (0.66%) Elasticsearch
13 3 (0.49%) Apache Ignite
14 2 (0.33%) Couchbase
15 1 (0.16%) Big Data
15 1 (0.16%) BigQuery
15 1 (0.16%) Oracle BI Publisher
Development Applications
1 35 (5.77%) Git
2 34 (5.60%) JIRA
3 11 (1.81%) Axure RP
4 10 (1.65%) Jenkins
5 9 (1.48%) Jasmine
6 8 (1.32%) Karma Test Runner
7 7 (1.15%) GitLab
7 7 (1.15%) Octopus Deploy
8 6 (0.99%) Balsamiq
8 6 (0.99%) Browser DevTools
8 6 (0.99%) Cypress.io
8 6 (0.99%) webpack
9 4 (0.66%) Visual Studio
10 3 (0.49%) Android Studio
10 3 (0.49%) Artifactory
10 3 (0.49%) Bitbucket
10 3 (0.49%) fastlane
10 3 (0.49%) Maven
10 3 (0.49%) Postman
10 3 (0.49%) TeamCity
General
1 194 (31.96%) Social Skills
2 170 (28.01%) Finance
3 95 (15.65%) Analytical Skills
4 92 (15.16%) Law
5 84 (13.84%) Marketing
6 54 (8.90%) Inclusion and Diversity
7 52 (8.57%) Banking
8 41 (6.75%) Front Office
9 35 (5.77%) Public Sector
10 31 (5.11%) Presentation Skills
11 20 (3.29%) Games
12 16 (2.64%) Local Government
13 15 (2.47%) Publishing
14 14 (2.31%) Investment Banking
15 13 (2.14%) Legal
16 12 (1.98%) Influencing Skills
17 8 (1.32%) Documentation Skills
17 8 (1.32%) Financial Institution
18 6 (0.99%) Back Office
18 6 (0.99%) Retail
Job Titles
1 193 (31.80%) Developer
2 145 (23.89%) Senior
3 59 (9.72%) Front-End Developer (Client-Side Developer)
4 53 (8.73%) React Developer
5 51 (8.40%) Designer
6 50 (8.24%) Analyst
7 47 (7.74%) Senior Developer
7 47 (7.74%) Software Engineer
8 45 (7.41%) Lead
9 36 (5.93%) Architect
10 35 (5.77%) Developer/Software Engineer
10 35 (5.77%) Product Manager
11 32 (5.27%) Solutions Architect
12 29 (4.78%) UX Designer
13 27 (4.45%) Front-End Engineer (Client-Side Engineer)
13 27 (4.45%) Full-Stack Engineer
14 23 (3.79%) UI Developer
15 21 (3.46%) Senior Architect
15 21 (3.46%) Senior Full-Stack Engineer
15 21 (3.46%) Senior Solutions Architect
Libraries, Frameworks & Software Standards
1 135 (22.24%) React
2 100 (16.47%) HTML
3 95 (15.65%) CSS
4 72 (11.86%) Node.js
5 50 (8.24%) Redux
6 47 (7.74%) AngularJS
7 35 (5.77%) HTML5
7 35 (5.77%) RESTful
8 29 (4.78%) CSS3
9 26 (4.28%) Next.js
10 23 (3.79%) .NET
11 17 (2.80%) REST
11 17 (2.80%) WebSockets
12 16 (2.64%) Middleware
12 16 (2.64%) Vue
13 14 (2.31%) Jest
14 13 (2.14%) Sass
15 11 (1.81%) Bootstrap
16 10 (1.65%) GraphQL
16 10 (1.65%) RxJS
Miscellaneous
1 54 (8.90%) Product Ownership
2 48 (7.91%) Mobile App
3 37 (6.10%) Fixed Income
4 20 (3.29%) Algorithms
5 19 (3.13%) Foreign Exchange (FX)
5 19 (3.13%) Social Media
6 17 (2.80%) Analytical Mindset
6 17 (2.80%) Onboarding
7 15 (2.47%) Data Structures
7 15 (2.47%) Educational Technology
8 11 (1.81%) e-Learning
8 11 (1.81%) Enterprise Software
8 11 (1.81%) Management Information System
8 11 (1.81%) Mobile Games
8 11 (1.81%) Self-Motivation
8 11 (1.81%) Team-Oriented Environment
9 8 (1.32%) Equities
10 6 (0.99%) Graphic Design
10 6 (0.99%) Greenfield Project
10 6 (0.99%) Hybrid Cloud
Operating Systems
1 48 (7.91%) Apple iOS
2 41 (6.75%) Android
3 28 (4.61%) Windows
4 23 (3.79%) Linux
5 8 (1.32%) Windows Server
6 6 (0.99%) Windows 10
7 4 (0.66%) Windows Server 2016
7 4 (0.66%) Windows Server 2019
8 3 (0.49%) Mac OS
8 3 (0.49%) Windows Server 2012
9 2 (0.33%) VMS
10 1 (0.16%) Unix
Processes & Methodologies
1 242 (39.87%) Agile
2 158 (26.03%) Problem-Solving
3 147 (24.22%) UX Design
4 115 (18.95%) Roadmaps
5 112 (18.45%) Analytics
6 99 (16.31%) Artificial Intelligence
7 92 (15.16%) Front End Development
8 80 (13.18%) Fintech
9 76 (12.52%) Computer Science
10 74 (12.19%) Continuous Improvement
11 72 (11.86%) Software Engineering
12 71 (11.70%) Product Roadmap
13 66 (10.87%) User Research
14 65 (10.71%) Wireframes
15 64 (10.54%) Mentoring
16 61 (10.05%) DevOps
17 57 (9.39%) User-Centered Design (UCD)
18 54 (8.90%) Full-Stack Development
19 52 (8.57%) User Stories
19 52 (8.57%) Visualisation
Programming Languages
1 163 (26.85%) JavaScript
2 119 (19.60%) TypeScript
3 90 (14.83%) Python
4 60 (9.88%) SQL
5 32 (5.27%) C#
5 32 (5.27%) Java
6 20 (3.29%) Swift
7 19 (3.13%) Kotlin
8 18 (2.97%) PowerShell
9 12 (1.98%) PHP
10 10 (1.65%) Objective-C
11 6 (0.99%) Apex Code
12 5 (0.82%) Ruby
12 5 (0.82%) T-SQL
13 4 (0.66%) Bash
14 3 (0.49%) C++
15 2 (0.33%) Bicep
15 2 (0.33%) Go
15 2 (0.33%) OpenEdge ABL
15 2 (0.33%) Progress 4GL
Qualifications
1 140 (23.06%) Degree
2 48 (7.91%) Computer Science Degree
3 23 (3.79%) Master's Degree
4 18 (2.97%) Security Cleared
5 14 (2.31%) SC Cleared
6 12 (1.98%) Azure Certification
7 11 (1.81%) Microsoft Certification
8 9 (1.48%) DBS Check
9 6 (0.99%) CSPO
10 3 (0.49%) PMI Certification
10 3 (0.49%) PMP
11 2 (0.33%) AAT
11 2 (0.33%) IIBA
11 2 (0.33%) ITIL Certification
11 2 (0.33%) MPhil
11 2 (0.33%) PhD
12 1 (0.16%) BPSS Clearance
12 1 (0.16%) ISTQB
12 1 (0.16%) ISTQB Foundation Certification
12 1 (0.16%) Numerate Degree
Quality Assurance & Compliance
1 82 (13.51%) Accessibility
2 33 (5.44%) QA
3 17 (2.80%) GDPR
4 15 (2.47%) WCAG
5 11 (1.81%) California Consumer Privacy Act
6 7 (1.15%) Data Quality
7 4 (0.66%) Software Quality Assurance
8 3 (0.49%) ISO/IEC 27001
9 2 (0.33%) Actionable Recommendations
9 2 (0.33%) ISO 9001
10 1 (0.16%) 21 CFR Part 11
10 1 (0.16%) Cyber Essentials
10 1 (0.16%) Good Clinical Practice
10 1 (0.16%) SLA
System Software
1 27 (4.45%) Docker
2 25 (4.12%) Active Directory
3 8 (1.32%) VMware Infrastructure
4 4 (0.66%) Virtual Desktop
5 2 (0.33%) vSphere
6 1 (0.16%) Hyper-V
6 1 (0.16%) KVM
6 1 (0.16%) Xen
Systems Management
1 19 (3.13%) Microsoft Intune
2 15 (2.47%) Kubernetes
3 13 (2.14%) SCCM
4 6 (0.99%) Grafana
5 5 (0.82%) Terraform
6 4 (0.66%) Prometheus
7 3 (0.49%) Jamf Pro
8 2 (0.33%) Ansible
8 2 (0.33%) Single Sign-On
9 1 (0.16%) CFEngine
9 1 (0.16%) Kibana
9 1 (0.16%) NetBackup
9 1 (0.16%) Progress Chef
9 1 (0.16%) Puppet
Vendors
1 88 (14.50%) Microsoft
2 53 (8.73%) Adobe
3 42 (6.92%) ServiceNow
4 39 (6.43%) Google
5 22 (3.62%) Salesforce
6 16 (2.64%) YouTube
7 15 (2.47%) SAP
8 12 (1.98%) OpenAI
9 11 (1.81%) Citrix
9 11 (1.81%) Workday
10 9 (1.48%) VMware
11 7 (1.15%) Omniture
11 7 (1.15%) Oracle
12 6 (0.99%) IBM
12 6 (0.99%) Red Hat
13 5 (0.82%) Facebook
14 4 (0.66%) Apple
14 4 (0.66%) Cisco
14 4 (0.66%) Databricks
15 3 (0.49%) Intapp