Telecoms Jobs in the UK excluding London

Telecommunications
UK > UK excluding London

The table below looks at the prevalence of the term Telecoms in permanent job vacancies in the UK excluding London. Included is a benchmarking guide to the salaries offered in vacancies that cited Telecoms over the 6 months leading up to 22 May 2025, comparing them to the same period in the previous two years.

6 months to
22 May 2025
Same period 2024 Same period 2023
Rank 120 116 41
Rank change year-on-year -4 -75 +98
Permanent jobs citing Telecoms 1,011 1,720 3,867
As % of all permanent jobs advertised in the UK excluding London 2.60% 2.40% 6.57%
As % of the General category 3.84% 4.20% 9.56%
Number of salaries quoted 373 1,145 709
10th Percentile £23,731 £24,750 £25,500
25th Percentile £26,929 £30,000 £32,500
Median annual salary (50th Percentile) £32,500 £40,500 £45,000
Median % change year-on-year -19.75% -10.00% -5.26%
75th Percentile £53,000 £55,250 £62,500
90th Percentile £72,500 £70,000 £75,000
UK median annual salary £45,000 £45,000 £55,000
% change year-on-year - -18.18% -

All General Skills
UK excluding London

Telecoms falls under the General Skills category. For comparison with the information above, the following table provides summary statistics for all permanent job vacancies requiring common skills in the UK excluding London.

Permanent vacancies with a requirement for common skills 26,349 41,001 40,439
As % of all permanent jobs advertised in the UK excluding London 67.71% 57.15% 68.69%
Number of salaries quoted 11,717 26,503 18,433
10th Percentile £25,087 £26,000 £28,250
25th Percentile £32,851 £32,500 £37,462
Median annual salary (50th Percentile) £50,000 £47,500 £52,500
Median % change year-on-year +5.26% -9.52% +5.00%
75th Percentile £64,000 £62,500 £67,500
90th Percentile £77,500 £75,000 £81,250
UK median annual salary £55,000 £52,500 £60,000
% change year-on-year +4.76% -12.50% -

Telecoms
Job Vacancy Trend in the UK excluding London

Job postings citing Telecoms as a proportion of all IT jobs advertised in the UK excluding London.
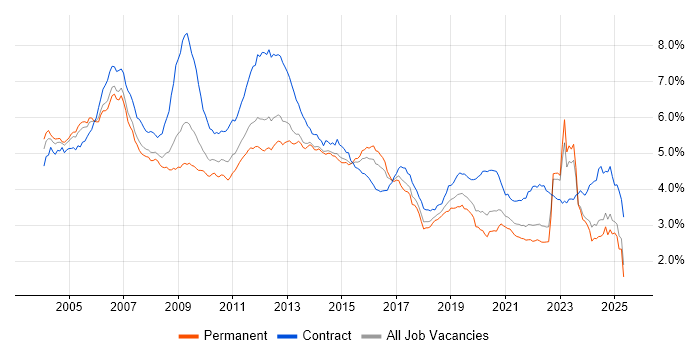
Job vacancy trend for Telecoms in the UK excluding London

Telecoms
Salary Trend in the UK excluding London

3-month moving average salary quoted in jobs citing Telecoms in the UK excluding London.

Salary trend for Telecoms in the UK excluding London

Telecoms
Salary Histogram in the UK excluding London

Salary distribution for jobs citing Telecoms in the UK excluding London over the 6 months to 22 May 2025.

Salary histogram for Telecoms in the UK excluding London

Telecoms
Job Locations in the UK excluding London

The table below looks at the demand and provides a guide to the median salaries quoted in IT jobs citing Telecoms within the UK excluding London region over the 6 months to 22 May 2025. The 'Rank Change' column provides an indication of the change in demand within each location based on the same 6 month period last year.

Location Rank Change
on Same Period
Last Year
Matching
Permanent
IT Job Ads
Median Salary
Past 6 Months
Median Salary
% Change
on Same Period
Last Year
Live
Jobs
Midlands +39 286 £35,000 -12.50% 204
South East -29 273 £31,500 -16.56% 438
North of England +25 245 £34,000 -24.44% 273
West Midlands +68 203 £28,500 -28.75% 124
North West +2 196 £47,683 +12.20% 171
Scotland +131 88 £26,929 -36.64% 70
East Midlands -5 82 £42,500 +8.97% 72
South West -37 53 £28,500 -28.75% 137
East of England -44 46 £45,000 -10.00% 164
Yorkshire +41 41 £29,500 -37.89% 87
Wales +40 25 £27,500 -15.38% 39
North East +31 7 £29,250 +6.36% 22
Northern Ireland +7 4 £57,500 +64.29% 18
Isle of Man +11 2 £91,000 +145.95% 3
Telecoms
UK

Telecoms
Co-occurring Skills and Capabilities in the UK excluding London by Category

The follow tables expand on the table above by listing co-occurrences grouped by category. The same employment type, locality and period is covered with up to 20 co-occurrences shown in each of the following categories:

Application Platforms
1 19 (1.88%) SharePoint
2 7 (0.69%) Microsoft Exchange
3 2 (0.20%) Skype for Business
4 1 (0.099%) Joomla!
4 1 (0.099%) OpenStack
4 1 (0.099%) WordPress
Applications
1 49 (4.85%) Microsoft Office
2 41 (4.06%) Microsoft Excel
3 22 (2.18%) Microsoft PowerPoint
4 3 (0.30%) Chatbot
4 3 (0.30%) MS Visio
5 1 (0.099%) Adobe XD
5 1 (0.099%) AutoCAD
5 1 (0.099%) Microsoft Project
5 1 (0.099%) Photoshop
5 1 (0.099%) SOLIDWORKS
Business Applications
1 22 (2.18%) Dynamics AX
2 7 (0.69%) Dynamics NAV
3 6 (0.59%) SAP ERP
4 1 (0.099%) Dynamics GP
Cloud Services
1 66 (6.53%) Microsoft 365
2 36 (3.56%) AWS
2 36 (3.56%) Azure
3 18 (1.78%) GCP
4 16 (1.58%) SaaS
5 13 (1.29%) Power Platform
6 10 (0.99%) Serverless
7 8 (0.79%) Dynamics 365
7 8 (0.79%) IBM Watson
7 8 (0.79%) PaaS
8 7 (0.69%) AWS Lambda
9 5 (0.49%) OneDrive
10 4 (0.40%) Amazon EC2
10 4 (0.40%) Amazon S3
11 2 (0.20%) Amazon SageMaker
11 2 (0.20%) Google Workspace
11 2 (0.20%) OCI
11 2 (0.20%) PowerApps
12 1 (0.099%) Google Docs
12 1 (0.099%) Google Sheets
Communications & Networking
1 88 (8.70%) TCP/IP
2 80 (7.91%) VPN
3 65 (6.43%) 5G
4 61 (6.03%) VoIP
5 43 (4.25%) 4G
6 41 (4.06%) Firewall
7 34 (3.36%) Broadband
8 23 (2.27%) Wireless
9 22 (2.18%) 3GPP
9 22 (2.18%) DNS
10 20 (1.98%) VLAN
11 19 (1.88%) WAN
12 17 (1.68%) IP Telephony
13 16 (1.58%) DHCP
13 16 (1.58%) LAN
14 14 (1.38%) Internet
15 12 (1.19%) Network Security
15 12 (1.19%) PBX
15 12 (1.19%) Wi-Fi
16 10 (0.99%) MPLS
Database & Business Intelligence
1 13 (1.29%) Power BI
2 10 (0.99%) SQL Server
3 8 (0.79%) QlikView
4 4 (0.40%) MySQL
4 4 (0.40%) PostgreSQL
5 3 (0.30%) Big Data
5 3 (0.30%) MongoDB
5 3 (0.30%) NoSQL
6 2 (0.20%) Amazon RDS
6 2 (0.20%) Data Warehouse
6 2 (0.20%) Oracle Exadata
6 2 (0.20%) Tableau
7 1 (0.099%) Apache Cassandra
7 1 (0.099%) Azure SQL Database
7 1 (0.099%) CouchDB
7 1 (0.099%) DynamoDB
7 1 (0.099%) GIS
7 1 (0.099%) SQL Server Integration Services
7 1 (0.099%) SQL Server Reporting Services
7 1 (0.099%) SQLite
Development Applications
1 62 (6.13%) Cucumber
1 62 (6.13%) Robot Framework
2 23 (2.27%) Git
3 16 (1.58%) Jenkins
4 6 (0.59%) JIRA
5 3 (0.30%) GitLab
6 2 (0.20%) Burp Suite
6 2 (0.20%) Metasploit
6 2 (0.20%) Subversion
7 1 (0.099%) Bitbucket
7 1 (0.099%) CMake
7 1 (0.099%) GDB
7 1 (0.099%) Gradle
7 1 (0.099%) IDA Disassembler
7 1 (0.099%) LabVIEW
7 1 (0.099%) Maven
7 1 (0.099%) SQL Server Management Studio (SSMS)
7 1 (0.099%) WinDbg
7 1 (0.099%) WiX
General
1 289 (28.59%) Automotive
2 239 (23.64%) Social Skills
3 184 (18.20%) Finance
4 172 (17.01%) Retail
5 93 (9.20%) Games
6 89 (8.80%) Inclusion and Diversity
7 75 (7.42%) Marketing
8 72 (7.12%) Manufacturing
9 57 (5.64%) Public Sector
10 55 (5.44%) Analytical Skills
10 55 (5.44%) Electronics
11 49 (4.85%) Law
12 34 (3.36%) Military
13 24 (2.37%) Legal
14 21 (2.08%) Aerospace
15 18 (1.78%) Organisational Skills
16 17 (1.68%) Presentation Skills
17 14 (1.38%) Pharmaceutical
18 11 (1.09%) Banking
19 8 (0.79%) Billing
Job Titles
1 241 (23.84%) Principal Engineer
2 237 (23.44%) Principal Systems Engineer
3 222 (21.96%) Senior
4 154 (15.23%) Systems Engineer
5 75 (7.42%) Analyst
6 64 (6.33%) Senior Systems Engineer
7 63 (6.23%) Test Engineer
8 62 (6.13%) Test Automation Engineer
9 44 (4.35%) Support Engineer
10 43 (4.25%) IT Support
10 43 (4.25%) Support Analyst
11 32 (3.17%) IT Analyst
12 31 (3.07%) Risk Manager
12 31 (3.07%) Technology Risk Manager
13 30 (2.97%) Technical Support
14 25 (2.47%) IT Support Analyst
15 22 (2.18%) 1st Line Support
16 21 (2.08%) Project Manager
17 18 (1.78%) Developer
17 18 (1.78%) Software Engineer
Libraries, Frameworks & Software Standards
1 13 (1.29%) Node.js
2 6 (0.59%) Spring Boot
3 5 (0.49%) HTML
3 5 (0.49%) RabbitMQ
4 4 (0.40%) CSS
4 4 (0.40%) Kafka
5 3 (0.30%) REST
5 3 (0.30%) RESTful
6 2 (0.20%) AngularJS
6 2 (0.20%) GraphQL
6 2 (0.20%) jQuery
6 2 (0.20%) React
6 2 (0.20%) Software Packaging
6 2 (0.20%) Spring
7 1 (0.099%) 802.1X
7 1 (0.099%) Kendo UI
7 1 (0.099%) libvirt
7 1 (0.099%) scikit-learn
7 1 (0.099%) TensorFlow
7 1 (0.099%) Vue
Miscellaneous
1 64 (6.33%) Linux Command Line
2 54 (5.34%) Robotics
3 53 (5.24%) Blockchain
4 41 (4.06%) Management Information System
5 39 (3.86%) Driving Licence
6 25 (2.47%) Self-Motivation
7 15 (1.48%) IoT
8 13 (1.29%) Private Cloud
9 11 (1.09%) CCTV
9 11 (1.09%) Public Cloud
10 10 (0.99%) Cyber Threat
11 9 (0.89%) SCADA
12 8 (0.79%) Onboarding
12 8 (0.79%) Social Network
13 7 (0.69%) Embedded Systems
14 6 (0.59%) Algorithms
14 6 (0.59%) Analogue Electronics
14 6 (0.59%) Cloud Native
14 6 (0.59%) Device Driver
14 6 (0.59%) Hybrid Cloud
Operating Systems
1 139 (13.75%) Windows
2 104 (10.29%) Linux
3 38 (3.76%) Windows Server
4 31 (3.07%) Windows 10
5 9 (0.89%) Apple iOS
5 9 (0.89%) Mac OS
6 7 (0.69%) Unix
7 5 (0.49%) Mac OS X
8 3 (0.30%) Android
8 3 (0.30%) Windows 7
9 2 (0.20%) Red Hat Enterprise Linux
9 2 (0.20%) VMS
10 1 (0.099%) Embedded Linux
10 1 (0.099%) Robot Operating System
Processes & Methodologies
1 294 (29.08%) Systems Engineering
2 256 (25.32%) Problem-Solving
3 200 (19.78%) Mentoring
4 144 (14.24%) Customer Service
5 138 (13.65%) Architectural Design
6 136 (13.45%) Model-Based Systems Engineering
7 120 (11.87%) Coaching
8 106 (10.48%) Project Planning
9 86 (8.51%) DevOps
10 77 (7.62%) Cybersecurity
11 72 (7.12%) Agile
11 72 (7.12%) Artificial Intelligence
12 71 (7.02%) Analytics
13 66 (6.53%) Test Automation
14 64 (6.33%) System Testing
15 62 (6.13%) Test Management
16 56 (5.54%) Data Analytics
17 54 (5.34%) Creative Thinking
18 53 (5.24%) Robotic Process Automation
19 52 (5.14%) Customer Experience
Programming Languages
1 118 (11.67%) Python
2 75 (7.42%) PowerShell
3 74 (7.32%) Bash
4 68 (6.73%) JavaScript
5 26 (2.57%) SQL
6 21 (2.08%) C
7 20 (1.98%) R
8 19 (1.88%) C++
9 16 (1.58%) Java
10 13 (1.29%) Perl
11 10 (0.99%) PHP
12 9 (0.89%) C#
13 5 (0.49%) Assembly Language
13 5 (0.49%) Shell Script
14 4 (0.40%) MATLAB
15 2 (0.20%) Kusto Query Language
15 2 (0.20%) Search Processing Language
15 2 (0.20%) TypeScript
16 1 (0.099%) CodeQL
16 1 (0.099%) Embedded C
Qualifications
1 451 (44.61%) Degree
2 89 (8.80%) BPSS Clearance
3 45 (4.45%) Security Cleared
4 24 (2.37%) Master's Degree
4 24 (2.37%) SC Cleared
5 22 (2.18%) CISA
5 22 (2.18%) ISACA
6 15 (1.48%) Cisco Certification
7 14 (1.38%) DV Cleared
8 12 (1.19%) CCNA
8 12 (1.19%) Microsoft Certification
9 8 (0.79%) Computer Science Degree
10 7 (0.69%) Chartered Engineer
10 7 (0.69%) ITIL Certification
10 7 (0.69%) JNCIA
10 7 (0.69%) PhD
11 6 (0.59%) CCNP
11 6 (0.59%) Network+ Certification
12 5 (0.49%) MCSA
12 5 (0.49%) PMI Certification
Quality Assurance & Compliance
1 69 (6.82%) QA
2 45 (4.45%) ITGC
3 23 (2.27%) NCSC
4 19 (1.88%) ISO/IEC 27001
5 18 (1.78%) SLA
6 9 (0.89%) ISO 9001
7 5 (0.49%) Accessibility
7 5 (0.49%) Data Quality
8 4 (0.40%) GDPR
8 4 (0.40%) PMO
9 2 (0.20%) Actionable Recommendations
9 2 (0.20%) COSHH
9 2 (0.20%) ISO 14001
9 2 (0.20%) NEBOSH
10 1 (0.099%) Cyber Essentials
10 1 (0.099%) ECSS
10 1 (0.099%) ISO 13485
10 1 (0.099%) JTAG
10 1 (0.099%) NIST 800
10 1 (0.099%) PCI DSS
System Software
1 36 (3.56%) Active Directory
2 9 (0.89%) Docker
3 8 (0.79%) Firmware
4 6 (0.59%) vSphere
5 3 (0.30%) Embedded Firmware
6 2 (0.20%) VMware Infrastructure
7 1 (0.099%) Hyper-V
7 1 (0.099%) Virtual Machines
7 1 (0.099%) Xen
Systems Management
1 16 (1.58%) Ansible
1 16 (1.58%) Kubernetes
2 12 (1.19%) Terraform
3 6 (0.59%) SCCM
4 5 (0.49%) Cisco CUCM
5 4 (0.40%) Puppet
6 2 (0.20%) EnCase
6 2 (0.20%) FTK
6 2 (0.20%) Microsoft Intune
6 2 (0.20%) Nmap
6 2 (0.20%) RSA Security Analytics
7 1 (0.099%) Amdocs OSS
7 1 (0.099%) FortiGate
7 1 (0.099%) Netcool
Vendors
1 126 (12.46%) Microsoft
2 73 (7.22%) BT
3 72 (7.12%) SAP
4 26 (2.57%) Oracle
5 18 (1.78%) Cisco
6 14 (1.38%) VMware
7 11 (1.09%) Apple
8 10 (0.99%) Google
9 9 (0.89%) HP
9 9 (0.89%) IBM
10 8 (0.79%) Databricks
10 8 (0.79%) Juniper
11 6 (0.59%) Dell
11 6 (0.59%) HubSpot
11 6 (0.59%) Splunk
12 5 (0.49%) Salesforce
12 5 (0.49%) Veeam
13 3 (0.30%) Draytek
13 3 (0.30%) PayPal
13 3 (0.30%) WatchGuard