Java Software Engineer
UK
The median Java Software Engineer salary in the UK is £107,500 per year, according to job vacancies posted during the 6 months leading to 1 May 2025.
The table below provides salary benchmarking and summary statistics, comparing them to the same period in the previous two years.
| 6 months to 1 May 2025 |
Same period 2024 | Same period 2023 | |
|---|---|---|---|
| Rank | 495 | 252 | 523 |
| Rank change year-on-year | -243 | +271 | -40 |
| Permanent jobs requiring a Java Software Engineer | 199 | 1,131 | 538 |
| As % of all permanent jobs advertised in the UK | 0.38% | 1.15% | 0.52% |
| As % of the Job Titles category | 0.42% | 1.21% | 0.57% |
| Number of salaries quoted | 190 | 260 | 394 |
| 10th Percentile | £57,500 | £46,306 | £46,250 |
| 25th Percentile | £77,500 | £55,000 | £58,750 |
| Median annual salary (50th Percentile) | £107,500 | £70,000 | £85,000 |
| Median % change year-on-year | +53.57% | -17.65% | +21.43% |
| 75th Percentile | £136,875 | £115,000 | £114,375 |
| 90th Percentile | £147,500 | £148,750 | £130,000 |
| UK excluding London median annual salary | £65,000 | £60,000 | £55,000 |
| % change year-on-year | +8.33% | +9.09% | -8.33% |
All Permanent IT Job Vacancies
UK
For comparison with the information above, the following table provides summary statistics for all permanent IT job vacancies. Most job vacancies include a discernible job title that can be normalized. As such, the figures in the second row provide an indication of the number of permanent jobs in our overall sample.
| Permanent vacancies in the UK with a recognized job title | 46,902 | 93,183 | 95,132 |
| % of permanent jobs with a recognized job title | 90.12% | 94.62% | 91.53% |
| Number of salaries quoted | 27,275 | 66,883 | 59,840 |
| 10th Percentile | £30,000 | £28,500 | £32,500 |
| 25th Percentile | £42,000 | £38,500 | £45,000 |
| Median annual salary (50th Percentile) | £57,500 | £52,777 | £60,000 |
| Median % change year-on-year | +8.95% | -12.04% | - |
| 75th Percentile | £75,000 | £71,250 | £81,250 |
| 90th Percentile | £97,500 | £90,000 | £100,000 |
| UK excluding London median annual salary | £52,000 | £50,000 | £52,500 |
| % change year-on-year | +4.00% | -4.76% | +5.00% |
Java Software Engineer
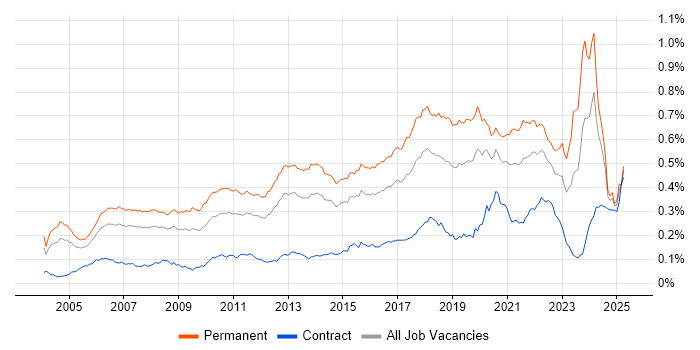
Job Vacancy Trend
Job postings that featured Java Software Engineer in the job title as a proportion of all IT jobs advertised.

Java Software Engineer
Salary Trend
3-month moving average salary quoted in jobs citing Java Software Engineer.
Java Software Engineer
Salary Histogram
Salary distribution for jobs citing Java Software Engineer over the 6 months to 1 May 2025.
Java Software Engineer
Top 13 Job Locations
The table below looks at the demand and provides a guide to the median salaries quoted in IT jobs citing Java Software Engineer within the UK over the 6 months to 1 May 2025. The 'Rank Change' column provides an indication of the change in demand within each location based on the same 6 month period last year.
| Location | Rank Change on Same Period Last Year |
Matching Permanent IT Job Ads |
Median Salary Past 6 Months |
Median Salary % Change on Same Period Last Year |
Live Jobs |
|---|---|---|---|---|---|
| England | +76 | 185 | £107,500 | +48.28% | 107 |
| London | +111 | 143 | £110,000 | -4.35% | 62 |
| Work from Home | +120 | 142 | £110,000 | +57.14% | 93 |
| UK excluding London | -306 | 43 | £65,000 | +8.33% | 79 |
| North of England | +33 | 15 | £65,000 | -0.71% | 17 |
| South West | +75 | 12 | £47,500 | -9.52% | 5 |
| North West | -7 | 9 | £65,000 | -0.71% | 13 |
| South East | +92 | 8 | £70,000 | -20.00% | 29 |
| Midlands | +74 | 7 | £60,000 | -4.36% | 10 |
| West Midlands | +45 | 7 | £60,000 | -4.36% | 8 |
| Yorkshire | +68 | 4 | £35,000 | -46.54% | 1 |
| North East | +45 | 2 | £65,000 | -0.71% | 3 |
| Scotland | -117 | 1 | - | - | 6 |
Java Software Engineer Skill Set
Top 30 Co-occurring Skills and Capabilities
For the 6 months to 1 May 2025, Java Software Engineer job roles required the following skills and capabilities in order of popularity. The figures indicate the absolute number co-occurrences and as a proportion of all permanent job ads featuring Java Software Engineer in the job title.
|
|
Java Software Engineer Skill Set
Co-occurring Skills and Capabilities by Category
The follow tables expand on the table above by listing co-occurrences grouped by category. The same employment type, locality and period is covered with up to 20 co-occurrences shown in each of the following categories:
|
|
|||||||||||||||||||||||||||||||||||||||||||||||||||||||||||||||||||||||||||||||||||||||||||||||||||||||||||||||
|
|
|||||||||||||||||||||||||||||||||||||||||||||||||||||||||||||||||||||||||||||||||||||||||||||||||||||||||||||||
|
|
|||||||||||||||||||||||||||||||||||||||||||||||||||||||||||||||||||||||||||||||||||||||||||||||||||||||||||||||
|
|
|||||||||||||||||||||||||||||||||||||||||||||||||||||||||||||||||||||||||||||||||||||||||||||||||||||||||||||||
|
|
|||||||||||||||||||||||||||||||||||||||||||||||||||||||||||||||||||||||||||||||||||||||||||||||||||||||||||||||
|
|
|||||||||||||||||||||||||||||||||||||||||||||||||||||||||||||||||||||||||||||||||||||||||||||||||||||||||||||||
|
|
|||||||||||||||||||||||||||||||||||||||||||||||||||||||||||||||||||||||||||||||||||||||||||||||||||||||||||||||
|
||||||||||||||||||||||||||||||||||||||||||||||||||||||||||||||||||||||||||||||||||||||||||||||||||||||||||||||||
