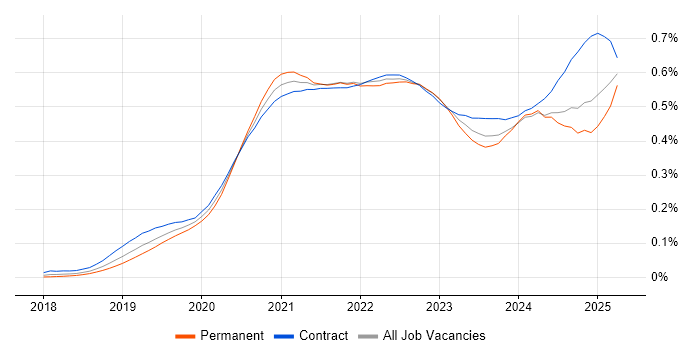
Amazon EKS Job Trends

Amazon Elastic Kubernetes Service (Amazon EKS)
UK

The table below provides summary statistics and salary benchmarking for jobs requiring Amazon EKS skills. It covers vacancies from the 6 months leading up to 18 September 2025, with comparisons to the same periods in the previous two years.

6 months to
18 Sep 2025
Same period 2024 Same period 2023
Rank 443 462 541
Rank change year-on-year +19 +79 +53
Permanent jobs citing Amazon EKS 247 367 244
As % of all permanent jobs advertised in the UK 0.50% 0.47% 0.40%
As % of the Cloud Services category 1.58% 1.49% 0.95%
Number of salaries quoted 72 157 168
10th Percentile £52,500 £65,000 £52,500
25th Percentile £61,250 £93,750 £60,000
Median annual salary (50th Percentile) £81,250 £107,500 £80,000
Median % change year-on-year -24.42% +34.38% -
75th Percentile £100,000 £142,500 £112,500
90th Percentile £122,250 £165,000 £138,750
UK excluding London median annual salary £70,000 £70,000 £67,500
% change year-on-year - +3.70% -3.57%

All Cloud Skills
UK

Amazon EKS falls under the Cloud Services category. For comparison with the information above, the following table provides summary statistics for all permanent job vacancies requiring cloud computing skills.

Permanent vacancies with a requirement for cloud computing skills 15,669 24,694 25,570
As % of all permanent jobs advertised in the UK 31.68% 31.62% 42.43%
Number of salaries quoted 10,603 15,772 21,307
10th Percentile £29,750 £34,500 £33,500
25th Percentile £39,500 £45,750 £46,250
Median annual salary (50th Percentile) £60,000 £62,500 £62,500
Median % change year-on-year -4.00% - -
75th Percentile £80,000 £82,500 £82,500
90th Percentile £101,250 £102,500 £100,000
UK excluding London median annual salary £50,000 £55,000 £55,000
% change year-on-year -9.09% - -

Amazon EKS
Job Vacancy Trend

Job postings citing Amazon EKS as a proportion of all IT jobs advertised.

Job vacancy trend for Amazon EKS in the UK

Amazon EKS
Salary Trend

Salary distribution trend for jobs in the UK citing Amazon EKS.

Salary distribution trend for jobs in the UK citing Amazon EKS

Amazon EKS
Salary Histogram

Salary distribution for jobs citing Amazon EKS over the 6 months to 18 September 2025.

Salary histogram for Amazon EKS in the UK

Amazon EKS
Top 16 Job Locations

The table below looks at the demand and provides a guide to the median salaries quoted in IT jobs citing Amazon EKS within the UK over the 6 months to 18 September 2025. The 'Rank Change' column provides an indication of the change in demand within each location based on the same 6 month period last year.

Location Rank Change
on Same Period
Last Year
Matching
Permanent
IT Job Ads
Median Salary
Past 6 Months
Median Salary
% Change
on Same Period
Last Year
Live
Jobs
England +7 230 £85,000 -20.93% 83
London +12 137 £87,500 -23.08% 53
UK excluding London +72 128 £70,000 - 54
Work from Home +10 97 £67,500 -37.21% 60
South East +61 57 - - 19
East of England +6 20 £100,000 +73.91%
Midlands +48 16 £54,000 -22.86% 3
North of England -38 14 £70,000 +0.72% 15
South West +71 12 £86,250 +23.21% 2
West Midlands +50 10 £68,250 -2.50% 3
Yorkshire +27 8 £60,000 -18.92% 2
Scotland +33 7 - - 11
East Midlands +26 6 £54,000 -
North West -51 5 £96,250 +48.08% 12
Wales +21 4 £55,000 -
North East +21 1 - - 1

Amazon EKS
Co-occurring Skills and Capabilities by Category

The follow tables expand on the table above by listing co-occurrences grouped by category. The same employment type, locality and period is covered with up to 20 co-occurrences shown in each of the following categories:

Application Platforms
1 27 (10.93%) Apache Spark
2 7 (2.83%) Apache
2 7 (2.83%) JBoss
2 7 (2.83%) Red Hat Fuse
3 6 (2.43%) WebSphere
4 5 (2.02%) nginx
5 4 (1.62%) Tomcat
5 4 (1.62%) Traefik
5 4 (1.62%) WebSphere Application Server
6 3 (1.21%) OpenStack
7 2 (0.81%) Confluence
8 1 (0.40%) CMS
8 1 (0.40%) Headless CMS
8 1 (0.40%) IIS
Cloud Services
1 239 (96.76%) AWS
2 87 (35.22%) Serverless
3 86 (34.82%) AWS CloudFormation
4 81 (32.79%) Azure
5 76 (30.77%) Amazon ECS
6 65 (26.32%) Amazon EC2
6 65 (26.32%) Amazon S3
7 51 (20.65%) AWS Lambda
8 27 (10.93%) Amazon CloudWatch
9 24 (9.72%) GitHub
10 23 (9.31%) GitHub Actions
11 19 (7.69%) Amazon ELB
12 18 (7.29%) Amazon SageMaker
12 18 (7.29%) Virtual Private Cloud
13 17 (6.88%) Amazon Bedrock
13 17 (6.88%) Datadog
14 13 (5.26%) Azure AKS
14 13 (5.26%) Azure DevOps
15 12 (4.86%) GCP
16 11 (4.45%) Route 53
Communications & Networking
1 8 (3.24%) DNS
2 6 (2.43%) TCP/IP
2 6 (2.43%) VPN
3 5 (2.02%) SSL
4 4 (1.62%) DHCP
4 4 (1.62%) ICMP
4 4 (1.62%) Reverse Proxy
5 2 (0.81%) Firewall
6 1 (0.40%) Internet
6 1 (0.40%) VSAN
Database & Business Intelligence
1 51 (20.65%) Elasticsearch
2 46 (18.62%) PostgreSQL
3 43 (17.41%) Relational Database
4 34 (13.77%) DynamoDB
5 30 (12.15%) RDBMS
6 24 (9.72%) Amazon RDS
7 20 (8.10%) Spark SQL
8 19 (7.69%) Delta Lake
8 19 (7.69%) Metadata
9 10 (4.05%) Amazon Aurora
10 9 (3.64%) Big Data
11 8 (3.24%) NoSQL
12 6 (2.43%) Data Warehouse
12 6 (2.43%) SQL Server
13 5 (2.02%) Amazon Athena
14 4 (1.62%) DB2
14 4 (1.62%) Electronic Patient Records
14 4 (1.62%) MySQL
15 3 (1.21%) MongoDB
15 3 (1.21%) Redis
Development Applications
1 81 (32.79%) Jenkins
2 40 (16.19%) JUnit
3 32 (12.96%) Mockito
4 27 (10.93%) JMeter
5 22 (8.91%) Git
6 19 (7.69%) MLflow
7 18 (7.29%) GitLab
8 8 (3.24%) Selenium
9 7 (2.83%) Locust
9 7 (2.83%) Maven
10 6 (2.43%) IntelliJ
11 5 (2.02%) Bitbucket
11 5 (2.02%) Cucumber
12 4 (1.62%) Spinnaker
13 2 (0.81%) JIRA
14 1 (0.40%) Ant
14 1 (0.40%) Cypress.io
14 1 (0.40%) Gradle
14 1 (0.40%) Jasmine
14 1 (0.40%) WebDriver
General
1 90 (36.44%) Inclusion and Diversity
2 71 (28.74%) Analytical Skills
3 69 (27.94%) Finance
4 46 (18.62%) Social Skills
5 42 (17.00%) Law
6 36 (14.57%) Public Sector
7 33 (13.36%) Banking
8 21 (8.50%) Marketing
9 7 (2.83%) Investment Banking
10 6 (2.43%) Front Office
11 5 (2.02%) Games
12 4 (1.62%) Automotive
13 2 (0.81%) Financial Institution
13 2 (0.81%) Organisational Skills
13 2 (0.81%) Presentation Skills
14 1 (0.40%) Documentation Skills
14 1 (0.40%) Manufacturing
14 1 (0.40%) Pharmaceutical
14 1 (0.40%) Publishing
14 1 (0.40%) Tech for Good
Job Titles
1 100 (40.49%) Developer
2 49 (19.84%) Software Developer
3 48 (19.43%) Senior
4 47 (19.03%) Java Developer
5 41 (16.60%) DevOps Engineer
6 39 (15.79%) Software Engineer
7 28 (11.34%) Cloud Engineer
8 25 (10.12%) AWS Engineer
9 23 (9.31%) Machine Learning Engineer
10 21 (8.50%) Full-Stack Developer
10 21 (8.50%) Full-Stack Java Developer
11 20 (8.10%) Operations Engineer
12 19 (7.69%) AWS DevOps
13 18 (7.29%) Lead
13 18 (7.29%) Senior DevOps
14 15 (6.07%) Python Engineer
14 15 (6.07%) Python Software Engineer
15 14 (5.67%) AWS DevOps Engineer
16 13 (5.26%) Senior Cloud Engineer
16 13 (5.26%) Senior DevOps Engineer
Libraries, Frameworks & Software Standards
1 68 (27.53%) Pandas
2 59 (23.89%) Node.js
3 55 (22.27%) .NET
4 53 (21.46%) Spring
5 47 (19.03%) Spring Boot
6 39 (15.79%) REST
7 35 (14.17%) Web Services
8 34 (13.77%) Apache Camel
9 32 (12.96%) ActiveMQ
10 29 (11.74%) Hibernate
10 29 (11.74%) HTML
11 28 (11.34%) jQuery
12 27 (10.93%) WireMock
13 24 (9.72%) Kafka
13 24 (9.72%) PySpark
14 23 (9.31%) PyTorch
14 23 (9.31%) TensorFlow
15 21 (8.50%) JSON
15 21 (8.50%) Lambda Expressions
16 20 (8.10%) XML
Miscellaneous
1 49 (19.84%) Cyberattack
2 47 (19.03%) Distributed Systems
3 43 (17.41%) Cloud Native
4 23 (9.31%) Linux Command Line
5 22 (8.91%) Management Information System
6 18 (7.29%) Public Cloud
7 9 (3.64%) Algorithms
8 6 (2.43%) Hedge funds
8 6 (2.43%) Self-Motivation
9 5 (2.02%) AI Agents
9 5 (2.02%) Credit Derivative
9 5 (2.02%) Enterprise Software
9 5 (2.02%) Reference Data
10 4 (1.62%) Mobile Banking
10 4 (1.62%) Private Cloud
11 2 (0.81%) Data Structures
11 2 (0.81%) Legacy Systems
11 2 (0.81%) Onboarding
11 2 (0.81%) Product Ownership
11 2 (0.81%) Virtual Team
Operating Systems
1 83 (33.60%) Linux
2 49 (19.84%) Android
3 26 (10.53%) Unix
4 11 (4.45%) Windows
5 4 (1.62%) Red Hat Enterprise Linux
6 1 (0.40%) VMS
6 1 (0.40%) Windows Server
Processes & Methodologies
1 185 (74.90%) CI/CD
2 131 (53.04%) Agile
3 114 (46.15%) Containerisation
4 112 (45.34%) Software Engineering
5 101 (40.89%) DevOps
6 68 (27.53%) OO
6 68 (27.53%) OOP
6 68 (27.53%) OWASP
7 65 (26.32%) Kanban
8 63 (25.51%) Infrastructure as Code
9 60 (24.29%) Microservices
10 59 (23.89%) Machine Learning
11 57 (23.08%) Collaborative Working
12 55 (22.27%) Artificial Intelligence
13 53 (21.46%) Mathematics
14 51 (20.65%) Statistics
15 50 (20.24%) Line Management
16 49 (19.84%) Android Development
16 49 (19.84%) Design Patterns
16 49 (19.84%) Secure Coding
Programming Languages
1 179 (72.47%) Python
2 123 (49.80%) Java
3 86 (34.82%) JavaScript
4 76 (30.77%) Go
5 54 (21.86%) C++
6 53 (21.46%) Rust
7 33 (13.36%) Bash
8 32 (12.96%) SQL
9 29 (11.74%) Shell Script
10 17 (6.88%) PowerShell
11 9 (3.64%) Lua
12 8 (3.24%) Bicep
13 7 (2.83%) TypeScript
14 3 (1.21%) C#
14 3 (1.21%) Scala
15 2 (0.81%) C
15 2 (0.81%) Kotlin
15 2 (0.81%) PHP
16 1 (0.40%) R
Qualifications
1 88 (35.63%) Security Cleared
2 53 (21.46%) DV Cleared
3 25 (10.12%) AWS Certification
3 25 (10.12%) SC Cleared
4 11 (4.45%) Degree
5 6 (2.43%) Computer Science Degree
6 5 (2.02%) AWS Certified Solutions Architect
6 5 (2.02%) Azure Certification
7 4 (1.62%) ITIL Certification
7 4 (1.62%) Microsoft Certification
8 2 (0.81%) AWS Certified Developer
8 2 (0.81%) AWS Certified DevOps Engineer
8 2 (0.81%) Master's Degree
9 1 (0.40%) AWS Certified Cloud Practitioner
9 1 (0.40%) MCSA
9 1 (0.40%) MCSE
9 1 (0.40%) Numerate Degree
Quality Assurance & Compliance
1 11 (4.45%) SLA
2 6 (2.43%) Data Quality
2 6 (2.43%) QA
3 4 (1.62%) ISO/IEC 27001
3 4 (1.62%) PCI DSS
4 3 (1.21%) GDPR
5 2 (0.81%) SOC 2
6 1 (0.40%) CDISC
6 1 (0.40%) DICOM
6 1 (0.40%) HIPAA
6 1 (0.40%) HL7
6 1 (0.40%) SNOMED CT
System Software
1 154 (62.35%) Docker
2 4 (1.62%) Virtual Machines
2 4 (1.62%) VMware Infrastructure
3 1 (0.40%) Active Directory
3 1 (0.40%) vCloud
3 1 (0.40%) VMware NSX
3 1 (0.40%) vSphere
Systems Management
1 194 (78.54%) Kubernetes
2 151 (61.13%) Terraform
3 88 (35.63%) Ansible
4 29 (11.74%) Kibana
5 28 (11.34%) Grafana
6 24 (9.72%) Prometheus
7 19 (7.69%) Kubeflow
8 12 (4.86%) Argo
9 5 (2.02%) Istio
10 4 (1.62%) HAProxy
10 4 (1.62%) Rancher
10 4 (1.62%) Single Sign-On
10 4 (1.62%) vRealize
11 1 (0.40%) Karpenter
11 1 (0.40%) logstash
11 1 (0.40%) Progress Chef
Vendors
1 33 (13.36%) Splunk
2 28 (11.34%) Dynatrace
3 26 (10.53%) Databricks
4 11 (4.45%) IBM
5 9 (3.64%) MKS
5 9 (3.64%) MuleSoft
6 6 (2.43%) Microsoft
6 6 (2.43%) OpenAI
7 5 (2.02%) Red Hat
7 5 (2.02%) VMware
8 4 (1.62%) Confluent
9 3 (1.21%) LogicMonitor
10 2 (0.81%) Google
10 2 (0.81%) Oracle
10 2 (0.81%) Solace
10 2 (0.81%) SolarWinds
11 1 (0.40%) Atlassian
11 1 (0.40%) Extreme Networks
11 1 (0.40%) PagerDuty