Behaviour-Driven Development (BDD)
UK

The following table provides summary statistics for permanent job vacancies with a requirement for BDD skills. Included is a benchmarking guide to the salaries offered in vacancies that have cited BDD over the 6 months to 7 December 2023 with a comparison to the same period in the previous 2 years.

6 months to
7 Dec 2023
Same period 2022 Same period 2021
Rank 282 181 121
Rank change year-on-year -101 -60 -30
Permanent jobs citing BDD 608 2,639 3,857
As % of all permanent jobs advertised in the UK 1.15% 2.15% 3.01%
As % of the Processes & Methodologies category 1.22% 2.24% 3.15%
Number of salaries quoted 475 1,657 2,089
10th Percentile £42,924 £43,750 £39,063
25th Percentile £50,000 £52,500 £47,500
Median annual salary (50th Percentile) £67,500 £70,000 £60,000
Median % change year-on-year -3.57% +16.67% -4.00%
75th Percentile £90,625 £90,000 £76,250
90th Percentile £111,500 £105,000 £91,250
UK excluding London median annual salary £56,318 £60,000 £54,525
% change year-on-year -6.14% +10.04% +9.05%

All Process and Methodology Skills
UK

BDD is in the Processes and Methodologies category. The following table is for comparison with the above and provides summary statistics for all permanent job vacancies with a requirement for process or methodology skills.

Permanent vacancies with a requirement for process or methodology skills 49,863 117,613 122,319
As % of all permanent jobs advertised in the UK 94.11% 95.75% 95.45%
Number of salaries quoted 36,022 72,003 82,155
10th Percentile £32,500 £34,700 £32,500
25th Percentile £43,750 £45,000 £42,500
Median annual salary (50th Percentile) £60,000 £61,000 £60,000
Median % change year-on-year -1.64% +1.67% +9.09%
75th Percentile £80,000 £82,500 £77,500
90th Percentile £99,680 £100,000 £95,000
UK excluding London median annual salary £52,500 £53,500 £50,000
% change year-on-year -1.87% +7.00% +4.17%

BDD
Job Vacancy Trend

Job postings citing BDD as a proportion of all IT jobs advertised.
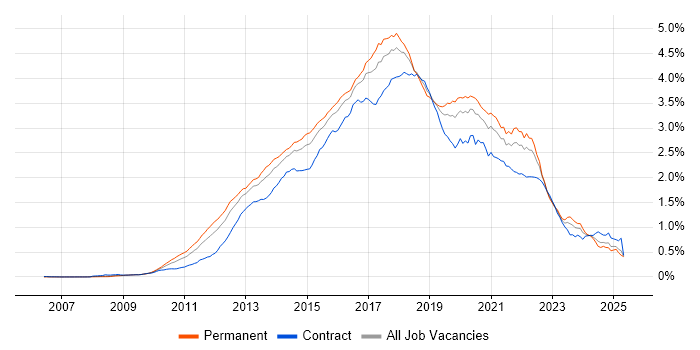
Job vacancy trend for BDD in the UK

BDD
Salary Trend

3-month moving average salary quoted in jobs citing BDD.

Salary trend for BDD in the UK

BDD
Salary Histogram

Salary distribution for jobs citing BDD over the 6 months to 7 December 2023.

Salary histogram for BDD in the UK

BDD
Top 17 Job Locations

The table below looks at the demand and provides a guide to the median salaries quoted in IT jobs citing BDD within the UK over the 6 months to 7 December 2023. The 'Rank Change' column provides an indication of the change in demand within each location based on the same 6 month period last year.

Location Rank Change
on Same Period
Last Year
Matching
Permanent
IT Job Ads
Median Salary
Past 6 Months
Median Salary
% Change
on Same Period
Last Year
Live
Jobs
England -97 519 £67,500 -3.57% 392
Work from Home -57 335 £70,000 +3.70% 313
UK excluding London -82 276 £56,318 -6.14% 275
London -87 276 £90,000 +12.50% 154
South West +27 72 £57,500 -4.17% 35
South East +24 70 £58,250 -10.38% 99
North of England -24 63 £60,000 +9.09% 56
Scotland -27 35 £56,318 -13.36% 9
North West +24 32 £57,500 -4.17% 34
Midlands -14 30 £47,900 -15.19% 36
West Midlands +4 29 £48,000 -15.01% 24
Yorkshire -6 26 £60,000 +9.09% 16
East of England +42 6 £80,000 +14.29% 40
North East +41 5 £65,000 - 6
Wales -4 2 £50,000 -9.09% 7
Northern Ireland +30 1 £65,000 -13.33% 4
East Midlands +22 1 £35,000 -39.13% 12

BDD
Co-occurring Skills and Capabilities by Category

The follow tables expand on the table above by listing co-occurrences grouped by category. The same employment type, locality and period is covered with up to 20 co-occurrences shown in each of the following categories:

Application Platforms
1 47 (7.73%) Confluence
2 21 (3.45%) SharePoint
3 17 (2.80%) OpenStack
4 15 (2.47%) CMS
5 11 (1.81%) NServiceBus
6 9 (1.48%) JBoss
6 9 (1.48%) Red Hat Fuse
7 6 (0.99%) Apache
8 5 (0.82%) WebSphere
8 5 (0.82%) WebSphere Application Server
9 3 (0.49%) SAS
9 3 (0.49%) Tomcat
10 1 (0.16%) EPiServer
10 1 (0.16%) IIS
10 1 (0.16%) Oracle Application Server
10 1 (0.16%) Oracle SOA Suite
10 1 (0.16%) Sitecore CMS
10 1 (0.16%) Umbraco
Business Applications
1 4 (0.66%) Dynamics CRM
2 2 (0.33%) Endur
3 1 (0.16%) Teamcenter
Cloud Services
1 190 (31.25%) AWS
1 190 (31.25%) Azure
2 67 (11.02%) GitHub
3 65 (10.69%) Azure DevOps
4 63 (10.36%) SaaS
5 44 (7.24%) Serverless
6 38 (6.25%) GCP
7 26 (4.28%) Amazon ECS
7 26 (4.28%) Amazon EKS
8 20 (3.29%) BlazeMeter
9 19 (3.13%) Bitrise
9 19 (3.13%) Figma
9 19 (3.13%) npm
10 16 (2.63%) Amazon SQS
11 15 (2.47%) BrowserStack
12 14 (2.30%) Power Platform
13 13 (2.14%) Azure Service Bus
14 12 (1.97%) AWS CodeCommit
14 12 (1.97%) Azure Cosmos DB
15 8 (1.32%) Azure Functions
Communications & Networking
1 12 (1.97%) AMQP
2 4 (0.66%) DNS
3 3 (0.49%) Firewall
4 2 (0.33%) Unified Communications
5 1 (0.16%) 3G
5 1 (0.16%) BIG-IP
5 1 (0.16%) Cisco Firepower
5 1 (0.16%) Cisco Nexus
5 1 (0.16%) DHCP
5 1 (0.16%) F5 BIG-IP GTM
5 1 (0.16%) F5 BIG-IP LTM
5 1 (0.16%) SSL
5 1 (0.16%) TCP/IP
Database & Business Intelligence
1 86 (14.14%) SQL Server
2 75 (12.34%) PostgreSQL
3 63 (10.36%) Relational Database
4 41 (6.74%) NoSQL
5 35 (5.76%) MongoDB
6 31 (5.10%) MySQL
7 22 (3.62%) Oracle Database
8 20 (3.29%) Oracle Database 10g
8 20 (3.29%) Oracle Database 11g
8 20 (3.29%) RDBMS
9 14 (2.30%) Big Data
10 12 (1.97%) Power BI
10 12 (1.97%) Redis
11 10 (1.64%) Event Store
11 10 (1.64%) RavenDB
12 5 (0.82%) Amazon Redshift
12 5 (0.82%) Microsoft Analysis Services
12 5 (0.82%) SQL Server Analysis Services
12 5 (0.82%) SQL Server Integration Services
13 4 (0.66%) SQL Server Reporting Services
Development Applications
1 192 (31.58%) Jenkins
2 175 (28.78%) Cucumber
3 170 (27.96%) Selenium
4 132 (21.71%) Git
5 130 (21.38%) Postman
6 75 (12.34%) JIRA
7 49 (8.06%) JUnit
8 48 (7.89%) REST Assured
9 42 (6.91%) Cypress.io
10 41 (6.74%) SpecFlow
11 38 (6.25%) Maven
12 35 (5.76%) SoapUI
13 33 (5.43%) JMeter
14 27 (4.44%) LoadRunner
15 21 (3.45%) GitLab
16 20 (3.29%) eggPlant
16 20 (3.29%) The Grinder
16 20 (3.29%) Visual Studio
17 19 (3.13%) WebDriver
18 16 (2.63%) Protractor
General
1 153 (25.16%) Social Skills
2 107 (17.60%) Finance
3 58 (9.54%) Analytical Skills
4 51 (8.39%) Banking
5 43 (7.07%) Public Sector
6 42 (6.91%) Inclusion and Diversity
7 39 (6.41%) Retail
8 18 (2.96%) Presentation Skills
9 12 (1.97%) Financial Institution
10 10 (1.64%) Aviation
11 8 (1.32%) Aerospace
11 8 (1.32%) Legal
12 7 (1.15%) Influencing Skills
12 7 (1.15%) Publishing
12 7 (1.15%) Tech for Good
13 6 (0.99%) French Language
14 5 (0.82%) Investment Banking
14 5 (0.82%) Marketing
15 4 (0.66%) Games
16 3 (0.49%) Manufacturing
Job Titles
1 180 (29.61%) Senior
2 173 (28.45%) Developer
3 83 (13.65%) Lead
4 72 (11.84%) Java Developer
5 58 (9.54%) Software Engineer
6 52 (8.55%) Senior Developer
7 51 (8.39%) Tester
8 43 (7.07%) Automation Tester
8 43 (7.07%) QA Engineer
9 37 (6.09%) Test Engineer
10 35 (5.76%) Software Developer
11 33 (5.43%) Analyst
12 30 (4.93%) Test Automation Engineer
13 23 (3.78%) Full Stack Developer
14 21 (3.45%) Architect
14 21 (3.45%) Senior Software Engineer
15 20 (3.29%) Front-End Engineer (Client-Side Engineer)
16 19 (3.13%) Automation Engineer
16 19 (3.13%) Senior Front-End Engineer (Client-Side Engineer)
16 19 (3.13%) Senior Java Developer
Libraries, Frameworks & Software Standards
1 165 (27.14%) REST
2 117 (19.24%) .NET
3 93 (15.30%) RESTful
4 89 (14.64%) Spring
5 88 (14.47%) AngularJS
6 82 (13.49%) Spring Boot
7 80 (13.16%) Web Services
8 76 (12.50%) Node.js
9 75 (12.34%) React
10 57 (9.38%) Kafka
11 47 (7.73%) Gherkin
11 47 (7.73%) JSON
12 46 (7.57%) HTML
13 42 (6.91%) XML
14 41 (6.74%) SOAP
15 39 (6.41%) .NET Core
16 38 (6.25%) CSS
17 29 (4.77%) WebdriverIO
18 26 (4.28%) .NET Framework
19 22 (3.62%) Middleware
Miscellaneous
1 61 (10.03%) Product Ownership
2 37 (6.09%) Distributed Systems
3 34 (5.59%) Cloud Native
3 34 (5.59%) Mobile App
4 21 (3.45%) Virtual Team
5 15 (2.47%) Hybrid Cloud
5 15 (2.47%) Private Cloud
6 14 (2.30%) Public Cloud
7 11 (1.81%) Enterprise Software
7 11 (1.81%) Self-Motivation
8 9 (1.48%) Derivative
8 9 (1.48%) Greenfield Project
9 7 (1.15%) Legacy Systems
9 7 (1.15%) Onboarding
10 6 (0.99%) Distributed Architecture
11 5 (0.82%) Analytical Mindset
12 4 (0.66%) Data Centre
12 4 (0.66%) Tandem
13 3 (0.49%) Client/Server
14 2 (0.33%) Robotics
Operating Systems
1 27 (4.44%) Unix
2 21 (3.45%) Windows
3 19 (3.13%) Linux
4 11 (1.81%) Android
5 10 (1.64%) Apple iOS
6 2 (0.33%) Windows 10
7 1 (0.16%) Red Hat Enterprise Linux
Processes & Methodologies
1 407 (66.94%) Agile
2 382 (62.83%) TDD
3 268 (44.08%) CI/CD
3 268 (44.08%) Test Automation
4 251 (41.28%) DevOps
5 187 (30.76%) Scrum
6 142 (23.36%) Microservices
7 116 (19.08%) Software Engineering
8 109 (17.93%) Continuous Integration
9 108 (17.76%) API Testing
10 107 (17.60%) SDLC
11 101 (16.61%) SDET
12 97 (15.95%) Test Strategy
13 89 (14.64%) Mentoring
14 87 (14.31%) Clean Code
14 87 (14.31%) Design Patterns
15 85 (13.98%) Software Testing
16 68 (11.18%) Problem-Solving
17 60 (9.87%) Coaching
18 58 (9.54%) Test Scripting
Programming Languages
1 332 (54.61%) Java
2 194 (31.91%) JavaScript
3 156 (25.66%) C#
4 143 (23.52%) SQL
5 109 (17.93%) Python
6 38 (6.25%) TypeScript
7 26 (4.28%) C
8 22 (3.62%) Go
8 22 (3.62%) Groovy
9 17 (2.80%) Bash
9 17 (2.80%) Perl
10 16 (2.63%) PowerShell
11 12 (1.97%) Tcl
12 11 (1.81%) C++
13 9 (1.48%) Kotlin
14 8 (1.32%) Ruby
14 8 (1.32%) Scala
15 7 (1.15%) VBScript
16 6 (0.99%) R
16 6 (0.99%) Shell Script
Qualifications
1 85 (13.98%) Security Cleared
2 63 (10.36%) SC Cleared
3 54 (8.88%) Degree
4 48 (7.89%) ISTQB
5 32 (5.26%) ISEB
6 14 (2.30%) ISTQB Foundation Certification
7 12 (1.97%) Computer Science Degree
8 11 (1.81%) AWS Certification
8 11 (1.81%) BPSS Clearance
9 9 (1.48%) Azure Certification
9 9 (1.48%) DV Cleared
10 5 (0.82%) CSPO
10 5 (0.82%) SAFe Agilist
11 2 (0.33%) Master's Degree
11 2 (0.33%) OCP
11 2 (0.33%) Oracle Certification
Quality Assurance & Compliance
1 201 (33.06%) QA
2 22 (3.62%) Accessibility
3 6 (0.99%) Data Quality
3 6 (0.99%) ISO 9000
3 6 (0.99%) ISO/IEC 27001
3 6 (0.99%) PCI DSS
4 4 (0.66%) GRC
4 4 (0.66%) Software Quality Assurance
5 2 (0.33%) WCAG
6 1 (0.16%) GDPR
6 1 (0.16%) ISO 9001
6 1 (0.16%) PSD2
System Software
1 85 (13.98%) Docker
2 11 (1.81%) Hyper-V
3 6 (0.99%) IAG
4 3 (0.49%) Firmware
5 2 (0.33%) Postfix
5 2 (0.33%) Virtual Servers
5 2 (0.33%) vSphere
6 1 (0.16%) Active Directory
6 1 (0.16%) Oracle RAC
6 1 (0.16%) VMware Infrastructure
Systems Management
1 106 (17.43%) Kubernetes
2 39 (6.41%) Ansible
3 37 (6.09%) Terraform
4 21 (3.45%) HP Quality Center
5 11 (1.81%) Progress Chef
5 11 (1.81%) Puppet
6 8 (1.32%) Grafana
7 6 (0.99%) Kibana
7 6 (0.99%) Packer
8 5 (0.82%) Nagios
9 4 (0.66%) Fortio
9 4 (0.66%) Istio
9 4 (0.66%) Kiali
10 2 (0.33%) Argo
10 2 (0.33%) Oracle Enterprise Manager
11 1 (0.16%) Consul
11 1 (0.16%) Data Guard
11 1 (0.16%) Enterprise Manager Cloud Control
11 1 (0.16%) Oracle RMAN
11 1 (0.16%) Prometheus
Vendors
1 48 (7.89%) Microsoft
1 48 (7.89%) Oracle
2 27 (4.44%) HP
3 17 (2.80%) WSO2
4 16 (2.63%) Atlassian
4 16 (2.63%) Google
5 15 (2.47%) Confluent
6 12 (1.97%) MKS
6 12 (1.97%) Splunk
7 10 (1.64%) Xamarin
8 9 (1.48%) New Relic
9 8 (1.32%) Dynatrace
10 6 (0.99%) Databricks
11 5 (0.82%) IBM
12 4 (0.66%) Salesforce
12 4 (0.66%) SAP
13 3 (0.49%) CA Agile Central
14 2 (0.33%) MuleSoft
14 2 (0.33%) Red Hat
14 2 (0.33%) VMware