Data Structures
UK

The table below looks at the prevalence of the term Data Structures in permanent job vacancies. Included is a benchmarking guide to the salaries offered in vacancies that have cited Data Structures over the 6 months to 7 December 2023 with a comparison to the same period over the previous 2 years.

6 months to
7 Dec 2023
Same period 2022 Same period 2021
Rank 344 249 261
Rank change year-on-year -95 +12 +20
Permanent jobs citing Data Structures 460 1,826 1,796
As % of all permanent jobs advertised in the UK 0.87% 1.49% 1.40%
As % of the Miscellaneous category 2.36% 3.45% 3.19%
Number of salaries quoted 323 780 977
10th Percentile £37,850 £41,250 £40,000
25th Percentile £50,000 £52,500 £47,500
Median annual salary (50th Percentile) £65,000 £72,500 £65,000
Median % change year-on-year -10.34% +11.54% +4.00%
75th Percentile £85,000 £95,000 £88,750
90th Percentile £107,000 £130,000 £106,250
UK excluding London median annual salary £57,500 £54,882 £55,000
% change year-on-year +4.77% -0.21% +10.00%

All Generic Skills
UK

Data Structures is in the General and Transferable Skills category. The following table is for comparison with the above and provides summary statistics for all permanent job vacancies with a requirement for generic IT skills.

Permanent vacancies with a requirement for generic IT skills 19,511 52,884 56,385
As % of all permanent jobs advertised in the UK 36.83% 43.05% 44.00%
Number of salaries quoted 14,245 29,698 33,809
10th Percentile £33,000 £35,000 £33,750
25th Percentile £45,000 £46,250 £45,000
Median annual salary (50th Percentile) £62,500 £64,750 £60,000
Median % change year-on-year -3.47% +7.92% -
75th Percentile £83,750 £85,000 £82,500
90th Percentile £107,500 £106,000 £100,000
UK excluding London median annual salary £55,000 £55,000 £50,000
% change year-on-year - +10.00% -

Data Structures
Job Vacancy Trend

Job postings citing Data Structures as a proportion of all IT jobs advertised.
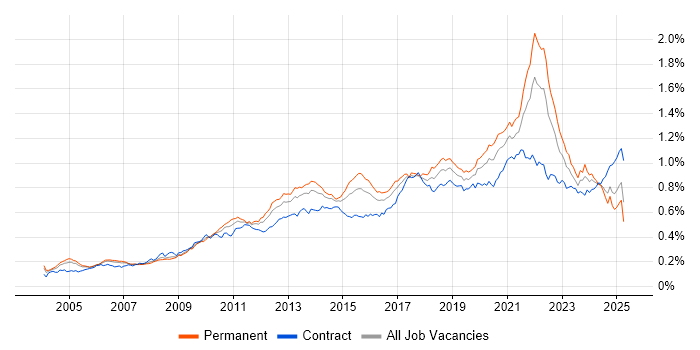
Job vacancy trend for Data Structures in the UK

Data Structures
Salary Trend

3-month moving average salary quoted in jobs citing Data Structures.

Salary trend for Data Structures in the UK

Data Structures
Salary Histogram

Salary distribution for jobs citing Data Structures over the 6 months to 7 December 2023.

Salary histogram for Data Structures in the UK

Data Structures
Top 17 Job Locations

The table below looks at the demand and provides a guide to the median salaries quoted in IT jobs citing Data Structures within the UK over the 6 months to 7 December 2023. The 'Rank Change' column provides an indication of the change in demand within each location based on the same 6 month period last year.

Location Rank Change
on Same Period
Last Year
Matching
Permanent
IT Job Ads
Median Salary
Past 6 Months
Median Salary
% Change
on Same Period
Last Year
Live
Jobs
England -103 385 £65,000 -13.33% 316
UK excluding London +13 261 £57,500 +4.77% 166
Work from Home +10 257 £62,500 -10.71% 184
London -108 178 £75,000 -11.76% 204
North of England +70 68 £60,249 +14.76% 42
Scotland +46 49 £59,556 -6.58% 9
South West +60 47 £57,500 +4.55% 11
South East +38 45 £50,000 -16.67% 71
Yorkshire +74 37 £70,576 +41.15% 7
Midlands +56 29 £65,000 +8.33% 11
North West +74 23 £60,249 +9.54% 25
West Midlands +62 15 £65,000 +8.33% 6
East Midlands +43 14 £50,000 -14.89% 5
East of England +29 9 £68,750 +37.50% 22
North East +38 8 £41,375 -40.31% 10
Northern Ireland +35 8 £70,000 +80.50% 1
Wales +10 6 - - 4

Data Structures
Co-occurring Skills and Capabilities by Category

The follow tables expand on the table above by listing co-occurrences grouped by category. The same employment type, locality and period is covered with up to 20 co-occurrences shown in each of the following categories:

Application Platforms
1 25 (5.43%) Apache Spark
2 4 (0.87%) Apache
2 4 (0.87%) CMS
2 4 (0.87%) IIS
2 4 (0.87%) SAS
2 4 (0.87%) WordPress
3 3 (0.65%) SharePoint
4 2 (0.43%) Confluence
4 2 (0.43%) Jetty
4 2 (0.43%) Tomcat
5 1 (0.22%) Apache Solr
Applications
1 32 (6.96%) Microsoft Office
2 30 (6.52%) Microsoft Excel
3 9 (1.96%) MS Visio
4 4 (0.87%) Microsoft PowerPoint
5 2 (0.43%) Sketch
5 2 (0.43%) Spreadsheet
5 2 (0.43%) UXPin
5 2 (0.43%) Zeplin
6 1 (0.22%) Microsoft Project
Business Applications
1 7 (1.52%) Dynamics CRM
2 6 (1.30%) Dynamics NAV
3 4 (0.87%) Dynamics GP
3 4 (0.87%) NetSuite
3 4 (0.87%) Sparx Enterprise Architect
4 3 (0.65%) SAP Business One
5 2 (0.43%) JDE EnterpriseOne
5 2 (0.43%) SAP ERP
6 1 (0.22%) Oracle Assets
6 1 (0.22%) Oracle EBS R12
6 1 (0.22%) Oracle ERP
6 1 (0.22%) Oracle FAH
6 1 (0.22%) Oracle General Ledger
6 1 (0.22%) Oracle iProcurement
6 1 (0.22%) Oracle Payables
6 1 (0.22%) Oracle Receivables
6 1 (0.22%) Oracle Subledger Accounting
6 1 (0.22%) SAP BPC
6 1 (0.22%) SAP S/4HANA
6 1 (0.22%) SAP SEM
Cloud Services
1 166 (36.09%) Azure
2 155 (33.70%) AWS
3 91 (19.78%) Power Platform
4 49 (10.65%) GCP
5 24 (5.22%) PowerApps
5 24 (5.22%) SaaS
6 22 (4.78%) Power Automate
7 20 (4.35%) Azure Synapse Analytics
8 19 (4.13%) Azure DevOps
9 18 (3.91%) Azure Data Factory
10 16 (3.48%) Dynamics 365
11 15 (3.26%) Amazon S3
11 15 (3.26%) Serverless
12 11 (2.39%) Microsoft 365
13 10 (2.17%) Miro
13 10 (2.17%) PaaS
14 9 (1.96%) Datadog
14 9 (1.96%) Google Docs
14 9 (1.96%) Lucidchart
14 9 (1.96%) Slack
Communications & Networking
1 3 (0.65%) HTTP
2 2 (0.43%) Remote Desktop
3 1 (0.22%) 5G
3 1 (0.22%) RS-232
3 1 (0.22%) RS-485
3 1 (0.22%) TCP/IP
Database & Business Intelligence
1 137 (29.78%) Data Warehouse
2 86 (18.70%) Power BI
2 86 (18.70%) SQL Server
3 43 (9.35%) SQL Server Integration Services
3 43 (9.35%) SQL Server Reporting Services
4 40 (8.70%) Relational Database
5 37 (8.04%) Data Lake
6 30 (6.52%) NoSQL
7 23 (5.00%) Metadata
8 22 (4.78%) Big Data
9 21 (4.57%) Hadoop
10 18 (3.91%) Redis
11 16 (3.48%) PostgreSQL
12 15 (3.26%) Elasticsearch
13 14 (3.04%) MySQL
14 13 (2.83%) BigQuery
14 13 (2.83%) Tableau
15 12 (2.61%) Azure SQL Database
15 12 (2.61%) Data Hub
16 11 (2.39%) Delta Lake
Development Applications
1 33 (7.17%) Git
2 15 (3.26%) JIRA
3 13 (2.83%) Jenkins
4 12 (2.61%) Visual Studio
5 8 (1.74%) ERwin
5 8 (1.74%) GitLab
6 5 (1.09%) Oracle Forms
6 5 (1.09%) SQL Server Management Studio (SSMS)
7 3 (0.65%) ER Studio
7 3 (0.65%) Gradle
7 3 (0.65%) Maven
8 2 (0.43%) CMake
8 2 (0.43%) ESLint
8 2 (0.43%) IDA Disassembler
8 2 (0.43%) JUnit
8 2 (0.43%) Subversion
8 2 (0.43%) Team Foundation Server
8 2 (0.43%) Travis CI
9 1 (0.22%) Ant
9 1 (0.22%) LSMW
General
1 136 (29.57%) Finance
2 120 (26.09%) Social Skills
3 82 (17.83%) Analytical Skills
4 60 (13.04%) Banking
5 38 (8.26%) Retail
6 37 (8.04%) Inclusion and Diversity
7 29 (6.30%) Marketing
8 23 (5.00%) Manufacturing
9 16 (3.48%) Front Office
9 16 (3.48%) Public Sector
10 12 (2.61%) Law
10 12 (2.61%) Legal
11 11 (2.39%) Influencing Skills
12 9 (1.96%) Documentation Skills
13 7 (1.52%) Advertising
13 7 (1.52%) Games
13 7 (1.52%) Investment Banking
13 7 (1.52%) Presentation Skills
13 7 (1.52%) Telecoms
14 5 (1.09%) Private Banking
Job Titles
1 127 (27.61%) Senior
2 114 (24.78%) Developer
3 90 (19.57%) Architect
4 74 (16.09%) Solutions Architect
5 72 (15.65%) Senior Architect
5 72 (15.65%) Senior Solutions Architect
6 66 (14.35%) Data Engineer
7 56 (12.17%) Analyst
8 45 (9.78%) Lead
9 43 (9.35%) Software Engineer
10 32 (6.96%) Python Developer
11 20 (4.35%) Java Developer
12 14 (3.04%) Business Analyst
12 14 (3.04%) Senior Data Engineer
12 14 (3.04%) Senior Developer
13 13 (2.83%) Data Analyst
13 13 (2.83%) Data Manager
14 12 (2.61%) Senior Software Engineer
14 12 (2.61%) Software Developer
14 12 (2.61%) Technical Manager
Libraries, Frameworks & Software Standards
1 41 (8.91%) HTML
2 38 (8.26%) CSS
3 33 (7.17%) React
4 24 (5.22%) Django
4 24 (5.22%) JSON
5 22 (4.78%) .NET
5 22 (4.78%) Kafka
6 21 (4.57%) REST
7 17 (3.70%) Web Services
8 15 (3.26%) Flask
8 15 (3.26%) Pandas
9 13 (2.83%) XML
10 12 (2.61%) AngularJS
11 11 (2.39%) GraphQL
11 11 (2.39%) Node.js
11 11 (2.39%) OAuth
11 11 (2.39%) Spring
12 10 (2.17%) .NET Framework
12 10 (2.17%) OpenID
13 9 (1.96%) NumPy
Miscellaneous
1 116 (25.22%) Algorithms
2 78 (16.96%) Cloud Native
3 26 (5.65%) Management Information System
4 17 (3.70%) Self-Motivation
5 13 (2.83%) Distributed Systems
6 12 (2.61%) Product Ownership
7 10 (2.17%) Public Cloud
7 10 (2.17%) Virtual Team
8 9 (1.96%) Foreign Exchange (FX)
9 8 (1.74%) Greenfield Project
10 7 (1.52%) Client/Server
10 7 (1.52%) Replication
11 6 (1.30%) Fixed Income
11 6 (1.30%) Low-Code
11 6 (1.30%) Reference Data
11 6 (1.30%) Reinsurance
12 5 (1.09%) Equities
13 4 (0.87%) Derivative
13 4 (0.87%) Hedge funds
13 4 (0.87%) Robotics
Operating Systems
1 27 (5.87%) Linux
2 21 (4.57%) Windows
3 9 (1.96%) Ubuntu
4 6 (1.30%) Windows Server
5 4 (0.87%) Unix
6 2 (0.43%) Mac OS
6 2 (0.43%) Windows 10
7 1 (0.22%) Debian
7 1 (0.22%) Windows Server 2016
7 1 (0.22%) Windows Server 2019
Processes & Methodologies
1 224 (48.70%) Agile
2 120 (26.09%) Design Patterns
3 117 (25.43%) Problem-Solving
4 114 (24.78%) Scrum
5 101 (21.96%) Computer Science
6 91 (19.78%) Analytics
7 90 (19.57%) Business Intelligence
8 83 (18.04%) Data Modelling
9 82 (17.83%) Conceptual Models
10 80 (17.39%) Business Case
11 78 (16.96%) Scaled Agile Framework
12 77 (16.74%) Software Engineering
13 76 (16.52%) Enterprise Architecture
13 76 (16.52%) Presales
14 75 (16.30%) Software Delivery
15 73 (15.87%) Actionable Insight
16 72 (15.65%) TOGAF
17 68 (14.78%) Data Analysis
18 67 (14.57%) Decision-Making
19 56 (12.17%) DevOps
Programming Languages
1 177 (38.48%) SQL
2 148 (32.17%) Python
3 76 (16.52%) Java
4 53 (11.52%) JavaScript
5 37 (8.04%) C#
6 28 (6.09%) C++
7 27 (5.87%) T-SQL
8 25 (5.43%) Go
9 23 (5.00%) PowerShell
9 23 (5.00%) TypeScript
10 20 (4.35%) Bash
11 18 (3.91%) Scala
12 13 (2.83%) C
13 9 (1.96%) Search Processing Language
14 5 (1.09%) PHP
15 4 (0.87%) Rust
15 4 (0.87%) VB
16 2 (0.43%) R
16 2 (0.43%) Shell Script
16 2 (0.43%) VBA
Qualifications
1 103 (22.39%) Degree
2 72 (15.65%) TOGAF Certification
3 51 (11.09%) Computer Science Degree
4 27 (5.87%) Master's Degree
5 16 (3.48%) Security Cleared
6 9 (1.96%) (ISC)2 CCSP
6 9 (1.96%) CCSP
6 9 (1.96%) Cisco Certification
6 9 (1.96%) CISSP
7 8 (1.74%) SC Cleared
8 5 (1.09%) Azure Certification
9 4 (0.87%) BPSS Clearance
9 4 (0.87%) HND
10 3 (0.65%) MCSA
10 3 (0.65%) Microsoft Certification
10 3 (0.65%) PhD
11 2 (0.43%) HNC
12 1 (0.22%) ACCA
12 1 (0.22%) MCSE
12 1 (0.22%) Postgraduate
Quality Assurance & Compliance
1 35 (7.61%) QA
2 29 (6.30%) Data Quality
3 8 (1.74%) Accessibility
4 7 (1.52%) GDPR
5 4 (0.87%) SLA
6 3 (0.65%) PMO
7 2 (0.43%) Disclosure Scotland
System Software
1 47 (10.22%) Docker
2 11 (2.39%) Active Directory
Systems Management
1 34 (7.39%) Kubernetes
2 19 (4.13%) Terraform
3 9 (1.96%) Ansible
4 2 (0.43%) Grafana
4 2 (0.43%) SCCM
5 1 (0.22%) Enterprise Manager Cloud Control
5 1 (0.22%) Oracle Enterprise Manager
5 1 (0.22%) Prometheus
Vendors
1 86 (18.70%) Microsoft
2 31 (6.74%) Oracle
3 30 (6.52%) Google
4 27 (5.87%) Teradata
5 16 (3.48%) Databricks
6 13 (2.83%) SAP
7 12 (2.61%) Informatica
8 11 (2.39%) Splunk
9 10 (2.17%) New Relic
10 9 (1.96%) AppDynamics
10 9 (1.96%) Dell
10 9 (1.96%) JD Edwards
10 9 (1.96%) Salesforce
11 5 (1.09%) Foundry
11 5 (1.09%) Sparx
12 4 (0.87%) BiZZdesign
12 4 (0.87%) DocuSign
12 4 (0.87%) Epicor
12 4 (0.87%) Sage
13 3 (0.65%) TIBCO