Cucumber
UK

The following table provides summary statistics for permanent job vacancies with a requirement for Cucumber skills. Included is a benchmarking guide to the salaries offered in vacancies that have cited Cucumber over the 6 months to 10 December 2023 with a comparison to the same period in the previous 2 years.

6 months to
10 Dec 2023
Same period 2022 Same period 2021
Rank 382 348 338
Rank change year-on-year -34 -10 -64
Permanent jobs citing Cucumber 391 1,214 1,376
As % of all permanent jobs advertised in the UK 0.75% 0.99% 1.08%
As % of the Development Applications category 5.71% 5.56% 5.34%
Number of salaries quoted 322 766 820
10th Percentile £42,874 £41,239 £38,808
25th Percentile £48,188 £47,500 £45,000
Median annual salary (50th Percentile) £70,000 £65,000 £60,000
Median % change year-on-year +7.69% +8.33% -
75th Percentile £101,875 £85,000 £77,500
90th Percentile £112,500 £100,000 £90,000
UK excluding London median annual salary £57,500 £55,000 £47,500
% change year-on-year +4.55% +15.79% -5.00%

All Development Application Skills
UK

Cucumber is in the Development Applications category. The following table is for comparison with the above and provides summary statistics for all permanent job vacancies with a requirement for development application skills.

Permanent vacancies with a requirement for development application skills 6,842 21,844 25,769
As % of all permanent jobs advertised in the UK 13.09% 17.87% 20.28%
Number of salaries quoted 5,216 12,549 16,287
10th Percentile £41,250 £39,750 £36,750
25th Percentile £50,000 £48,750 £45,000
Median annual salary (50th Percentile) £65,000 £65,000 £60,000
Median % change year-on-year - +8.33% +9.09%
75th Percentile £82,548 £82,500 £76,000
90th Percentile £100,000 £100,000 £91,250
UK excluding London median annual salary £58,000 £55,000 £50,000
% change year-on-year +5.45% +10.00% -

Cucumber
Job Vacancy Trend

Job postings citing Cucumber as a proportion of all IT jobs advertised.
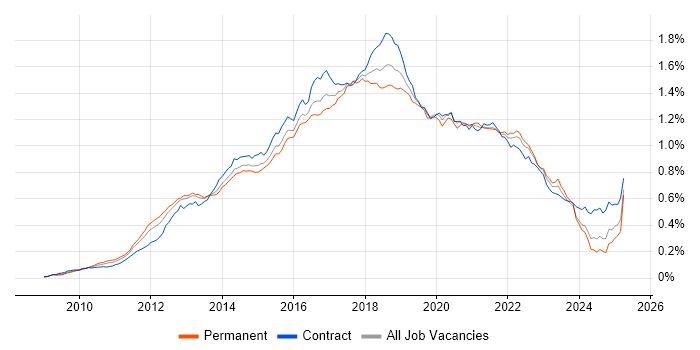
Job vacancy trend for Cucumber in the UK

Cucumber
Salary Trend

3-month moving average salary quoted in jobs citing Cucumber.

Salary trend for Cucumber in the UK

Cucumber
Salary Histogram

Salary distribution for jobs citing Cucumber over the 6 months to 10 December 2023.

Salary histogram for Cucumber in the UK

Cucumber
Top 16 Job Locations

The table below looks at the demand and provides a guide to the median salaries quoted in IT jobs citing Cucumber within the UK over the 6 months to 10 December 2023. The 'Rank Change' column provides an indication of the change in demand within each location based on the same 6 month period last year.

Location Rank Change
on Same Period
Last Year
Matching
Permanent
IT Job Ads
Median Salary
Past 6 Months
Median Salary
% Change
on Same Period
Last Year
Live
Jobs
England -11 359 £72,500 +11.54% 91
Work from Home +69 249 £77,000 +28.33% 60
London +26 202 £90,000 +20.00% 44
UK excluding London +14 167 £57,500 +4.55% 55
North of England +53 50 £61,000 +10.91% 16
South East +76 36 £50,000 -4.76% 23
South West +44 36 £52,500 -8.70% 8
North West +94 35 £61,000 +10.91% 7
Scotland +31 24 £67,500 +29.81% 1
West Midlands +115 17 £47,800 +6.22%
Midlands +114 17 £47,800 -9.81% 2
Yorkshire +19 11 £83,577 +51.96% 8
East of England +96 9 - - 3
North East +37 4 £55,000 -15.38% 1
Northern Ireland +34 2 £50,000 - 1
Wales -6 2 £46,210 -15.98% 1

Cucumber
Co-occurring Skills and Capabilities by Category

The follow tables expand on the table above by listing co-occurrences grouped by category. The same employment type, locality and period is covered with up to 20 co-occurrences shown in each of the following categories:

Application Platforms
1 38 (9.72%) Confluence
2 20 (5.12%) SharePoint
3 6 (1.53%) Apache Spark
4 5 (1.28%) WebSphere
4 5 (1.28%) WebSphere Application Server
5 4 (1.02%) Tomcat
6 3 (0.77%) Apache
6 3 (0.77%) Apache Airflow
6 3 (0.77%) Luigi
6 3 (0.77%) nginx
7 1 (0.26%) Headless CMS
7 1 (0.26%) Oracle SOA Suite
Applications
1 6 (1.53%) Adobe XD
Cloud Services
1 139 (35.55%) AWS
2 107 (27.37%) Azure
3 64 (16.37%) SaaS
4 57 (14.58%) GitHub
5 45 (11.51%) Azure DevOps
6 38 (9.72%) OpenShift
7 30 (7.67%) GCP
8 26 (6.65%) Amazon EC2
8 26 (6.65%) Serverless
9 25 (6.39%) Amazon S3
10 20 (5.12%) BlazeMeter
11 19 (4.86%) AWS Lambda
12 15 (3.84%) AWS CloudFormation
13 13 (3.32%) Amazon SQS
14 12 (3.07%) AWS CodeCommit
15 11 (2.81%) Amazon EKS
16 8 (2.05%) Amazon ECS
16 8 (2.05%) Amazon EMR
17 6 (1.53%) BrowserStack
18 5 (1.28%) Google Kubernetes Engine
Communications & Networking
1 12 (3.07%) AMQP
2 6 (1.53%) HTTP
2 6 (1.53%) SSH
3 2 (0.51%) Unified Communications
4 1 (0.26%) 3G
4 1 (0.26%) FTP
Database & Business Intelligence
1 58 (14.83%) MongoDB
2 36 (9.21%) Elasticsearch
3 24 (6.14%) NoSQL
4 23 (5.88%) SQL Server
5 21 (5.37%) Oracle Database
6 20 (5.12%) Oracle Database 10g
6 20 (5.12%) Oracle Database 11g
7 17 (4.35%) PostgreSQL
8 11 (2.81%) DynamoDB
9 10 (2.56%) Redis
10 9 (2.30%) Big Data
11 7 (1.79%) Amazon Redshift
12 6 (1.53%) Hadoop
13 5 (1.28%) Relational Database
13 5 (1.28%) Tableau
14 4 (1.02%) MySQL
15 3 (0.77%) Data Warehouse
16 2 (0.51%) NonStop SQL
16 2 (0.51%) Power BI
17 1 (0.26%) Data Lake
Development Applications
1 221 (56.52%) Selenium
2 220 (56.27%) Jenkins
3 130 (33.25%) Postman
4 107 (27.37%) JIRA
5 98 (25.06%) Cypress.io
6 78 (19.95%) Git
7 63 (16.11%) Maven
8 57 (14.58%) JUnit
9 44 (11.25%) JMeter
9 44 (11.25%) REST Assured
9 44 (11.25%) SoapUI
10 33 (8.44%) GitLab
11 27 (6.91%) Bitbucket
11 27 (6.91%) WebDriver
12 25 (6.39%) Mocha
13 23 (5.88%) LoadRunner
13 23 (5.88%) SonarQube
14 22 (5.63%) Serenity BDD
15 21 (5.37%) SpecFlow
16 20 (5.12%) eggPlant
General
1 89 (22.76%) Finance
2 70 (17.90%) Inclusion and Diversity
3 55 (14.07%) Banking
4 36 (9.21%) Social Skills
5 21 (5.37%) Analytical Skills
5 21 (5.37%) Tech for Good
6 19 (4.86%) Public Sector
7 18 (4.60%) Aerospace
8 15 (3.84%) Influencing Skills
9 14 (3.58%) Retail
10 8 (2.05%) Publishing
11 6 (1.53%) Marketing
12 5 (1.28%) Presentation Skills
13 4 (1.02%) Front Office
14 3 (0.77%) Advertising
14 3 (0.77%) Financial Institution
14 3 (0.77%) Games
14 3 (0.77%) Manufacturing
14 3 (0.77%) Pharmaceutical
15 2 (0.51%) Law
Job Titles
1 98 (25.06%) Senior
2 76 (19.44%) Lead
3 60 (15.35%) Developer
4 55 (14.07%) Software Engineer
5 41 (10.49%) QA Engineer
6 39 (9.97%) Tester
7 35 (8.95%) Automation Tester
8 34 (8.70%) Java Developer
9 31 (7.93%) DevOps Engineer
10 30 (7.67%) Test Engineer
11 21 (5.37%) Full Stack Developer
11 21 (5.37%) Test Automation Engineer
12 18 (4.60%) Lead Software Engineer
13 17 (4.35%) Analyst
13 17 (4.35%) AWS Developer
13 17 (4.35%) Test Analyst
14 15 (3.84%) Java Engineer
15 14 (3.58%) QA Automation Engineer
15 14 (3.58%) Senior Developer
15 14 (3.58%) Senior Software Engineer
Libraries, Frameworks & Software Standards
1 121 (30.95%) REST
2 64 (16.37%) Spring
3 50 (12.79%) Gherkin
4 41 (10.49%) Spring Boot
5 38 (9.72%) RESTful
6 37 (9.46%) AngularJS
6 37 (9.46%) React
7 34 (8.70%) Middleware
8 32 (8.18%) SOAP
9 31 (7.93%) Node.js
10 27 (6.91%) JSON
10 27 (6.91%) Web Services
11 26 (6.65%) HTML
12 25 (6.39%) WebdriverIO
13 24 (6.14%) CSS
14 20 (5.12%) Kafka
14 20 (5.12%) RabbitMQ
15 19 (4.86%) Jest
16 18 (4.60%) OpenAPI
16 18 (4.60%) Playwright
Miscellaneous
1 60 (15.35%) Product Ownership
2 10 (2.56%) Virtual Team
3 9 (2.30%) Distributed Systems
4 8 (2.05%) Credit Risk
4 8 (2.05%) Public Cloud
5 7 (1.79%) Cloud Native
5 7 (1.79%) Hedge funds
6 6 (1.53%) Greenfield Project
6 6 (1.53%) Legacy Systems
6 6 (1.53%) Onboarding
7 5 (1.28%) Distributed Applications
8 4 (1.02%) Client/Server
8 4 (1.02%) Private Cloud
9 3 (0.77%) Enterprise Software
9 3 (0.77%) Renewable Energy
10 2 (0.51%) Blockchain
10 2 (0.51%) Mobile App
10 2 (0.51%) N-Tier
10 2 (0.51%) Self-Motivation
10 2 (0.51%) Team-Oriented Environment
Operating Systems
1 26 (6.65%) Linux
2 22 (5.63%) Unix
3 6 (1.53%) Android
3 6 (1.53%) Apple iOS
3 6 (1.53%) CentOS
4 3 (0.77%) Windows
Processes & Methodologies
1 236 (60.36%) Agile
2 194 (49.62%) CI/CD
3 192 (49.10%) Test Automation
4 180 (46.04%) DevOps
5 175 (44.76%) BDD
6 127 (32.48%) API Testing
7 117 (29.92%) SDET
8 94 (24.04%) Clean Code
9 93 (23.79%) Scrum
10 90 (23.02%) Test Strategy
11 73 (18.67%) Software Engineering
12 69 (17.65%) Microservices
12 69 (17.65%) Software Testing
13 65 (16.62%) Continuous Integration
14 63 (16.11%) TDD
15 51 (13.04%) Deployment Automation
16 49 (12.53%) SDLC
17 47 (12.02%) Full Stack Development
18 44 (11.25%) Non-Functional Testing
19 43 (11.00%) Fintech
Programming Languages
1 297 (75.96%) Java
2 170 (43.48%) JavaScript
3 116 (29.67%) Python
4 112 (28.64%) SQL
5 57 (14.58%) C#
6 41 (10.49%) C++
7 38 (9.72%) TypeScript
8 26 (6.65%) Groovy
9 21 (5.37%) C
10 20 (5.12%) Perl
11 12 (3.07%) Scala
11 12 (3.07%) Shell Script
11 12 (3.07%) Tcl
12 8 (2.05%) Ruby
13 7 (1.79%) VBScript
14 6 (1.53%) Kotlin
14 6 (1.53%) Swift
15 5 (1.28%) SOQL
16 4 (1.02%) PL/SQL
16 4 (1.02%) PowerShell
Qualifications
1 51 (13.04%) Security Cleared
2 29 (7.42%) SC Cleared
3 21 (5.37%) ISTQB
4 18 (4.60%) Degree
5 16 (4.09%) ISEB
6 11 (2.81%) DV Cleared
7 7 (1.79%) Computer Science Degree
8 6 (1.53%) BPSS Clearance
9 5 (1.28%) ISTQB Foundation Certification
10 3 (0.77%) OCP
10 3 (0.77%) Oracle Certification
11 2 (0.51%) ITIL Certification
11 2 (0.51%) Master's Degree
12 1 (0.26%) ISTQB Advanced Certification
Quality Assurance & Compliance
1 169 (43.22%) QA
2 18 (4.60%) Accessibility
3 5 (1.28%) Data Quality
4 4 (1.02%) Software Quality Assurance
5 2 (0.51%) WCAG
6 1 (0.26%) GDPR
6 1 (0.26%) PSD2
System Software
1 78 (19.95%) Docker
2 2 (0.51%) Firmware
3 1 (0.26%) Active Directory
Systems Management
1 81 (20.72%) Kubernetes
2 33 (8.44%) Terraform
3 18 (4.60%) HP Quality Center
3 18 (4.60%) Kibana
3 18 (4.60%) Prometheus
3 18 (4.60%) Puppet
4 17 (4.35%) Ansible
5 13 (3.32%) Nagios
6 9 (2.30%) Progress Chef
7 8 (2.05%) Packer
8 5 (1.28%) Grafana
9 4 (1.02%) Consul
9 4 (1.02%) Fortio
9 4 (1.02%) Istio
9 4 (1.02%) Kiali
Vendors
1 26 (6.65%) Splunk
2 25 (6.39%) Oracle
3 23 (5.88%) HP
4 21 (5.37%) Dynatrace
4 21 (5.37%) Google
5 17 (4.35%) Atlassian
6 16 (4.09%) New Relic
7 13 (3.32%) IBM
7 13 (3.32%) Veracode
8 12 (3.07%) MKS
9 8 (2.05%) Salesforce
10 7 (1.79%) AppDynamics
11 6 (1.53%) Adobe
12 5 (1.28%) MuleSoft
13 4 (1.02%) Microsoft
14 2 (0.51%) Databricks
15 1 (0.26%) Alteryx
15 1 (0.26%) Duck Creek
15 1 (0.26%) SAP