Scala Jobs with Work from Home Options

Scala
UK > Work from Home

The table below provides summary statistics for permanent job vacancies with an option to work from home (WFH) and a requirement for Scala skills. Included is a benchmarking guide to the salaries offered in vacancies that have cited Scala over the 6 months to 26 April 2024 with a comparison to the same period in the previous 2 years.

6 months to
26 Apr 2024
Same period 2023 Same period 2022
Rank 398 291 214
Rank change year-on-year -107 -77 +29
Permanent jobs citing Scala 198 486 1,230
As % of all permanent jobs with a WFH option 0.59% 1.12% 1.84%
As % of the Programming Languages category 1.44% 2.28% 3.14%
Number of salaries quoted 164 206 503
10th Percentile - £50,000 £50,000
25th Percentile £55,000 £57,500 £62,825
Median annual salary (50th Percentile) £80,000 £72,500 £80,000
Median % change year-on-year +10.34% -9.38% +0.63%
75th Percentile £95,000 £92,500 £108,125
90th Percentile £143,375 £107,500 £130,000
UK median annual salary £75,000 £80,000 £80,000
% change year-on-year -6.25% - +6.67%

All Programming Languages
Work from Home

Scala is in the Programming Languages category. The following table is for comparison with the above and provides summary statistics for all permanent job vacancies with a WFH option and a requirement for coding skills.

Permanent vacancies with a requirement for coding skills 13,764 21,297 39,199
As % of all permanent jobs with a WFH option 40.70% 49.25% 58.74%
Number of salaries quoted 11,419 15,642 23,967
10th Percentile £38,750 £41,000 £37,500
25th Percentile £46,250 £50,000 £46,250
Median annual salary (50th Percentile) £60,000 £65,000 £62,500
Median % change year-on-year -7.69% +4.00% +13.64%
75th Percentile £78,750 £85,000 £81,250
90th Percentile £100,000 £103,797 £95,000
UK median annual salary £60,000 £65,000 £62,500
% change year-on-year -7.69% +4.00% +13.64%

Scala
Trend for Jobs with a WFH Option

Job vacancies with a work from home option citing Scala as a proportion of all IT jobs advertised.
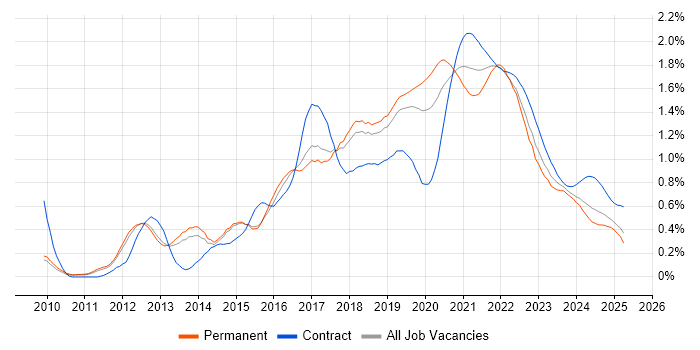
Scala trend for jobs with a WFH option

Scala
Salary Trend for Jobs with a WFH Option

3-month moving average salary quoted in job vacancies with a work from home option citing Scala.

Scala salary trend for jobs with a WFH option

Scala
Salary Histogram for Jobs with a WFH Option

Salary distribution for jobs with a work from home option citing Scala over the 6 months to 26 April 2024.

Scala salary histogram for jobs with a WFH option

Scala
Co-occurring Skills and Capabilities with WFH Options by Category

The follow tables expand on the table above by listing co-occurrences grouped by category. The same employment type, locality and period is covered with up to 20 co-occurrences shown in each of the following categories:

Application Platforms
1 55 (27.78%) Apache Spark
2 24 (12.12%) Apache Airflow
3 18 (9.09%) Apache
4 1 (0.51%) Confluence
Applications
1 3 (1.52%) Microsoft Excel
Cloud Services
1 117 (59.09%) AWS
2 66 (33.33%) GCP
3 29 (14.65%) Azure
4 24 (12.12%) Amazon S3
4 24 (12.12%) Amazon SQS
4 24 (12.12%) SaaS
5 23 (11.62%) Google Docs
5 23 (11.62%) Lucidchart
5 23 (11.62%) Miro
5 23 (11.62%) Slack
6 16 (8.08%) dbt
7 7 (3.54%) Snowflake
8 6 (3.03%) Amazon EMR
9 5 (2.53%) Amazon Kinesis
10 4 (2.02%) Power Platform
11 3 (1.52%) Azure Synapse Analytics
11 3 (1.52%) Power Automate
11 3 (1.52%) PowerApps
12 2 (1.01%) Azure AKS
12 2 (1.01%) Azure DevOps
Communications & Networking
1 2 (1.01%) HTTP
Database & Business Intelligence
1 47 (23.74%) Big Data
2 40 (20.20%) Hadoop
3 38 (19.19%) PostgreSQL
4 30 (15.15%) Relational Database
5 23 (11.62%) Elasticsearch
5 23 (11.62%) Redis
5 23 (11.62%) Scylla
6 20 (10.10%) RDBMS
7 18 (9.09%) Amazon Athena
7 18 (9.09%) Data Warehouse
8 15 (7.58%) Apache Arrow
8 15 (7.58%) Apache Ignite
8 15 (7.58%) Dremio
9 12 (6.06%) Data Lake
10 10 (5.05%) Flink
11 9 (4.55%) BigQuery
12 8 (4.04%) SQL Server
13 7 (3.54%) NoSQL
14 6 (3.03%) Data Mining
15 4 (2.02%) Power BI
Development Applications
1 9 (4.55%) Git
2 7 (3.54%) Oracle Forms
3 6 (3.03%) Jenkins
4 3 (1.52%) MLflow
4 3 (1.52%) Sonatype Nexus
4 3 (1.52%) Spinnaker
5 2 (1.01%) JUnit
6 1 (0.51%) Cucumber
6 1 (0.51%) Gatling
6 1 (0.51%) GitLab
6 1 (0.51%) Gradle
6 1 (0.51%) IBM UrbanCode
6 1 (0.51%) JIRA
6 1 (0.51%) LoadRunner
6 1 (0.51%) Maven
6 1 (0.51%) Postman
6 1 (0.51%) REST Assured
6 1 (0.51%) Selenium
General
1 62 (31.31%) Social Skills
2 38 (19.19%) Finance
3 37 (18.69%) Analytical Skills
4 29 (14.65%) Banking
5 23 (11.62%) Inclusion and Diversity
6 15 (7.58%) Front Office
6 15 (7.58%) Investment Banking
7 4 (2.02%) Influencing Skills
7 4 (2.02%) Retail
8 3 (1.52%) Legal
9 2 (1.01%) Advertising
9 2 (1.01%) Games
10 1 (0.51%) Automotive
10 1 (0.51%) Marketing
10 1 (0.51%) Presentation Skills
10 1 (0.51%) Public Sector
10 1 (0.51%) Telecoms
Job Titles
1 79 (39.90%) Developer
2 63 (31.82%) Software Engineer
3 59 (29.80%) Scala Developer
4 25 (12.63%) Data Engineer
5 24 (12.12%) Principal Engineer
5 24 (12.12%) Principal Software Engineer
6 21 (10.61%) Senior
7 15 (7.58%) Lead
8 13 (6.57%) Software Developer
9 11 (5.56%) Developer/Software Engineer
10 10 (5.05%) Senior Software Engineer
11 9 (4.55%) Architect
11 9 (4.55%) AWS Engineer
12 6 (3.03%) AWS Data Engineer
12 6 (3.03%) Head of Engineering
13 5 (2.53%) Java Developer
13 5 (2.53%) Lead Data Engineer
13 5 (2.53%) Lead Software Engineer
13 5 (2.53%) Python Engineer
13 5 (2.53%) Senior Developer
Libraries, Frameworks & Software Standards
1 44 (22.22%) Kafka
2 25 (12.63%) Akka
3 23 (11.62%) GraphQL
4 20 (10.10%) JSON
5 15 (7.58%) gRPC
5 15 (7.58%) NumPy
5 15 (7.58%) Pandas
5 15 (7.58%) Protocol Buffers
5 15 (7.58%) SciPy
6 12 (6.06%) Apache Beam
7 5 (2.53%) Play Framework
8 4 (2.02%) PySpark
8 4 (2.02%) React
8 4 (2.02%) Spring
9 3 (1.52%) Vue
10 2 (1.01%) .NET
10 2 (1.01%) Hibernate
10 2 (1.01%) Spark Streaming
10 2 (1.01%) Spring Boot
11 1 (0.51%) Middleware
Miscellaneous
1 39 (19.70%) Data Structures
2 38 (19.19%) Algorithms
3 22 (11.11%) Self-Motivation
4 12 (6.06%) Derivative
4 12 (6.06%) Equities
4 12 (6.06%) Fixed Income
4 12 (6.06%) Foreign Exchange (FX)
4 12 (6.06%) Hedge funds
5 8 (4.04%) Cloud Native
6 7 (3.54%) Distributed Systems
7 5 (2.53%) Greenfield Project
8 3 (1.52%) Blockchain
8 3 (1.52%) IoT
8 3 (1.52%) Renewable Energy
9 2 (1.01%) Client/Server
9 2 (1.01%) Kindle
10 1 (0.51%) Life Science
10 1 (0.51%) Management Information System
10 1 (0.51%) Public Cloud
10 1 (0.51%) Social Network
Operating Systems
1 3 (1.52%) Linux
Processes & Methodologies
1 99 (50.00%) Software Engineering
2 60 (30.30%) Problem-Solving
3 48 (24.24%) Agile
3 48 (24.24%) Technical Architecture
4 44 (22.22%) CI/CD
5 42 (21.21%) Fintech
6 41 (20.71%) Data Science
7 29 (14.65%) High Availability
8 27 (13.64%) Data Engineering
9 25 (12.63%) Data Pipeline
10 24 (12.12%) Analytics
10 24 (12.12%) Cyber Threat Intelligence
10 24 (12.12%) Cybersecurity
10 24 (12.12%) Data Architecture
10 24 (12.12%) Threat Intelligence
11 23 (11.62%) Computer Security
11 23 (11.62%) User Experience
11 23 (11.62%) UX Research
12 21 (10.61%) Data Modelling
13 20 (10.10%) Mentoring
Programming Languages
1 173 (87.37%) Java
2 86 (43.43%) Python
3 49 (24.75%) SQL
4 45 (22.73%) Kotlin
5 38 (19.19%) Go
6 27 (13.64%) Bash
7 22 (11.11%) JavaScript
7 22 (11.11%) TypeScript
8 15 (7.58%) Ruby
9 9 (4.55%) C#
10 4 (2.02%) R
10 4 (2.02%) Rust
11 3 (1.52%) C
11 3 (1.52%) C++
11 3 (1.52%) Clojure
11 3 (1.52%) Groovy
11 3 (1.52%) PowerShell
12 2 (1.01%) F#
12 2 (1.01%) Haskell
13 1 (0.51%) Cypher
Qualifications
1 19 (9.60%) Degree
2 5 (2.53%) Computer Science Degree
3 4 (2.02%) SC Cleared
3 4 (2.02%) Security Cleared
4 3 (1.52%) DV Cleared
4 3 (1.52%) ISTQB
5 1 (0.51%) Azure Certification
5 1 (0.51%) Microsoft Certification
5 1 (0.51%) OCP
5 1 (0.51%) Oracle Certification
Quality Assurance & Compliance
1 9 (4.55%) Data Quality
2 3 (1.52%) QA
3 1 (0.51%) Accessibility
3 1 (0.51%) GMP
3 1 (0.51%) SNOMED CT
System Software
1 15 (7.58%) Docker
2 2 (1.01%) Apache Flume
3 1 (0.51%) HDFS
Systems Management
1 46 (23.23%) Kubernetes
2 42 (21.21%) Terraform
3 38 (19.19%) Ansible
4 2 (1.01%) Istio
5 1 (0.51%) Progress Chef
5 1 (0.51%) Puppet
5 1 (0.51%) Rancher
Vendors
1 38 (19.19%) Google
2 24 (12.12%) Dell
3 11 (5.56%) Databricks
4 9 (4.55%) Oracle
5 8 (4.04%) Teradata
6 7 (3.54%) Microsoft
7 3 (1.52%) Cloudera
8 2 (1.01%) Apple
8 2 (1.01%) Dynatrace
8 2 (1.01%) Hortonworks
9 1 (0.51%) Adobe
9 1 (0.51%) Informatica
9 1 (0.51%) Red Hat
9 1 (0.51%) StreamSets