Selenium Jobs with Work from Home Options

Selenium
UK > Work from Home

The table below provides summary statistics for permanent remote or hybrid work requiring Selenium skills. It includes a benchmarking guide to the annual salaries offered in vacancies that cited Selenium over the 6 months leading up to 26 July 2024, comparing them to the same period in the previous two years.

6 months to
26 Jul 2024
Same period 2023 Same period 2022
Rank 353 233 181
Rank change year-on-year -120 -52 -3
Permanent jobs citing Selenium 191 464 1,832
As % of all permanent jobs with a WFH option 0.68% 1.41% 2.33%
As % of the Development Applications category 6.67% 9.39% 9.23%
Number of salaries quoted 132 410 1,090
10th Percentile £41,250 £42,500 £40,900
25th Percentile £47,500 £50,000 £46,250
Median annual salary (50th Percentile) £57,500 £61,000 £57,500
Median % change year-on-year -5.74% +6.09% +15.00%
75th Percentile £72,500 £79,688 £70,000
90th Percentile £95,000 £95,000 £82,500
UK median annual salary £57,965 £60,000 £60,000
% change year-on-year -3.39% - +14.29%

All Development Application Skills
Work from Home

Selenium falls under the Development Applications category. For comparison with the information above, the following table provides summary statistics for all permanent job vacancies with remote or hybrid options requiring development application skills.

Permanent vacancies with a requirement for development application skills 2,863 4,939 19,859
As % of all permanent jobs with a WFH option 10.25% 15.05% 25.29%
Number of salaries quoted 2,027 3,735 8,783
10th Percentile £38,750 £41,250 £38,750
25th Percentile £46,250 £50,000 £47,500
Median annual salary (50th Percentile) £57,500 £62,500 £62,500
Median % change year-on-year -8.00% - +13.64%
75th Percentile £75,000 £80,000 £80,000
90th Percentile £90,000 £95,924 £93,750
UK median annual salary £58,500 £65,000 £62,500
% change year-on-year -10.00% +4.00% +8.70%

Selenium
Trend for Jobs with a WFH Option

Job vacancies with a work from home option citing Selenium as a proportion of all IT jobs advertised.
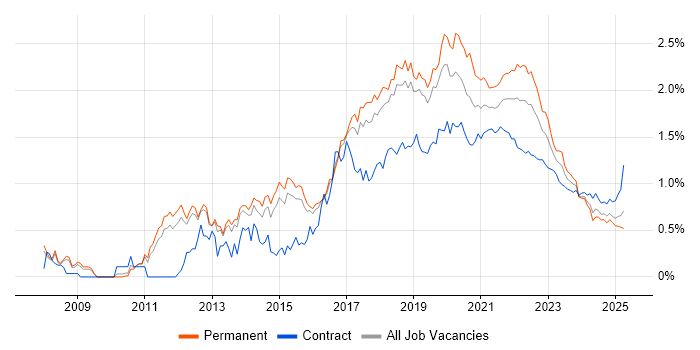
Selenium trend for jobs with a WFH option

Selenium
Salary Trend for Jobs with a WFH Option

3-month moving average salary quoted in job vacancies with a work from home option citing Selenium.

Selenium salary trend for jobs with a WFH option

Selenium
Salary Histogram for Jobs with a WFH Option

Salary distribution for jobs with a work from home option citing Selenium over the 6 months to 26 July 2024.

Selenium salary histogram for jobs with a WFH option

Selenium
Co-occurring Skills and Capabilities with WFH Options by Category

The follow tables expand on the table above by listing co-occurrences grouped by category. The same employment type, locality and period is covered with up to 20 co-occurrences shown in each of the following categories:

Application Platforms
1 7 (3.66%) Apache
2 4 (2.09%) CMS
3 3 (1.57%) Confluence
3 3 (1.57%) IIS
4 2 (1.05%) nginx
4 2 (1.05%) Sitecore CMS
4 2 (1.05%) Tomcat
Cloud Services
1 45 (23.56%) Azure
2 38 (19.90%) SaaS
3 31 (16.23%) AWS
4 23 (12.04%) Azure DevOps
5 10 (5.24%) BrowserStack
6 7 (3.66%) Pulumi
7 6 (3.14%) Cloud Computing
8 5 (2.62%) Sauce Labs
9 4 (2.09%) Azure API Management
9 4 (2.09%) Azure Key Vault
9 4 (2.09%) Azure Monitor
9 4 (2.09%) Azure Service Bus
9 4 (2.09%) Azure Storage
9 4 (2.09%) Entra ID
10 3 (1.57%) Serverless
11 2 (1.05%) Amazon ElastiCache
11 2 (1.05%) Amazon OpenSearch
11 2 (1.05%) Amazon SQS
11 2 (1.05%) Azure Stack
11 2 (1.05%) GCP
Communications & Networking
1 7 (3.66%) Network Security
2 1 (0.52%) HTTP
2 1 (0.52%) Internet
2 1 (0.52%) SAN
Database & Business Intelligence
1 17 (8.90%) SQL Server
2 6 (3.14%) Relational Database
3 4 (2.09%) MongoDB
4 3 (1.57%) PostgreSQL
5 2 (1.05%) Amazon Aurora
5 2 (1.05%) Amazon RDS
5 2 (1.05%) Elasticsearch
5 2 (1.05%) MySQL
6 1 (0.52%) DynamoDB
6 1 (0.52%) MariaDB
6 1 (0.52%) NoSQL
Development Applications
1 60 (31.41%) Postman
2 46 (24.08%) Cypress.io
3 42 (21.99%) Cucumber
4 38 (19.90%) Jenkins
5 36 (18.85%) JMeter
6 28 (14.66%) REST Assured
7 27 (14.14%) JIRA
7 27 (14.14%) WebDriver
8 26 (13.61%) SpecFlow
9 24 (12.57%) Git
10 23 (12.04%) JUnit
11 18 (9.42%) Visual Studio
12 16 (8.38%) TestNG
13 14 (7.33%) Appium
13 14 (7.33%) Team Foundation Server
14 13 (6.81%) TeamCity
15 11 (5.76%) GitLab
15 11 (5.76%) SoapUI
16 10 (5.24%) Gatling
17 9 (4.71%) Moq
General
1 44 (23.04%) Social Skills
2 29 (15.18%) Finance
3 28 (14.66%) Analytical Skills
4 18 (9.42%) Aerospace
5 16 (8.38%) Public Sector
6 12 (6.28%) Inclusion and Diversity
7 6 (3.14%) Law
8 5 (2.62%) Pharmaceutical
9 3 (1.57%) Banking
9 3 (1.57%) Billing
9 3 (1.57%) Electronics
9 3 (1.57%) Financial Institution
9 3 (1.57%) Health Technology
9 3 (1.57%) Manufacturing
10 2 (1.05%) Automotive
10 2 (1.05%) Documentation Skills
10 2 (1.05%) Fire and Rescue
10 2 (1.05%) Legal
10 2 (1.05%) Marketing
10 2 (1.05%) Tech for Good
Job Titles
1 50 (26.18%) Senior
2 44 (23.04%) Tester
3 36 (18.85%) Automation Tester
4 33 (17.28%) Test Engineer
5 28 (14.66%) Lead
6 24 (12.57%) QA Engineer
7 23 (12.04%) Developer
8 18 (9.42%) Analyst
9 17 (8.90%) Senior Test Engineer
10 12 (6.28%) Test Automation Engineer
11 11 (5.76%) .NET Developer
11 11 (5.76%) Lead Developer
11 11 (5.76%) Software Developer
12 10 (5.24%) Lead .NET Developer
12 10 (5.24%) Test Analyst
13 9 (4.71%) Senior Analyst
13 9 (4.71%) Software Engineer
14 8 (4.19%) C# Developer
14 8 (4.19%) QA Analyst
14 8 (4.19%) QA Automation Engineer
Libraries, Frameworks & Software Standards
1 31 (16.23%) REST
2 30 (15.71%) .NET
3 23 (12.04%) Playwright
4 15 (7.85%) ASP.NET
4 15 (7.85%) RESTful
4 15 (7.85%) Swagger
5 13 (6.81%) .NET Core
5 13 (6.81%) .NET Framework
6 12 (6.28%) WireMock
7 11 (5.76%) Entity Framework
7 11 (5.76%) React
8 10 (5.24%) Gherkin
8 10 (5.24%) HTML
8 10 (5.24%) Web Services
9 9 (4.71%) CSS
10 7 (3.66%) Apache Commons
10 7 (3.66%) Guava
10 7 (3.66%) HTML5
10 7 (3.66%) Java Concurrency
10 7 (3.66%) OpenID
Miscellaneous
1 8 (4.19%) Mobile App
2 6 (3.14%) Product Ownership
3 5 (2.62%) Replication
3 5 (2.62%) Self-Motivation
3 5 (2.62%) Team-Oriented Environment
4 4 (2.09%) Management Information System
4 4 (2.09%) W3C
5 3 (1.57%) Driving Licence
6 2 (1.05%) Life Science
6 2 (1.05%) NHS
6 2 (1.05%) Private Cloud
6 2 (1.05%) Virtual Team
7 1 (0.52%) Client/Server
7 1 (0.52%) Enterprise Software
7 1 (0.52%) Greenfield Project
7 1 (0.52%) Legacy Applications
7 1 (0.52%) Onboarding
Operating Systems
1 6 (3.14%) Android
1 6 (3.14%) Windows
2 5 (2.62%) Apple iOS
Processes & Methodologies
1 159 (83.25%) Test Automation
2 112 (58.64%) Agile
3 64 (33.51%) Software Testing
4 53 (27.75%) CI/CD
5 52 (27.23%) API Testing
5 52 (27.23%) Test Scripting
6 51 (26.70%) BDD
7 47 (24.61%) DevOps
8 46 (24.08%) SDET
9 42 (21.99%) Scrum
10 39 (20.42%) Mentoring
11 37 (19.37%) Problem-Solving
12 35 (18.32%) Coaching
13 30 (15.71%) Test Strategy
14 25 (13.09%) Collaborative Working
15 22 (11.52%) Microservices
15 22 (11.52%) Performance Testing
16 20 (10.47%) Clean Code
17 19 (9.95%) Regression Testing
17 19 (9.95%) Test Assurance
Programming Languages
1 67 (35.08%) Java
2 64 (33.51%) JavaScript
3 60 (31.41%) C#
4 38 (19.90%) SQL
5 23 (12.04%) Python
6 16 (8.38%) TypeScript
7 8 (4.19%) PowerShell
8 7 (3.66%) Bicep
9 4 (2.09%) Bash
9 4 (2.09%) PHP
10 3 (1.57%) C++
10 3 (1.57%) VB.NET
11 1 (0.52%) T-SQL
11 1 (0.52%) VB
11 1 (0.52%) VBScript
11 1 (0.52%) XPath
Qualifications
1 34 (17.80%) Degree
1 34 (17.80%) Security Cleared
2 19 (9.95%) DV Cleared
3 17 (8.90%) ISTQB
4 13 (6.81%) SC Cleared
5 11 (5.76%) Computer Science Degree
6 5 (2.62%) Master's Degree
7 3 (1.57%) Azure Certification
8 2 (1.05%) ITIL Certification
9 1 (0.52%) BPSS Clearance
9 1 (0.52%) ISEB
9 1 (0.52%) ISTQB Advanced Certification
9 1 (0.52%) ISTQB Foundation Certification
9 1 (0.52%) Numerate Degree
Quality Assurance & Compliance
1 85 (44.50%) QA
2 23 (12.04%) Accessibility
3 4 (2.09%) Solvency II
3 4 (2.09%) WCAG
4 2 (1.05%) PMO
5 1 (0.52%) Software Quality Assurance
System Software
1 29 (15.18%) Docker
2 4 (2.09%) Active Directory
3 1 (0.52%) Firmware
Systems Management
1 21 (10.99%) Kubernetes
2 18 (9.42%) Terraform
3 7 (3.66%) MIIS
4 4 (2.09%) Ansible
5 2 (1.05%) Kustomize
5 2 (1.05%) Packer
Vendors
1 23 (12.04%) Microsoft
2 5 (2.62%) Oracle
3 4 (2.09%) Veracode
4 2 (1.05%) Atlassian
4 2 (1.05%) Finsemble
4 2 (1.05%) Google
4 2 (1.05%) Red Hat
4 2 (1.05%) Sitecore
5 1 (0.52%) OpenAI
5 1 (0.52%) SAP
5 1 (0.52%) ServiceNow