Data Integration Jobs with Hybrid/Remote/WFH Options

Data Integration
UK > Work from Home

The table below provides summary statistics for permanent remote or hybrid work requiring Data Integration skills. It includes a benchmarking guide to the annual salaries offered in vacancies that cited Data Integration over the 6 months leading up to 1 May 2025, comparing them to the same period in the previous two years.

6 months to
1 May 2025
Same period 2024 Same period 2023
Rank 188 305 403
Rank change year-on-year +117 +98 +4
Permanent jobs citing Data Integration 244 327 292
As % of all permanent jobs with a WFH option 1.63% 0.97% 0.68%
As % of the Processes & Methodologies category 1.75% 1.05% 0.71%
Number of salaries quoted 112 229 236
10th Percentile £47,257 £35,000 £45,563
25th Percentile £53,750 £50,250 £52,500
Median annual salary (50th Percentile) £68,500 £65,000 £65,000
Median % change year-on-year +5.38% - -7.14%
75th Percentile £102,500 £78,750 £80,000
90th Percentile £120,000 £90,387 £90,000
UK median annual salary £65,000 £67,000 £70,000
% change year-on-year -2.99% -4.29% +3.70%

All Process and Methodology Skills
Work from Home

Data Integration falls under the Processes and Methodologies category. For comparison with the information above, the following table provides summary statistics for all permanent job vacancies with remote or hybrid options requiring process or methodology skills.

Permanent vacancies with a requirement for process or methodology skills 13,930 31,014 41,082
As % of all permanent jobs with a WFH option 93.15% 91.65% 96.09%
Number of salaries quoted 9,709 23,583 28,561
10th Percentile £30,000 £33,930 £37,500
25th Percentile £45,000 £42,500 £47,500
Median annual salary (50th Percentile) £60,000 £57,500 £62,500
Median % change year-on-year +4.35% -8.00% +4.17%
75th Percentile £77,500 £75,000 £82,500
90th Percentile £102,500 £95,000 £100,000
UK median annual salary £57,500 £55,000 £61,500
% change year-on-year +4.55% -10.57% +2.50%

Data Integration
Trend for Jobs with a WFH Option

Job vacancies with remote working options citing Data Integration as a proportion of all IT jobs advertised.
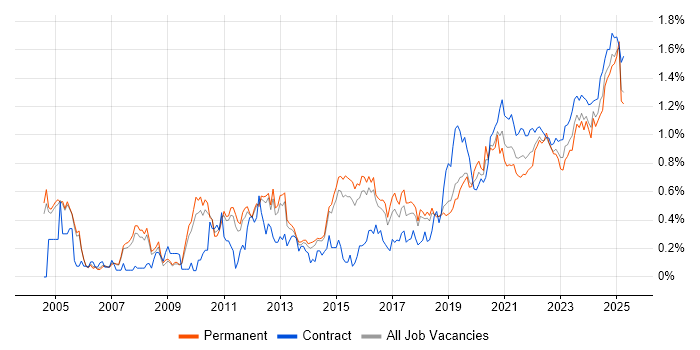
Data Integration trend for jobs with Hybrid/Remote/WFH options

Data Integration
Salary Trend for Jobs with a WFH Option

3-month moving average salary quoted in job vacancies with remote working options citing Data Integration.

Data Integration salary trend for jobs with a WFH option

Data Integration
Salary Histogram for Jobs with a WFH Option

Salary distribution for jobs with remote working options citing Data Integration over the 6 months to 1 May 2025.

Data Integration salary histogram for jobs with a WFH option

Data Integration
Co-occurring Skills and Capabilities with WFH Options by Category

The follow tables expand on the table above by listing co-occurrences grouped by category. The same employment type, locality and period is covered with up to 20 co-occurrences shown in each of the following categories:

Application Platforms
1 75 (30.74%) Oracle Application Server
2 14 (5.74%) Apache Spark
3 8 (3.28%) SAS
4 4 (1.64%) Apache
4 4 (1.64%) Apache Airflow
5 2 (0.82%) IBM Domino
5 2 (0.82%) SharePoint
6 1 (0.41%) Luigi
Applications
1 12 (4.92%) Microsoft Excel
2 8 (3.28%) Microsoft PowerPoint
3 5 (2.05%) Microsoft Project
4 1 (0.41%) Blender
4 1 (0.41%) Maya
Business Applications
1 13 (5.33%) Dynamics CRM
2 3 (1.23%) SAP MDG
2 3 (1.23%) SAP S/4HANA
3 2 (0.82%) Adobe Campaign
3 2 (0.82%) Dynamics NAV
3 2 (0.82%) Elite 3E
4 1 (0.41%) Oracle ERP
4 1 (0.41%) Salesforce CRM
4 1 (0.41%) SAP ERP
Cloud Services
1 78 (31.97%) Azure
2 49 (20.08%) Power Platform
3 33 (13.52%) AWS
4 23 (9.43%) GCP
5 20 (8.20%) Snowflake
6 19 (7.79%) Dynamics 365
7 17 (6.97%) Power Automate
8 16 (6.56%) PowerApps
9 14 (5.74%) Azure Logic Apps
10 12 (4.92%) Azure Data Factory
11 11 (4.51%) SaaS
12 10 (4.10%) Azure Synapse Analytics
12 10 (4.10%) Serverless
13 8 (3.28%) Azure Service Bus
13 8 (3.28%) GitHub
14 6 (2.46%) Azure Functions
15 5 (2.05%) Azure DevOps
16 4 (1.64%) AWS Lambda
16 4 (1.64%) Cloud Computing
16 4 (1.64%) WhatsApp
Communications & Networking
1 6 (2.46%) LoRaWAN
2 1 (0.41%) DNS
2 1 (0.41%) Firewall
2 1 (0.41%) SD-WAN
2 1 (0.41%) SMS
2 1 (0.41%) VPN
2 1 (0.41%) WAN
Database & Business Intelligence
1 119 (48.77%) Data Warehouse
2 80 (32.79%) Enterprise Data Warehouse
3 75 (30.74%) Oracle Reports
4 40 (16.39%) SQL Server
5 39 (15.98%) Power BI
6 25 (10.25%) Data Lake
7 21 (8.61%) SQL Server Integration Services
8 14 (5.74%) Hadoop
8 14 (5.74%) Tableau
9 13 (5.33%) SQL Server Reporting Services
10 11 (4.51%) NoSQL
11 10 (4.10%) Big Data
12 8 (3.28%) Amazon Redshift
12 8 (3.28%) Metadata
12 8 (3.28%) PostgreSQL
13 7 (2.87%) BigQuery
14 6 (2.46%) Relational Database
15 5 (2.05%) SAP HANA
15 5 (2.05%) Spark SQL
16 4 (1.64%) PowerPivot
Development Applications
1 7 (2.87%) Git
2 6 (2.46%) JIRA
3 4 (1.64%) Visual Studio
4 3 (1.23%) LSMW
5 1 (0.41%) Oracle Forms
5 1 (0.41%) Team Foundation Server
General
1 148 (60.66%) Social Skills
2 124 (50.82%) Finance
3 116 (47.54%) Analytical Skills
4 78 (31.97%) Organisational Skills
5 75 (30.74%) Military
6 22 (9.02%) Marketing
7 19 (7.79%) Inclusion and Diversity
8 12 (4.92%) Banking
8 12 (4.92%) Legal
9 10 (4.10%) Public Sector
10 9 (3.69%) Presentation Skills
11 7 (2.87%) Law
11 7 (2.87%) Retail
12 5 (2.05%) Games
13 3 (1.23%) Advertising
13 3 (1.23%) French Language
14 2 (0.82%) Financial Institution
14 2 (0.82%) Pharmaceutical
14 2 (0.82%) Police
15 1 (0.41%) Back Office
Job Titles
1 40 (16.39%) Architect
2 34 (13.93%) Data Engineer
3 33 (13.52%) Lead
4 27 (11.07%) Senior
5 25 (10.25%) Database Engineer
6 18 (7.38%) Developer
7 17 (6.97%) Lead Architect
8 14 (5.74%) Data Manager
9 13 (5.33%) Data Architect
10 12 (4.92%) Solutions Architect
11 9 (3.69%) Senior Data Warehouse Specialist
12 8 (3.28%) Analyst
12 8 (3.28%) Consultant
12 8 (3.28%) Presales Specialist
13 7 (2.87%) Enterprise Management Architect
13 7 (2.87%) Enterprise Solutions Architect
13 7 (2.87%) Lead Solutions Architect
14 6 (2.46%) Account Manager
14 6 (2.46%) Project Manager
14 6 (2.46%) Senior Manager
Libraries, Frameworks & Software Standards
1 16 (6.56%) .NET
2 15 (6.15%) HTML
3 12 (4.92%) XML
4 11 (4.51%) CSS
4 11 (4.51%) JSON
5 10 (4.10%) SOAP
6 9 (3.69%) ASP.NET Web API
7 7 (2.87%) .NET Framework
7 7 (2.87%) RESTful
7 7 (2.87%) WCF
8 6 (2.46%) PySpark
8 6 (2.46%) REST
8 6 (2.46%) Web Services
9 5 (2.05%) Kafka
10 4 (1.64%) FastAPI
11 3 (1.23%) Flask
12 2 (0.82%) GraphQL
13 1 (0.41%) React
13 1 (0.41%) Redux
13 1 (0.41%) Swagger
Miscellaneous
1 14 (5.74%) Cloud Native
2 13 (5.33%) Management Information System
2 13 (5.33%) Product Ownership
3 9 (3.69%) Distributed Systems
4 7 (2.87%) Credit Risk
4 7 (2.87%) Market Risk
5 6 (2.46%) Driving Licence
5 6 (2.46%) Enterprise Software
5 6 (2.46%) IoT
5 6 (2.46%) NB-IoT
5 6 (2.46%) Smart City
5 6 (2.46%) Smart Meter
6 5 (2.05%) Algorithms
6 5 (2.05%) Replication
6 5 (2.05%) Virtual Team
7 4 (1.64%) Data Structures
7 4 (1.64%) Legacy Systems
8 3 (1.23%) Self-Motivation
9 2 (0.82%) Marketing Technology
9 2 (0.82%) Renewable Energy
Operating Systems
1 1 (0.41%) Android
1 1 (0.41%) Apple iOS
Processes & Methodologies
1 141 (57.79%) Analytics
2 125 (51.23%) Agile
3 123 (50.41%) Data Management
4 120 (49.18%) Data Modelling
5 118 (48.36%) DevOps
6 81 (33.20%) Business Analysis
6 81 (33.20%) Customer Experience
7 79 (32.38%) ITIL
7 79 (32.38%) Service Management
8 60 (24.59%) Problem-Solving
9 54 (22.13%) ETL
10 51 (20.90%) Business Intelligence
11 43 (17.62%) Data Engineering
12 42 (17.21%) Migration
13 36 (14.75%) Data Pipeline
14 35 (14.34%) CI/CD
15 34 (13.93%) Data Governance
16 31 (12.70%) Continuous Improvement
16 31 (12.70%) Project Management
17 30 (12.30%) Data Strategy
Programming Languages
1 86 (35.25%) SQL
2 48 (19.67%) Python
3 26 (10.66%) C#
4 21 (8.61%) JavaScript
5 15 (6.15%) PowerShell
5 15 (6.15%) T-SQL
6 12 (4.92%) R
7 9 (3.69%) Java
8 7 (2.87%) TypeScript
9 4 (1.64%) PL/SQL
9 4 (1.64%) Scala
10 2 (0.82%) Data Analysis Expressions
11 1 (0.41%) Bicep
11 1 (0.41%) C++
11 1 (0.41%) Go
11 1 (0.41%) Gremlin
11 1 (0.41%) JCL
11 1 (0.41%) Kotlin
11 1 (0.41%) SPARQL
11 1 (0.41%) Swift
Qualifications
1 79 (32.38%) DBS Check
2 31 (12.70%) Degree
3 19 (7.79%) Computer Science Degree
4 16 (6.56%) Master's Degree
5 12 (4.92%) Security Cleared
6 9 (3.69%) SC Cleared
7 7 (2.87%) PMI Certification
7 7 (2.87%) PMP
8 6 (2.46%) Azure Certification
9 4 (1.64%) Microsoft Certification
9 4 (1.64%) SAP Certification
10 3 (1.23%) AWS Certification
11 2 (0.82%) MBA
11 2 (0.82%) Numerate Degree
11 2 (0.82%) TOGAF Certification
12 1 (0.41%) ITIL Certification
Quality Assurance & Compliance
1 43 (17.62%) Data Quality
2 19 (7.79%) GDPR
3 15 (6.15%) Accessibility
4 7 (2.87%) Basel II
4 7 (2.87%) Basel III
4 7 (2.87%) Dodd-Frank
4 7 (2.87%) IFRS
4 7 (2.87%) IFRS 9
4 7 (2.87%) PCI DSS
5 6 (2.46%) SLA
6 3 (1.23%) HIPAA
6 3 (1.23%) QA
7 2 (0.82%) California Consumer Privacy Act
8 1 (0.41%) ISO/IEC 27001
8 1 (0.41%) Sarbanes-Oxley
System Software
1 4 (1.64%) HDFS
2 1 (0.41%) Docker
2 1 (0.41%) Virtual Machines
Systems Management
1 3 (1.23%) Kubernetes
1 3 (1.23%) Terraform
2 2 (0.82%) Systems Management Server (SMS)
3 1 (0.41%) Argo
3 1 (0.41%) Matomo
3 1 (0.41%) Single Sign-On
Vendors
1 91 (37.30%) Oracle
2 61 (25.00%) Microsoft
3 28 (11.48%) Databricks
4 18 (7.38%) SAP
5 16 (6.56%) Google
6 10 (4.10%) Teradata
7 9 (3.69%) Informatica
8 6 (2.46%) Adobe
8 6 (2.46%) ServiceNow
9 5 (2.05%) Foundry
9 5 (2.05%) Palantir
10 4 (1.64%) Salesforce
10 4 (1.64%) TikTok
11 2 (0.82%) IBM
11 2 (0.82%) Intapp
11 2 (0.82%) Salesforce Marketing Cloud
11 2 (0.82%) Samsung
11 2 (0.82%) Talend
12 1 (0.41%) ESRI
12 1 (0.41%) TippingPoint