Computer Science Degree Contracts in London

Computer Science Degree
England > London

The table below provides summary statistics for contract job vacancies advertised in London with a requirement for Computer Science Degree qualifications. It includes a benchmarking guide to the contractor rates offered over the 6 months leading up to 21 May 2025, comparing them to the same period in the previous two years.

6 months to
21 May 2025
Same period 2024 Same period 2023
Rank 138 101 179
Rank change year-on-year -37 +78 +116
Contract jobs citing Computer Science Degree 249 413 378
As % of all contract jobs advertised in London 2.02% 2.36% 1.45%
As % of the Qualifications category 7.80% 9.98% 6.65%
Number of daily rates quoted 166 266 297
10th Percentile £329 £330 £394
25th Percentile £405 £413 £500
Median daily rate (50th Percentile) £540 £525 £600
Median % change year-on-year +2.86% -12.50% +4.35%
75th Percentile £719 £684 £800
90th Percentile £825 £813 £900
England median daily rate £518 £525 £575
% change year-on-year -1.43% -8.70% +4.55%
Number of hourly rates quoted 4 17 4
10th Percentile £52.75 - £23.23
25th Percentile £55.00 £38.75 £28.06
Median hourly rate £61.25 £47.50 £42.00
Median % change year-on-year +28.95% +13.10% -1.18%
75th Percentile £67.81 £78.75 £61.25
90th Percentile £68.38 £83.75 £74.75
England median hourly rate £55.00 £55.63 £54.44
% change year-on-year -1.12% +2.19% +17.70%

All Academic and Professional Certifications
London

Computer Science Degree falls under the Academic Qualifications and Professional Certifications category. For comparison with the information above, the following table provides summary statistics for all contract job vacancies requiring academic qualifications or professional certifications in London.

Contract vacancies requiring academic qualifications or professional certifications 3,194 4,139 5,680
As % of all contract IT jobs advertised in London 25.85% 23.68% 21.83%
Number of daily rates quoted 2,145 2,814 3,859
10th Percentile £356 £325 £363
25th Percentile £438 £425 £463
Median daily rate (50th Percentile) £530 £538 £575
Median % change year-on-year -1.40% -6.52% +4.55%
75th Percentile £660 £650 £688
90th Percentile £763 £775 £800
England median daily rate £525 £538 £550
% change year-on-year -2.33% -2.27% +4.76%
Number of hourly rates quoted 60 108 80
10th Percentile £19.20 £14.19 £19.32
25th Percentile £24.06 £19.98 £21.24
Median hourly rate £28.60 £25.00 £42.25
Median % change year-on-year +14.40% -40.83% -5.06%
75th Percentile £55.25 £42.75 £64.63
90th Percentile £67.63 £68.23 £87.50
England median hourly rate £37.00 £40.00 £53.35
% change year-on-year -7.50% -25.02% +30.35%

Computer Science Degree
Job Vacancy Trend in London

Job postings citing Computer Science Degree as a proportion of all IT jobs advertised in London.
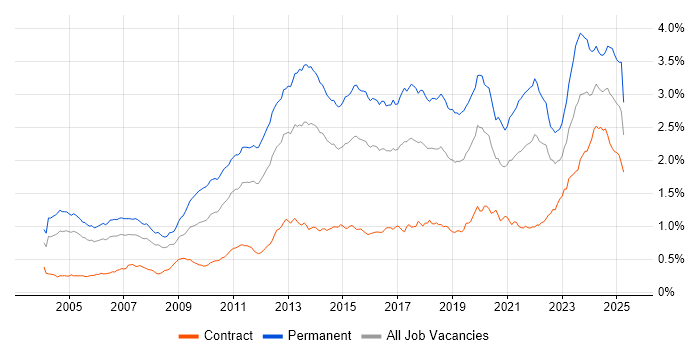
Job vacancy trend for Computer Science Degree in London

Computer Science Degree
Contractor Daily Rate Trend in London

3-month moving average daily rate quoted in jobs citing Computer Science Degree in London.

Daily rate trend for Computer Science Degree in London

Computer Science Degree
Daily Rate Histogram in London

Daily rate distribution for jobs citing Computer Science Degree in London over the 6 months to 21 May 2025.

Daily rate histogram for Computer Science Degree in London

Computer Science Degree
Contractor Hourly Rate Trend in London

3-month moving average hourly rates quoted in jobs citing Computer Science Degree in London.

Hourly rate trend for Computer Science Degree in London

Computer Science Degree
Hourly Rate Histogram in London

Hourly rate distribution of jobs citing Computer Science Degree in London over the 6 months to 21 May 2025.

Hourly rate histogram for Computer Science Degree in London

Computer Science Degree
Contract Job Locations in London

The table below looks at the demand and provides a guide to the median contractor rates quoted in IT jobs citing Computer Science Degree within the London region over the 6 months to 21 May 2025. The 'Rank Change' column provides an indication of the change in demand within each location based on the same 6 month period last year.

Location Rank Change
on Same Period
Last Year
Matching
Contract
IT Job Ads
Median
Daily Rate
Past 6 Months
Median Daily Rate
% Change
on Same Period
Last Year
Live
Jobs
Central London -10 38 £581 +2.88% 59
West London +9 7 £400 -15.79% 19
South London -1 1 £725 +98.63% 10
East London - 1 £650 - 5
Computer Science Degree
England

Computer Science Degree
Co-occurring Skills and Capabilities in London by Category

The follow tables expand on the table above by listing co-occurrences grouped by category. The same employment type, locality and period is covered with up to 20 co-occurrences shown in each of the following categories:

Application Platforms
1 9 (3.61%) Apache Spark
2 5 (2.01%) CMS
3 4 (1.61%) Apache
4 3 (1.20%) Confluence
5 2 (0.80%) Oracle Workflow
6 1 (0.40%) Adobe Experience Manager
6 1 (0.40%) Apache Airflow
6 1 (0.40%) BizTalk Server
6 1 (0.40%) Jupyter
6 1 (0.40%) Oracle Application Server
6 1 (0.40%) SAS
6 1 (0.40%) WebSphere
Applications
1 6 (2.41%) Microsoft Office
1 6 (2.41%) Oracle Smart View
2 4 (1.61%) Microsoft Excel
3 3 (1.20%) MS Visio
4 2 (0.80%) Microsoft PowerPoint
4 2 (0.80%) Microsoft Project
5 1 (0.40%) Chatbot
5 1 (0.40%) Trello
Business Applications
1 3 (1.20%) NEC Housing
1 3 (1.20%) SAP S/4HANA
2 2 (0.80%) Endur
2 2 (0.80%) Salesforce CRM
3 1 (0.40%) Dynamics CRM
3 1 (0.40%) Oracle ERP
3 1 (0.40%) Shopify
3 1 (0.40%) Temenos T24
Cloud Services
1 62 (24.90%) AWS
2 54 (21.69%) Azure
3 23 (9.24%) GCP
4 18 (7.23%) Power Platform
5 12 (4.82%) OCI
6 10 (4.02%) Azure DevOps
7 9 (3.61%) Amazon S3
7 9 (3.61%) SaaS
8 8 (3.21%) Cloud Computing
8 8 (3.21%) GitHub
9 5 (2.01%) Amazon EC2
10 4 (1.61%) Serverless
11 3 (1.20%) Amazon CloudWatch
11 3 (1.20%) Amazon SageMaker
11 3 (1.20%) AWS Lambda
11 3 (1.20%) Azure Data Factory
11 3 (1.20%) Entra ID
11 3 (1.20%) OpenShift
11 3 (1.20%) Salesforce Sales Cloud
11 3 (1.20%) Snowflake
Communications & Networking
1 23 (9.24%) Firewall
2 12 (4.82%) Network Security
2 12 (4.82%) TCP/IP
2 12 (4.82%) VPN
3 9 (3.61%) DNS
4 6 (2.41%) LAN
4 6 (2.41%) WAN
4 6 (2.41%) Wireless
5 5 (2.01%) BGP
5 5 (2.01%) Internet
5 5 (2.01%) OSPF
6 4 (1.61%) DHCP
6 4 (1.61%) SD-WAN
7 3 (1.20%) Broadband
7 3 (1.20%) Cisco Nexus
7 3 (1.20%) F5 BIG-IP GTM
7 3 (1.20%) F5 BIG-IP LTM
7 3 (1.20%) HSRP
7 3 (1.20%) LTE
7 3 (1.20%) MPLS
Database & Business Intelligence
1 19 (7.63%) Data Warehouse
2 16 (6.43%) Power BI
3 12 (4.82%) SQL Server
3 12 (4.82%) Tableau
4 9 (3.61%) PostgreSQL
5 8 (3.21%) Big Data
6 7 (2.81%) DB2
6 7 (2.81%) Hadoop
6 7 (2.81%) Oracle Database
6 7 (2.81%) Oracle ODI
6 7 (2.81%) Oracle Reports
7 6 (2.41%) MySQL
7 6 (2.41%) Oracle BI Publisher
7 6 (2.41%) Relational Database
8 5 (2.01%) Amazon RDS
8 5 (2.01%) KDB
8 5 (2.01%) Qlik Sense
9 4 (1.61%) Data Lake
9 4 (1.61%) Kdb+
9 4 (1.61%) NoSQL
Development Applications
1 26 (10.44%) Git
2 15 (6.02%) JIRA
3 12 (4.82%) Selenium
4 9 (3.61%) Jenkins
5 7 (2.81%) GitLab
5 7 (2.81%) JUnit
6 5 (2.01%) Bitbucket
6 5 (2.01%) Oracle Forms
7 4 (1.61%) Maven
8 3 (1.20%) Appium
8 3 (1.20%) Cypress.io
8 3 (1.20%) REST Assured
8 3 (1.20%) Sonatype Nexus
9 2 (0.80%) JMeter
9 2 (0.80%) Postman
10 1 (0.40%) IntelliJ
10 1 (0.40%) LoadRunner
10 1 (0.40%) NUnit
10 1 (0.40%) Subversion
10 1 (0.40%) Toad
General
1 131 (52.61%) Social Skills
2 90 (36.14%) Analytical Skills
3 80 (32.13%) Finance
4 23 (9.24%) Banking
5 13 (5.22%) Public Sector
6 12 (4.82%) Investment Banking
7 11 (4.42%) Front Office
7 11 (4.42%) Organisational Skills
8 9 (3.61%) Financial Institution
8 9 (3.61%) Marketing
9 6 (2.41%) Inclusion and Diversity
9 6 (2.41%) Presentation Skills
10 5 (2.01%) Retail
11 4 (1.61%) Influencing Skills
11 4 (1.61%) Manufacturing
12 3 (1.20%) Back Office
12 3 (1.20%) Electronics
12 3 (1.20%) Military
12 3 (1.20%) Telecoms
13 2 (0.80%) Billing
Job Titles
1 56 (22.49%) Developer
2 33 (13.25%) Senior
3 31 (12.45%) Architect
4 14 (5.62%) Software Engineer
5 13 (5.22%) Analyst
6 12 (4.82%) Lead
6 12 (4.82%) Network Engineer
7 10 (4.02%) Security Engineer
8 9 (3.61%) Consultant
8 9 (3.61%) Java Engineer
8 9 (3.61%) Python Developer
8 9 (3.61%) Solutions Architect
8 9 (3.61%) Test Engineer
9 8 (3.21%) DevOps Engineer
9 8 (3.21%) Security Architect
10 7 (2.81%) Information Security Engineer
10 7 (2.81%) Salesforce Developer
10 7 (2.81%) Senior Developer
11 6 (2.41%) Data Engineer
11 6 (2.41%) Security Consultant
Libraries, Frameworks & Software Standards
1 18 (7.23%) CSS
2 16 (6.43%) HTML
3 13 (5.22%) REST
4 11 (4.42%) Oracle Fusion
5 9 (3.61%) .NET
5 9 (3.61%) PySpark
5 9 (3.61%) React
5 9 (3.61%) Spring
6 8 (3.21%) OAuth
6 8 (3.21%) Web Services
7 7 (2.81%) AngularJS
7 7 (2.81%) OpenID
7 7 (2.81%) SAML
8 6 (2.41%) Lightning Web Components
8 6 (2.41%) TensorFlow
9 5 (2.01%) Kafka
9 5 (2.01%) Middleware
9 5 (2.01%) Node.js
9 5 (2.01%) SailPoint
9 5 (2.01%) Visualforce
Miscellaneous
1 26 (10.44%) Management Information System
2 16 (6.43%) Algorithms
2 16 (6.43%) Data Structures
3 13 (5.22%) Distributed Systems
4 10 (4.02%) Foreign Exchange (FX)
4 10 (4.02%) Security Posture
5 9 (3.61%) Enterprise Software
5 9 (3.61%) Product Ownership
6 8 (3.21%) Hedge funds
7 7 (2.81%) Greenfield Project
7 7 (2.81%) Mobile App
8 6 (2.41%) Data Protection Act
8 6 (2.41%) Virtual Team
9 5 (2.01%) Cloud Native
9 5 (2.01%) Legacy Systems
10 4 (1.61%) Data Centre
10 4 (1.61%) Linux Command Line
10 4 (1.61%) Low-Code
10 4 (1.61%) Reference Data
11 3 (1.20%) Equities
Operating Systems
1 23 (9.24%) Linux
2 10 (4.02%) Windows
3 8 (3.21%) Apple iOS
4 7 (2.81%) Android
5 5 (2.01%) Windows Server
6 4 (1.61%) Windows 10
7 3 (1.20%) Unix
8 2 (0.80%) AIX
8 2 (0.80%) Solaris
8 2 (0.80%) SUSE
9 1 (0.40%) Mac OS
Processes & Methodologies
1 248 (99.60%) Computer Science
2 126 (50.60%) Problem-Solving
3 85 (34.14%) Agile
4 47 (18.88%) DevOps
5 44 (17.67%) CI/CD
6 36 (14.46%) Software Engineering
7 30 (12.05%) Mentoring
8 28 (11.24%) Migration
8 28 (11.24%) Test Automation
9 27 (10.84%) Project Management
9 27 (10.84%) Scrum
10 24 (9.64%) Data Science
11 23 (9.24%) Data Governance
11 23 (9.24%) Decision-Making
11 23 (9.24%) Machine Learning
12 22 (8.84%) Analytics
12 22 (8.84%) Business Intelligence
13 21 (8.43%) Artificial Intelligence
13 21 (8.43%) Risk Management
14 20 (8.03%) Information Security
Programming Languages
1 88 (35.34%) Python
2 60 (24.10%) SQL
3 56 (22.49%) Java
4 31 (12.45%) JavaScript
5 16 (6.43%) C++
6 15 (6.02%) Bash
7 14 (5.62%) PowerShell
8 11 (4.42%) C#
9 8 (3.21%) Apex Code
10 6 (2.41%) Perl
11 5 (2.01%) PL/SQL
11 5 (2.01%) R
12 4 (1.61%) RPG
12 4 (1.61%) RPG IV
13 3 (1.20%) C
13 3 (1.20%) Data Analysis Expressions
13 3 (1.20%) PHP
13 3 (1.20%) Shell Script
13 3 (1.20%) T-SQL
14 2 (0.80%) Go
Qualifications
1 249 (100.00%) Degree
2 34 (13.65%) Master's Degree
3 31 (12.45%) Security Cleared
4 26 (10.44%) SC Cleared
5 16 (6.43%) AWS Certification
6 13 (5.22%) CISSP
7 11 (4.42%) Azure Certification
8 10 (4.02%) Cisco Certification
9 9 (3.61%) CCNA
10 8 (3.21%) PMI Certification
11 7 (2.81%) CCNP
11 7 (2.81%) CISM
11 7 (2.81%) Microsoft Certification
11 7 (2.81%) PhD
11 7 (2.81%) PMP
12 6 (2.41%) ISTQB
13 5 (2.01%) BPSS Clearance
13 5 (2.01%) JNCIA
13 5 (2.01%) OCP
13 5 (2.01%) Oracle Certification
Quality Assurance & Compliance
1 27 (10.84%) QA
2 19 (7.63%) ISO/IEC 27001
3 16 (6.43%) Data Quality
3 16 (6.43%) NIST
4 7 (2.81%) Sarbanes-Oxley
5 6 (2.41%) GDPR
5 6 (2.41%) ISO/IEC 27005
6 5 (2.01%) ISO/IEC 27002 (supersedes ISO/IEC 17799)
7 4 (1.61%) Accessibility
8 3 (1.20%) SLA
9 2 (0.80%) GRC
9 2 (0.80%) NCSC
10 1 (0.40%) California Consumer Privacy Act
10 1 (0.40%) HIPAA
10 1 (0.40%) PCI DSS
10 1 (0.40%) PMO
10 1 (0.40%) SOC 2
10 1 (0.40%) WCAG
System Software
1 17 (6.83%) Docker
2 4 (1.61%) Active Directory
3 2 (0.80%) Virtual Machines
3 2 (0.80%) VMware Infrastructure
4 1 (0.40%) BitLocker
4 1 (0.40%) Microsoft App-V
4 1 (0.40%) Virtual Desktop
4 1 (0.40%) XenApp
4 1 (0.40%) XenDesktop
Systems Management
1 18 (7.23%) Kubernetes
1 18 (7.23%) Terraform
2 13 (5.22%) Ansible
3 5 (2.01%) Progress Chef
3 5 (2.01%) Prometheus
3 5 (2.01%) Puppet
4 3 (1.20%) Control-M
4 3 (1.20%) Grafana
4 3 (1.20%) Istio
4 3 (1.20%) Rundeck
4 3 (1.20%) SCCM
5 2 (0.80%) Argo
5 2 (0.80%) Microsoft Intune
5 2 (0.80%) Single Sign-On
6 1 (0.40%) Docker Swarm
6 1 (0.40%) OPNET
6 1 (0.40%) WSUS
Vendors
1 29 (11.65%) Oracle
2 28 (11.24%) Microsoft
3 17 (6.83%) Google
4 13 (5.22%) Salesforce
5 11 (4.42%) Cisco
6 10 (4.02%) SAP
7 8 (3.21%) IBM
8 7 (2.81%) ServiceNow
9 6 (2.41%) Fortinet
10 5 (2.01%) Juniper
10 5 (2.01%) Meraki
11 4 (1.61%) Aruba
11 4 (1.61%) Databricks
11 4 (1.61%) F5
11 4 (1.61%) OutSystems
11 4 (1.61%) Palo Alto
12 3 (1.20%) CyberArk
12 3 (1.20%) Dataiku
12 3 (1.20%) Infoblox
12 3 (1.20%) SolarWinds