Lead Jobs in London

Leader
England > London

The median Leader salary in London is £90,000 per year, according to job vacancies posted during the 6 months leading to 30 April 2025.

The table below provides salary benchmarking and summary statistics, comparing them to the same period in the previous two years.

6 months to
30 Apr 2025
Same period 2024 Same period 2023
Rank 23 16 28
Rank change year-on-year -7 +12 +6
Permanent jobs requiring a Lead 1,092 2,178 3,003
As % of all permanent jobs advertised in London 8.54% 9.24% 8.45%
As % of the Job Titles category 9.48% 9.82% 8.88%
Number of salaries quoted 792 1,697 2,226
10th Percentile £60,000 £52,500 £57,500
25th Percentile £72,500 £68,750 £70,000
Median annual salary (50th Percentile) £90,000 £87,500 £90,000
Median % change year-on-year +2.86% -2.78% +2.86%
75th Percentile £115,000 £107,500 £107,500
90th Percentile £130,000 £122,500 £122,500
England median annual salary £72,500 £70,000 £75,000
% change year-on-year +3.57% -6.67% -

All Permanent IT Job Vacancies
London

For comparison with the information above, the following table provides summary statistics for all permanent IT job vacancies in London. Most job vacancies include a discernible job title that can be normalized. As such, the figures in the second row provide an indication of the number of permanent jobs in our overall sample.

Permanent vacancies in London with a recognized job title 11,514 22,184 33,802
% of permanent jobs with a recognized job title 90.08% 94.10% 95.06%
Number of salaries quoted 7,488 16,717 24,770
10th Percentile £41,250 £38,482 £42,500
25th Percentile £55,000 £51,250 £55,000
Median annual salary (50th Percentile) £75,000 £70,000 £72,500
Median % change year-on-year +7.14% -3.45% +3.57%
75th Percentile £100,000 £93,750 £95,000
90th Percentile £122,500 £115,000 £115,000
England median annual salary £57,500 £53,500 £60,567
% change year-on-year +7.48% -11.67% +0.95%

Lead
Job Vacancy Trend in London

Job postings that featured Lead in the job title as a proportion of all IT jobs advertised in London.
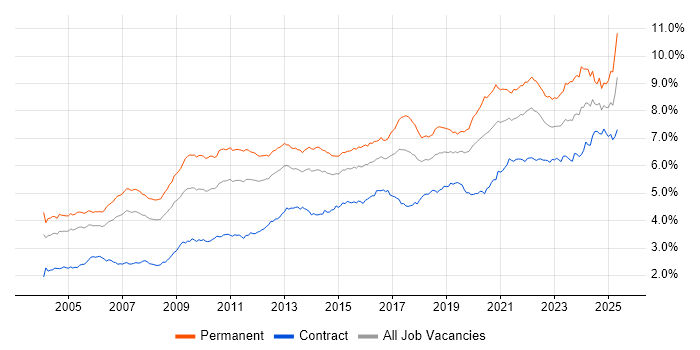
Job vacancy trend for Lead in London

Lead
Salary Trend in London

3-month moving average salary quoted in jobs citing Lead in London.

Salary trend for Lead in London

Lead
Salary Histogram in London

Salary distribution for jobs citing Lead in London over the 6 months to 30 April 2025.

Salary histogram for Lead in London

Lead
Job Locations in London

The table below looks at the demand and provides a guide to the median salaries quoted in IT jobs citing Lead within the London region over the 6 months to 30 April 2025. The 'Rank Change' column provides an indication of the change in demand within each location based on the same 6 month period last year.

Location Rank Change
on Same Period
Last Year
Matching
Permanent
IT Job Ads
Median Salary
Past 6 Months
Median Salary
% Change
on Same Period
Last Year
Live
Jobs
Central London -11 221 £95,000 +8.57% 82
West London +7 15 £67,500 -18.18% 32
South London -20 9 £61,644 -6.95% 20
East London -4 8 £80,000 +5.26% 17
North London +7 6 £69,250 +10.84%
Lead
England

Lead Skill Set
Top 30 Co-occurring Skills and Capabilities in London

For the 6 months to 30 April 2025, Lead job roles required the following skills and capabilities in order of popularity. The figures indicate the absolute number co-occurrences and as a proportion of all permanent job ads across the London region featuring Lead in the job title.

1 305 (27.93%) Agile
2 303 (27.75%) Social Skills
3 300 (27.47%) Finance
4 276 (25.27%) Azure
5 255 (23.35%) AWS
6 225 (20.60%) Python
7 222 (20.33%) Mentoring
8 200 (18.32%) Roadmaps
9 193 (17.67%) Problem-Solving
10 171 (15.66%) Microsoft
10 171 (15.66%) Software Engineering
11 169 (15.48%) Analytics
12 167 (15.29%) DevOps
13 164 (15.02%) SQL
14 155 (14.19%) Degree
15 144 (13.19%) CI/CD
16 141 (12.91%) Continuous Improvement
17 139 (12.73%) Java
18 137 (12.55%) Kubernetes
19 133 (12.18%) Analytical Skills
20 128 (11.72%) Artificial Intelligence
21 120 (10.99%) Data Governance
22 119 (10.90%) React
22 119 (10.90%) Decision-Making
23 115 (10.53%) JavaScript
24 105 (9.62%) Power Platform
25 104 (9.52%) Data Management
26 102 (9.34%) Law
27 101 (9.25%) Stakeholder Management
28 90 (8.24%) Microservices

Lead Skill Set
Co-occurring Skills and Capabilities in London by Category

The follow tables expand on the table above by listing co-occurrences grouped by category. The same employment type, locality and period is covered with up to 20 co-occurrences shown in each of the following categories:

Application Platforms
1 25 (2.29%) Confluence
2 21 (1.92%) SharePoint
3 19 (1.74%) Apache Spark
3 19 (1.74%) CMS
4 14 (1.28%) Microsoft Exchange
5 11 (1.01%) Drupal
5 11 (1.01%) WordPress
6 10 (0.92%) Apache Airflow
7 9 (0.82%) OpenEdge
8 5 (0.46%) Apache
9 4 (0.37%) Mule
9 4 (0.37%) Tomcat
10 3 (0.27%) Jupyter
10 3 (0.27%) Kinematics
10 3 (0.27%) Oracle Coherence
10 3 (0.27%) Oracle SOA Suite
11 2 (0.18%) BizTalk Server
12 1 (0.092%) CICS
12 1 (0.092%) Oracle Application Server
12 1 (0.092%) Oracle Workflow
Applications
1 17 (1.56%) Microsoft Office
2 16 (1.47%) Microsoft Excel
3 10 (0.92%) Chatbot
3 10 (0.92%) Microsoft PowerPoint
4 9 (0.82%) MS Visio
5 7 (0.64%) Maya
6 1 (0.092%) Adobe Creative Suite
6 1 (0.092%) InVision
6 1 (0.092%) Oracle Smart View
6 1 (0.092%) Simulink
6 1 (0.092%) Sketch
Business Applications
1 29 (2.66%) Dynamics CRM
2 6 (0.55%) Oracle EBS
2 6 (0.55%) Oracle ERP
3 3 (0.27%) Adobe Campaign
3 3 (0.27%) Oracle Applications
3 3 (0.27%) SAP CX
3 3 (0.27%) SAP S/4HANA
4 2 (0.18%) Eikon
4 2 (0.18%) Elite 3E
4 2 (0.18%) iTrent
4 2 (0.18%) RMDS
4 2 (0.18%) Shopify
4 2 (0.18%) Workday HCM
5 1 (0.092%) Aladdin
5 1 (0.092%) Oracle Payables
5 1 (0.092%) Oracle Payroll
5 1 (0.092%) Oracle Receivables
5 1 (0.092%) Payment Gateway
5 1 (0.092%) Salesforce CRM
5 1 (0.092%) SAP Hybris
Cloud Services
1 276 (25.27%) Azure
2 255 (23.35%) AWS
3 105 (9.62%) Power Platform
4 76 (6.96%) GCP
5 63 (5.77%) Serverless
6 43 (3.94%) Dynamics 365
7 42 (3.85%) SaaS
8 40 (3.66%) GitHub
9 36 (3.30%) Azure DevOps
10 32 (2.93%) Microsoft 365
11 30 (2.75%) AWS Lambda
12 28 (2.56%) Microsoft Purview
13 24 (2.20%) GitHub Actions
13 24 (2.20%) Power Automate
14 23 (2.11%) Snowflake
15 22 (2.01%) Cloud Computing
15 22 (2.01%) PowerApps
16 21 (1.92%) Amazon S3
17 18 (1.65%) Azure Synapse Analytics
17 18 (1.65%) Collibra
Communications & Networking
1 33 (3.02%) Firewall
2 22 (2.01%) WAN
3 21 (1.92%) VPN
4 17 (1.56%) DNS
5 16 (1.47%) Network Security
6 15 (1.37%) TCP/IP
7 14 (1.28%) LAN
8 13 (1.19%) DHCP
8 13 (1.19%) Wi-Fi
9 10 (0.92%) HTTP
9 10 (0.92%) SD-WAN
10 8 (0.73%) BGP
10 8 (0.73%) Cisco Firepower
11 7 (0.64%) Cisco ASA
12 6 (0.55%) IPsec
12 6 (0.55%) MPLS
12 6 (0.55%) OSPF
13 4 (0.37%) VLAN
13 4 (0.37%) VSAN
13 4 (0.37%) Wireless
Database & Business Intelligence
1 79 (7.23%) Power BI
2 66 (6.04%) Data Lake
3 56 (5.13%) SQL Server
4 38 (3.48%) Tableau
5 37 (3.39%) Data Warehouse
6 34 (3.11%) PostgreSQL
7 31 (2.84%) Metadata
8 29 (2.66%) MySQL
9 23 (2.11%) NoSQL
10 18 (1.65%) Big Data
10 18 (1.65%) MongoDB
11 14 (1.28%) Relational Database
12 11 (1.01%) Hadoop
13 10 (0.92%) SQL Server Integration Services
13 10 (0.92%) SQL Server Reporting Services
14 9 (0.82%) Amazon Redshift
14 9 (0.82%) GIS
14 9 (0.82%) IBM InfoSphere
15 8 (0.73%) BigQuery
16 6 (0.55%) Elasticsearch
Development Applications
1 51 (4.67%) JIRA
2 37 (3.39%) Git
3 34 (3.11%) Jenkins
4 15 (1.37%) Selenium
5 12 (1.10%) SonarQube
6 10 (0.92%) Bitbucket
6 10 (0.92%) PowerBuilder
6 10 (0.92%) webpack
7 9 (0.82%) Mocha
7 9 (0.82%) Postman
8 8 (0.73%) Gradle
8 8 (0.73%) MSTest
9 7 (0.64%) GitLab
9 7 (0.64%) Grunt
9 7 (0.64%) Maven
9 7 (0.64%) SoapUI
9 7 (0.64%) TeamCity
10 6 (0.55%) Jasmine
10 6 (0.55%) JMeter
10 6 (0.55%) JUnit
General
1 303 (27.75%) Social Skills
2 300 (27.47%) Finance
3 133 (12.18%) Analytical Skills
4 102 (9.34%) Law
5 82 (7.51%) Banking
6 74 (6.78%) Marketing
7 56 (5.13%) Legal
8 54 (4.95%) Front Office
9 51 (4.67%) Inclusion and Diversity
10 45 (4.12%) Influencing Skills
11 41 (3.75%) Retail
12 23 (2.11%) Games
13 21 (1.92%) Publishing
14 20 (1.83%) Investment Banking
14 20 (1.83%) Public Sector
15 18 (1.65%) Retail Banking
16 16 (1.47%) Advertising
17 15 (1.37%) Local Government
17 15 (1.37%) Organisational Skills
18 13 (1.19%) Financial Institution
Libraries, Frameworks & Software Standards
1 119 (10.90%) React
2 60 (5.49%) .NET
3 49 (4.49%) REST
4 39 (3.57%) Node.js
5 36 (3.30%) CSS
6 35 (3.21%) HTML
7 34 (3.11%) RESTful
8 33 (3.02%) SOAP
9 32 (2.93%) AngularJS
9 32 (2.93%) Kafka
10 30 (2.75%) GraphQL
11 24 (2.20%) Ruby on Rails
12 23 (2.11%) Django
13 22 (2.01%) jQuery
14 20 (1.83%) Middleware
14 20 (1.83%) Web Services
15 17 (1.56%) XML
16 16 (1.47%) React Native
16 16 (1.47%) Spring
16 16 (1.47%) Vue
Miscellaneous
1 66 (6.04%) Product Ownership
2 62 (5.68%) Cloud Native
3 43 (3.94%) Foreign Exchange (FX)
4 42 (3.85%) Management Information System
5 41 (3.75%) Fixed Income
5 41 (3.75%) Hedge funds
6 40 (3.66%) Derivative
7 39 (3.57%) Mobile App
8 37 (3.39%) Equities
9 30 (2.75%) Distributed Systems
10 26 (2.38%) Data Structures
11 24 (2.20%) NHS
12 23 (2.11%) Legacy Code
13 22 (2.01%) Data Centre
13 22 (2.01%) FMCG
14 18 (1.65%) Self-Motivation
15 17 (1.56%) Algorithms
16 16 (1.47%) Robotics
17 15 (1.37%) Greenfield Project
18 13 (1.19%) Legacy Systems
Operating Systems
1 63 (5.77%) Linux
2 50 (4.58%) Windows
3 27 (2.47%) Windows Server
4 25 (2.29%) Android
4 25 (2.29%) Apple iOS
5 8 (0.73%) Red Hat Enterprise Linux
5 8 (0.73%) Unix
6 3 (0.27%) Robot Operating System
6 3 (0.27%) Windows 10
7 2 (0.18%) Debian
7 2 (0.18%) VMS
7 2 (0.18%) Windows Server 2016
7 2 (0.18%) Windows Server 2019
8 1 (0.092%) Amazon Linux
8 1 (0.092%) CentOS
8 1 (0.092%) zOS
Processes & Methodologies
1 305 (27.93%) Agile
2 222 (20.33%) Mentoring
3 200 (18.32%) Roadmaps
4 193 (17.67%) Problem-Solving
5 171 (15.66%) Software Engineering
6 169 (15.48%) Analytics
7 167 (15.29%) DevOps
8 144 (13.19%) CI/CD
9 141 (12.91%) Continuous Improvement
10 128 (11.72%) Artificial Intelligence
11 120 (10.99%) Data Governance
12 119 (10.90%) Decision-Making
13 104 (9.52%) Data Management
14 101 (9.25%) Stakeholder Management
15 90 (8.24%) Machine Learning
15 90 (8.24%) Microservices
16 88 (8.06%) Technical Leadership
17 87 (7.97%) Coaching
18 85 (7.78%) Business Intelligence
18 85 (7.78%) Migration
Programming Languages
1 225 (20.60%) Python
2 164 (15.02%) SQL
3 139 (12.73%) Java
4 115 (10.53%) JavaScript
5 79 (7.23%) C#
6 62 (5.68%) TypeScript
7 52 (4.76%) PowerShell
8 51 (4.67%) C++
9 32 (2.93%) Go
10 27 (2.47%) C
11 26 (2.38%) Ruby
12 25 (2.29%) Rust
12 25 (2.29%) Scala
13 22 (2.01%) Bash
14 17 (1.56%) Kotlin
15 14 (1.28%) Swift
16 12 (1.10%) MATLAB
17 11 (1.01%) Objective-C
18 10 (0.92%) Data Analysis Expressions
19 8 (0.73%) Apex Code
Qualifications
1 155 (14.19%) Degree
2 58 (5.31%) Computer Science Degree
3 48 (4.40%) Security Cleared
4 33 (3.02%) Master's Degree
5 27 (2.47%) SC Cleared
6 22 (2.01%) Cisco Certification
7 21 (1.92%) AWS Certification
7 21 (1.92%) DBS Check
8 17 (1.56%) PhD
9 15 (1.37%) CCNA
10 12 (1.10%) Numerate Degree
11 11 (1.01%) Azure Certification
12 10 (0.92%) Microsoft Certification
13 8 (0.73%) ITIL Foundation Certificate
13 8 (0.73%) MBA
14 7 (0.64%) AWS Certified Cloud Practitioner
14 7 (0.64%) CCNP
14 7 (0.64%) CISSP
15 6 (0.55%) CISM
16 5 (0.46%) DV Cleared
Quality Assurance & Compliance
1 54 (4.95%) QA
2 44 (4.03%) Data Quality
3 41 (3.75%) GDPR
4 37 (3.39%) MiFID
5 34 (3.11%) ISO/IEC 27001
6 31 (2.84%) Accessibility
7 16 (1.47%) SLA
8 14 (1.28%) NIST
9 11 (1.01%) PCI DSS
10 8 (0.73%) WCAG
11 6 (0.55%) Good Clinical Practice
11 6 (0.55%) HIPAA
12 5 (0.46%) California Consumer Privacy Act
12 5 (0.46%) PMO
12 5 (0.46%) Sarbanes-Oxley
13 4 (0.37%) NIST 800
13 4 (0.37%) SOC 2
14 3 (0.27%) Cyber Essentials
14 3 (0.27%) GRC
14 3 (0.27%) Software Quality Assurance
System Software
1 83 (7.60%) Docker
2 35 (3.21%) Active Directory
3 9 (0.82%) VMware Infrastructure
4 7 (0.64%) Virtual Machines
5 6 (0.55%) Hyper-V
6 5 (0.46%) VMware ESXi
7 4 (0.37%) Firmware
8 1 (0.092%) Virtual Desktop
8 1 (0.092%) VMware NSX
Systems Management
1 137 (12.55%) Kubernetes
2 68 (6.23%) Terraform
3 28 (2.56%) Ansible
4 15 (1.37%) Grafana
5 14 (1.28%) Prometheus
6 10 (0.92%) Microsoft Intune
7 9 (0.82%) SCCM
8 8 (0.73%) Progress Chef
9 5 (0.46%) Single Sign-On
10 3 (0.27%) Control-M
10 3 (0.27%) FortiGate
10 3 (0.27%) vCenter Server
11 2 (0.18%) Argo
11 2 (0.18%) Istio
11 2 (0.18%) Kubeflow
11 2 (0.18%) NetBackup
11 2 (0.18%) Packer
11 2 (0.18%) Puppet
11 2 (0.18%) RSA Archer
12 1 (0.092%) Bugsnag
Vendors
1 171 (15.66%) Microsoft
2 66 (6.04%) Databricks
3 54 (4.95%) Google
4 33 (3.02%) Informatica
5 32 (2.93%) Salesforce
6 29 (2.66%) Oracle
7 22 (2.01%) ServiceNow
8 17 (1.56%) Cisco
9 16 (1.47%) VMware
10 14 (1.28%) IBM
11 13 (1.19%) Adobe
11 13 (1.19%) SAP
12 11 (1.01%) CheckPoint
13 9 (0.82%) New Relic
14 8 (0.73%) MuleSoft
14 8 (0.73%) SolarWinds
14 8 (0.73%) YouTube
15 7 (0.64%) Facebook
15 7 (0.64%) Meraki
16 6 (0.55%) Fortinet