Migration Jobs in London

Migration
England > London

The table below provides summary statistics for permanent job vacancies advertised in London requiring Migration skills. It includes a benchmarking guide to the annual salaries offered in vacancies that cited Migration over the 6 months leading up to 21 May 2025, comparing them to the same period in the previous two years.

6 months to
21 May 2025
Same period 2024 Same period 2023
Rank 57 85 71
Rank change year-on-year +28 -14 +27
Permanent jobs citing Migration 641 818 1,481
As % of all permanent jobs advertised in London 4.96% 3.46% 4.39%
As % of the Processes & Methodologies category 5.15% 3.80% 4.61%
Number of salaries quoted 462 592 1,154
10th Percentile £51,250 £46,500 £47,500
25th Percentile £61,250 £61,188 £58,375
Median annual salary (50th Percentile) £85,000 £75,000 £77,500
Median % change year-on-year +13.33% -3.23% +3.33%
75th Percentile £120,000 £95,000 £95,000
90th Percentile £152,500 £107,500 £115,000
England median annual salary £70,000 £60,000 £66,700
% change year-on-year +16.67% -10.04% +2.62%

All Process and Methodology Skills
London

Migration falls under the Processes and Methodologies category. For comparison with the information above, the following table provides summary statistics for all permanent job vacancies requiring process or methodology skills in London.

Permanent vacancies with a requirement for process or methodology skills 12,446 21,516 32,155
As % of all permanent jobs advertised in London 96.25% 90.97% 95.34%
Number of salaries quoted 7,205 15,872 23,232
10th Percentile £42,000 £37,500 £43,171
25th Percentile £55,500 £51,250 £55,000
Median annual salary (50th Percentile) £75,000 £70,000 £75,000
Median % change year-on-year +7.14% -6.67% +7.14%
75th Percentile £100,000 £95,000 £95,000
90th Percentile £122,500 £115,000 £115,000
England median annual salary £57,500 £55,000 £62,500
% change year-on-year +4.55% -12.00% +4.17%

Migration
Job Vacancy Trend in London

Job postings citing Migration as a proportion of all IT jobs advertised in London.
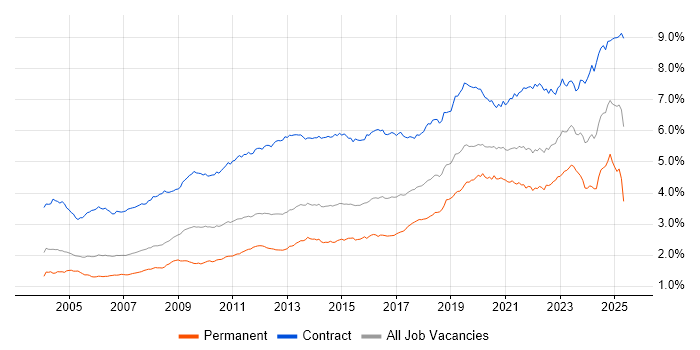
Job vacancy trend for Migration in London

Migration
Salary Trend in London

3-month moving average salary quoted in jobs citing Migration in London.

Salary trend for Migration in London

Migration
Salary Histogram in London

Salary distribution for jobs citing Migration in London over the 6 months to 21 May 2025.

Salary histogram for Migration in London

Migration
Job Locations in London

The table below looks at the demand and provides a guide to the median salaries quoted in IT jobs citing Migration within the London region over the 6 months to 21 May 2025. The 'Rank Change' column provides an indication of the change in demand within each location based on the same 6 month period last year.

Location Rank Change
on Same Period
Last Year
Matching
Permanent
IT Job Ads
Median Salary
Past 6 Months
Median Salary
% Change
on Same Period
Last Year
Live
Jobs
Central London +15 122 £75,250 -8.79% 66
East London -10 10 £100,000 -16.67% 6
North London - 5 £42,500 -
South London -17 4 £61,250 -31.56% 9
West London +11 3 £52,500 -38.24% 19
Migration
England

Migration
Co-occurring Skills and Capabilities in London by Category

The follow tables expand on the table above by listing co-occurrences grouped by category. The same employment type, locality and period is covered with up to 20 co-occurrences shown in each of the following categories:

Application Platforms
1 40 (6.24%) SharePoint
2 36 (5.62%) Microsoft Exchange
3 23 (3.59%) Apache Airflow
4 22 (3.43%) Apache
5 8 (1.25%) CMS
6 6 (0.94%) Confluence
7 5 (0.78%) Apache Spark
7 5 (0.78%) Oracle SOA Suite
8 3 (0.47%) IIS
9 2 (0.31%) SharePoint Server
10 1 (0.16%) nginx
10 1 (0.16%) Oracle Workflow
10 1 (0.16%) SAS
10 1 (0.16%) Umbraco
Applications
1 14 (2.18%) Microsoft Office
2 10 (1.56%) Microsoft Excel
3 6 (0.94%) Maya
3 6 (0.94%) MS Visio
4 3 (0.47%) Microsoft PowerPoint
5 1 (0.16%) Microsoft Project
Business Applications
1 31 (4.84%) NetSuite
2 25 (3.90%) Dynamics CRM
3 8 (1.25%) SAP S/4HANA
4 5 (0.78%) Sage 200
4 5 (0.78%) Sage 50
5 4 (0.62%) Endur
5 4 (0.62%) Oracle EBS
5 4 (0.62%) SAP CO
5 4 (0.62%) SAP FI
5 4 (0.62%) SAP FI/CO
5 4 (0.62%) Shopify
6 3 (0.47%) Dynamics AX
6 3 (0.47%) SAP FSCM
6 3 (0.47%) SAP IBP
6 3 (0.47%) SAP IS-U
7 2 (0.31%) Carpe Diem
7 2 (0.31%) Elite 3E
7 2 (0.31%) Oracle ERP
7 2 (0.31%) Salesforce CRM
8 1 (0.16%) Oracle Applications
Cloud Services
1 237 (36.97%) Azure
2 131 (20.44%) AWS
3 79 (12.32%) GCP
4 73 (11.39%) Microsoft 365
5 56 (8.74%) Power Platform
6 45 (7.02%) Dynamics 365
6 45 (7.02%) GitHub
7 38 (5.93%) Azure DevOps
8 31 (4.84%) Snowflake
9 30 (4.68%) SaaS
10 29 (4.52%) GitHub Actions
11 27 (4.21%) Amazon EKS
11 27 (4.21%) Entra ID
12 25 (3.90%) dbt
13 21 (3.28%) PowerApps
14 20 (3.12%) Amazon EC2
15 19 (2.96%) Amazon ECS
15 19 (2.96%) Dagster
16 18 (2.81%) Power Automate
17 17 (2.65%) Serverless
Communications & Networking
1 25 (3.90%) Firewall
2 21 (3.28%) DNS
3 13 (2.03%) Network Security
4 11 (1.72%) DHCP
4 11 (1.72%) LAN
4 11 (1.72%) WAN
5 9 (1.40%) VLAN
6 8 (1.25%) TCP/IP
7 7 (1.09%) VPN
8 6 (0.94%) Wi-Fi
9 5 (0.78%) SD-WAN
10 4 (0.62%) VoIP
11 3 (0.47%) BGP
11 3 (0.47%) NAS
11 3 (0.47%) SAN
11 3 (0.47%) Wireless
12 2 (0.31%) Cisco IOS
12 2 (0.31%) Cisco Nexus
12 2 (0.31%) DKIM
12 2 (0.31%) DMARC
Database & Business Intelligence
1 162 (25.27%) Data Lake
2 67 (10.45%) SQL Server
3 39 (6.08%) Power BI
4 33 (5.15%) Metadata
5 21 (3.28%) Apache Ignite
6 20 (3.12%) Amazon Athena
7 19 (2.96%) Apache Arrow
8 18 (2.81%) Apache Iceberg
8 18 (2.81%) Dremio
9 17 (2.65%) Data Warehouse
10 16 (2.50%) Tableau
11 15 (2.34%) Relational Database
11 15 (2.34%) SQL Server Reporting Services
12 12 (1.87%) NoSQL
13 10 (1.56%) PostgreSQL
13 10 (1.56%) RDBMS
14 9 (1.40%) Azure SQL Database
15 8 (1.25%) MongoDB
15 8 (1.25%) MySQL
16 7 (1.09%) Data Mining
Development Applications
1 30 (4.68%) Git
2 19 (2.96%) Jenkins
3 14 (2.18%) SonarQube
4 13 (2.03%) Gradle
5 10 (1.56%) JIRA
6 8 (1.25%) Maven
7 6 (0.94%) Browser DevTools
7 6 (0.94%) GitLab
8 4 (0.62%) Octopus Deploy
8 4 (0.62%) Selenium
9 2 (0.31%) Artifactory
9 2 (0.31%) FitNesse
9 2 (0.31%) TeamCity
10 1 (0.16%) Bitbucket
10 1 (0.16%) DbUnit
10 1 (0.16%) jMock
10 1 (0.16%) JUnit
10 1 (0.16%) Mockito
General
1 310 (48.36%) Finance
2 196 (30.58%) Social Skills
3 134 (20.90%) Front Office
4 130 (20.28%) Analytical Skills
5 79 (12.32%) Banking
6 44 (6.86%) Inclusion and Diversity
7 38 (5.93%) Investment Banking
8 29 (4.52%) Financial Institution
9 27 (4.21%) Games
9 27 (4.21%) Organisational Skills
10 25 (3.90%) Law
10 25 (3.90%) Marketing
10 25 (3.90%) Retail Banking
11 22 (3.43%) Public Sector
12 16 (2.50%) Presentation Skills
13 13 (2.03%) Retail
14 12 (1.87%) Legal
15 10 (1.56%) Influencing Skills
16 9 (1.40%) Back Office
17 6 (0.94%) Manufacturing
Job Titles
1 110 (17.16%) Architect
2 81 (12.64%) Lead
3 80 (12.48%) Senior
4 68 (10.61%) Developer
5 67 (10.45%) Consultant
6 39 (6.08%) Analyst
7 36 (5.62%) Functional Consultant
8 33 (5.15%) Solutions Architect
9 32 (4.99%) Data Architect
9 32 (4.99%) Data Governance Analyst
9 32 (4.99%) Data Governance Manager
9 32 (4.99%) Governance Manager
10 30 (4.68%) Head of Finance
11 28 (4.37%) Programme Manager
12 26 (4.06%) Business Analyst
13 25 (3.90%) AWS Engineer
13 25 (3.90%) NetSuite Consultant
14 24 (3.74%) Finance Manager
15 23 (3.59%) IT Support
15 23 (3.59%) Software Engineer
Libraries, Frameworks & Software Standards
1 42 (6.55%) .NET
2 40 (6.24%) React
3 32 (4.99%) HTML
4 28 (4.37%) RESTful
5 25 (3.90%) XML
6 23 (3.59%) PySpark
7 22 (3.43%) Kafka
8 20 (3.12%) .NET Framework
8 20 (3.12%) CSS
9 19 (2.96%) NumPy
9 19 (2.96%) Pandas
10 18 (2.81%) gRPC
10 18 (2.81%) Protocol Buffers
10 18 (2.81%) SciPy
11 17 (2.65%) JSON
12 15 (2.34%) SOAP
13 13 (2.03%) Lightning Web Components
14 12 (1.87%) GraphQL
14 12 (1.87%) Jest
15 11 (1.72%) REST
Miscellaneous
1 135 (21.06%) Foreign Exchange (FX)
2 129 (20.12%) Hedge funds
3 127 (19.81%) Fixed Income
4 125 (19.50%) Derivative
5 124 (19.34%) Equities
6 52 (8.11%) Product Ownership
7 48 (7.49%) Legacy Systems
8 47 (7.33%) Cloud Native
9 25 (3.90%) Management Information System
9 25 (3.90%) Mobile App
10 24 (3.74%) Data Centre
11 17 (2.65%) Mobile Games
12 14 (2.18%) Hybrid Cloud
13 13 (2.03%) Greenfield Project
14 12 (1.87%) Data Protection Act
14 12 (1.87%) Enterprise Software
15 11 (1.72%) Onboarding
16 8 (1.25%) Public Cloud
17 6 (0.94%) Data Structures
17 6 (0.94%) Private Cloud
Operating Systems
1 57 (8.89%) Windows
2 33 (5.15%) Windows Server
3 20 (3.12%) Apple iOS
4 19 (2.96%) Android
5 18 (2.81%) Linux
6 7 (1.09%) Mac OS
7 5 (0.78%) Unix
7 5 (0.78%) Windows 10
8 3 (0.47%) Windows Server 2016
8 3 (0.47%) zOS
9 2 (0.31%) Red Hat Enterprise Linux
9 2 (0.31%) Windows Server 2019
10 1 (0.16%) VMS
10 1 (0.16%) Windows Server 2008
10 1 (0.16%) Windows Server 2012
Processes & Methodologies
1 266 (41.50%) Agile
2 175 (27.30%) Problem-Solving
3 173 (26.99%) Data Migration
4 151 (23.56%) Roadmaps
5 131 (20.44%) Data Governance
6 129 (20.12%) Data Management
7 115 (17.94%) Regulatory Compliance
8 107 (16.69%) Investment Management
9 100 (15.60%) DevOps
10 93 (14.51%) CI/CD
11 74 (11.54%) CRM
11 74 (11.54%) Data Modelling
12 72 (11.23%) Project Management
13 63 (9.83%) Analytics
14 62 (9.67%) ERP
15 54 (8.42%) Software Engineering
16 51 (7.96%) Asset Management
16 51 (7.96%) Mentoring
17 48 (7.49%) Stakeholder Management
18 46 (7.18%) Computer Science
Programming Languages
1 103 (16.07%) SQL
2 86 (13.42%) Python
3 75 (11.70%) Java
4 58 (9.05%) JavaScript
5 48 (7.49%) PowerShell
6 42 (6.55%) C#
7 36 (5.62%) TypeScript
8 11 (1.72%) Apex Code
8 11 (1.72%) Bash
9 10 (1.56%) T-SQL
10 7 (1.09%) Bicep
10 7 (1.09%) Kotlin
10 7 (1.09%) Objective-C
10 7 (1.09%) Swift
11 5 (0.78%) C++
11 5 (0.78%) PL/SQL
12 4 (0.62%) Shell Script
12 4 (0.62%) VB
13 3 (0.47%) COBOL
13 3 (0.47%) JCL
Qualifications
1 88 (13.73%) Degree
2 40 (6.24%) AWS Certification
3 38 (5.93%) Azure Certification
4 35 (5.46%) Computer Science Degree
5 31 (4.84%) Security Cleared
6 26 (4.06%) SC Cleared
7 12 (1.87%) AWS Certified Solutions Architect
8 11 (1.72%) Microsoft Certification
8 11 (1.72%) PMI Certification
9 10 (1.56%) PMP
10 8 (1.25%) TOGAF Certification
11 7 (1.09%) CCNP
11 7 (1.09%) Cisco Certification
12 6 (0.94%) Oracle Certification
13 5 (0.78%) DBS Check
14 3 (0.47%) DV Cleared
14 3 (0.47%) Master's Degree
14 3 (0.47%) MCP
15 2 (0.31%) CCIE
15 2 (0.31%) PRINCE2 Practitioner
Quality Assurance & Compliance
1 52 (8.11%) MiFID
2 32 (4.99%) QA
3 25 (3.90%) Data Quality
4 16 (2.50%) ISO/IEC 27001
5 15 (2.34%) GDPR
6 5 (0.78%) HIPAA
6 5 (0.78%) ISO 20022
7 4 (0.62%) Cyber Essentials
8 3 (0.47%) NIST
8 3 (0.47%) PCI DSS
8 3 (0.47%) SLA
8 3 (0.47%) SOC 2
9 2 (0.31%) Accessibility
10 1 (0.16%) GRC
10 1 (0.16%) ISO 15022
10 1 (0.16%) ISO 9001
10 1 (0.16%) PMO
10 1 (0.16%) SEPA
System Software
1 40 (6.24%) Active Directory
2 27 (4.21%) Docker
3 14 (2.18%) VMware Infrastructure
4 13 (2.03%) Hyper-V
5 8 (1.25%) Virtual Desktop
6 4 (0.62%) Virtual Machines
7 3 (0.47%) BitLocker
7 3 (0.47%) VMware ESXi
7 3 (0.47%) vSphere
8 1 (0.16%) Job Entry Subsystem
8 1 (0.16%) Postfix
8 1 (0.16%) Time Sharing Option
8 1 (0.16%) VMware NSX
Systems Management
1 41 (6.40%) Terraform
2 39 (6.08%) Kubernetes
3 27 (4.21%) Microsoft Intune
4 19 (2.96%) Prometheus
5 16 (2.50%) Ansible
6 9 (1.40%) Failover Clustering
7 7 (1.09%) Argo
7 7 (1.09%) Grafana
7 7 (1.09%) SCCM
7 7 (1.09%) Single Sign-On
8 4 (0.62%) Avamar
8 4 (0.62%) NetBackup
8 4 (0.62%) Tivoli Storage Manager
9 3 (0.47%) AirWatch
9 3 (0.47%) VxRail
10 2 (0.31%) Active Directory Federation Services
10 2 (0.31%) Control-M
10 2 (0.31%) Progress Chef
10 2 (0.31%) Tivoli
11 1 (0.16%) Oracle RMAN
Vendors
1 192 (29.95%) Microsoft
2 30 (4.68%) Oracle
2 30 (4.68%) VMware
3 25 (3.90%) Salesforce
4 22 (3.43%) Databricks
5 17 (2.65%) Google
6 16 (2.50%) SAP
7 13 (2.03%) Cisco
8 12 (1.87%) New Relic
9 10 (1.56%) Citrix
10 7 (1.09%) Dell
10 7 (1.09%) Guidewire
10 7 (1.09%) Intapp
10 7 (1.09%) Palo Alto
11 6 (0.94%) MuleSoft
11 6 (0.94%) ServiceNow
12 5 (0.78%) IBM
12 5 (0.78%) iManage
12 5 (0.78%) Sage
12 5 (0.78%) Sophos