Banking Jobs in the UK excluding London

Banking
UK > UK excluding London

The table below looks at the prevalence of the term Banking in permanent job vacancies in the UK excluding London. Included is a benchmarking guide to the salaries offered in vacancies that cited Banking over the 6 months leading up to 30 May 2025, comparing them to the same period in the previous two years.

6 months to
30 May 2025
Same period 2024 Same period 2023
Rank 29 123 58
Rank change year-on-year +94 -65 +60
Permanent jobs citing Banking 2,726 1,659 2,984
As % of all permanent jobs advertised in the UK excluding London 6.92% 2.22% 5.14%
As % of the General category 10.22% 3.97% 7.54%
Number of salaries quoted 1,198 625 1,562
10th Percentile - £35,000 £39,294
25th Percentile £23,504 £50,000 £51,833
Median annual salary (50th Percentile) £25,087 £67,500 £64,875
Median % change year-on-year -62.83% +4.05% +8.99%
75th Percentile £68,114 £90,000 £77,715
90th Percentile £98,474 £100,064 £97,290
UK median annual salary £55,000 £85,000 £75,000
% change year-on-year -35.29% +13.33% +3.45%

All General Skills
UK excluding London

Banking falls under the General Skills category. For comparison with the information above, the following table provides summary statistics for all permanent job vacancies requiring common skills in the UK excluding London.

Permanent vacancies with a requirement for common skills 26,671 41,817 39,575
As % of all permanent jobs advertised in the UK excluding London 67.73% 56.08% 68.21%
Number of salaries quoted 11,889 26,883 18,174
10th Percentile £25,087 £26,000 £28,500
25th Percentile £32,500 £32,500 £37,500
Median annual salary (50th Percentile) £50,000 £47,500 £52,500
Median % change year-on-year +5.26% -9.52% +5.00%
75th Percentile £64,100 £62,200 £67,500
90th Percentile £77,500 £75,000 £81,250
UK median annual salary £55,000 £52,500 £60,000
% change year-on-year +4.76% -12.50% -

Banking
Job Vacancy Trend in the UK excluding London

Job postings citing Banking as a proportion of all IT jobs advertised in the UK excluding London.
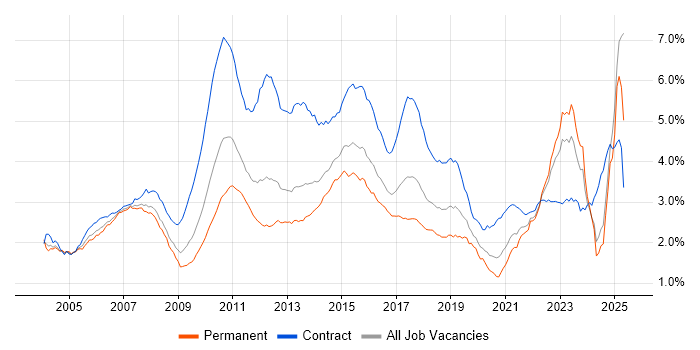
Job vacancy trend for Banking in the UK excluding London

Banking
Salary Trend in the UK excluding London

3-month moving average salary quoted in jobs citing Banking in the UK excluding London.

Salary trend for Banking in the UK excluding London

Banking
Salary Histogram in the UK excluding London

Salary distribution for jobs citing Banking in the UK excluding London over the 6 months to 30 May 2025.

Salary histogram for Banking in the UK excluding London

Banking
Job Locations in the UK excluding London

The table below looks at the demand and provides a guide to the median salaries quoted in IT jobs citing Banking within the UK excluding London region over the 6 months to 30 May 2025. The 'Rank Change' column provides an indication of the change in demand within each location based on the same 6 month period last year.

Location Rank Change
on Same Period
Last Year
Matching
Permanent
IT Job Ads
Median Salary
Past 6 Months
Median Salary
% Change
on Same Period
Last Year
Live
Jobs
North of England +114 1,115 £25,087 -64.16% 432
Scotland +31 585 £25,625 -64.53% 130
North West +116 583 £23,504 -65.68% 220
Wales +99 452 £23,504 -65.95% 51
South West +39 292 £30,235 -57.16% 218
Yorkshire +61 270 £48,507 -31.27% 168
North East +60 262 £25,087 -57.12% 48
Midlands +82 119 £63,750 +15.91% 342
East of England +76 72 £32,500 -35.00% 247
East Midlands +59 65 £26,118 -62.69% 147
South East +22 61 £90,000 +50.00% 995
West Midlands +43 52 £67,500 +22.73% 168
Northern Ireland +61 30 £23,504 -71.51% 44
Isle of Man - 4 - -
Channel Islands - 2 £78,750 - 4
Banking
UK

Banking
Co-occurring Skills and Capabilities in the UK excluding London by Category

The follow tables expand on the table above by listing co-occurrences grouped by category. The same employment type, locality and period is covered with up to 20 co-occurrences shown in each of the following categories:

Application Platforms
1 196 (7.19%) Confluence
2 25 (0.92%) SAS
3 11 (0.40%) Umbraco
4 9 (0.33%) Apache Spark
5 6 (0.22%) Apache
6 5 (0.18%) Adobe Experience Manager
7 4 (0.15%) CMS
7 4 (0.15%) Microsoft Exchange
8 3 (0.11%) NetWeaver
8 3 (0.11%) Tomcat
9 2 (0.073%) Cloud Foundry
9 2 (0.073%) SharePoint
9 2 (0.073%) WebSphere
10 1 (0.037%) CICS
10 1 (0.037%) GemFire
10 1 (0.037%) OpenStack
Applications
1 47 (1.72%) Microsoft PowerPoint
2 30 (1.10%) Microsoft Excel
3 22 (0.81%) Microsoft Office
4 7 (0.26%) Microsoft Project
5 4 (0.15%) Spreadsheet
6 3 (0.11%) MS Visio
7 1 (0.037%) Adobe Creative Suite
7 1 (0.037%) Sketch
Business Applications
1 2 (0.073%) Remedy ITSM
2 1 (0.037%) Distributed Ledger
2 1 (0.037%) NetSuite
2 1 (0.037%) Oracle BPM
2 1 (0.037%) Oracle ERP
2 1 (0.037%) Oracle Subledger Accounting
Cloud Services
1 399 (14.64%) Azure
2 374 (13.72%) AWS
3 336 (12.33%) GCP
4 35 (1.28%) Power Platform
5 30 (1.10%) GitHub
6 24 (0.88%) SaaS
7 19 (0.70%) Snowflake
8 16 (0.59%) Apigee
9 15 (0.55%) OpenShift
10 13 (0.48%) Google Kubernetes Engine
11 12 (0.44%) Azure Machine Learning
11 12 (0.44%) Cloud Composer
12 11 (0.40%) Cloud Computing
12 11 (0.40%) npm
12 11 (0.40%) PaaS
13 10 (0.37%) Microsoft 365
14 9 (0.33%) AWS Lambda
14 9 (0.33%) Serverless
15 8 (0.29%) Adobe Analytics
15 8 (0.29%) Amazon S3
Communications & Networking
1 1,440 (52.82%) Broadband
2 17 (0.62%) Internet
3 10 (0.37%) Network Security
4 5 (0.18%) DHCP
4 5 (0.18%) DNS
4 5 (0.18%) NAS
4 5 (0.18%) SAN
4 5 (0.18%) VSAN
5 4 (0.15%) DKIM
5 4 (0.15%) DMARC
5 4 (0.15%) DNSSEC
5 4 (0.15%) SMTP
6 3 (0.11%) TCP/IP
7 2 (0.073%) Firewall
7 2 (0.073%) Skype
7 2 (0.073%) SNA
7 2 (0.073%) VPN
8 1 (0.037%) HTTP
8 1 (0.037%) Intranet
Database & Business Intelligence
1 262 (9.61%) SQL Server
2 76 (2.79%) Big Data
3 45 (1.65%) NoSQL
4 35 (1.28%) Power BI
5 34 (1.25%) BigQuery
6 30 (1.10%) MongoDB
7 28 (1.03%) PostgreSQL
7 28 (1.03%) Tableau
8 25 (0.92%) Data Warehouse
9 21 (0.77%) Relational Database
10 14 (0.51%) Data Hub
11 13 (0.48%) Cloud Spanner
11 13 (0.48%) Metadata
12 9 (0.33%) Apache Cassandra
12 9 (0.33%) Data Lake
12 9 (0.33%) Looker
13 8 (0.29%) Amazon Athena
13 8 (0.29%) Metadata Repository
14 7 (0.26%) Ataccama
14 7 (0.26%) DB2
Development Applications
1 307 (11.26%) JIRA
2 269 (9.87%) Sonatype Nexus
3 268 (9.83%) Maven
4 267 (9.79%) SonarQube
5 263 (9.65%) Cucumber
5 263 (9.65%) GitLab
6 251 (9.21%) Selenium
7 246 (9.02%) Bitbucket
8 81 (2.97%) Git
9 68 (2.49%) Jenkins
10 20 (0.73%) Oracle Forms
11 16 (0.59%) JUnit
12 15 (0.55%) webpack
13 14 (0.51%) Cypress.io
14 9 (0.33%) IBM UrbanCode
15 6 (0.22%) Xcode
15 6 (0.22%) XCTest
16 4 (0.15%) ER Studio
16 4 (0.15%) Visual Studio
17 3 (0.11%) XCUITest
General
1 1,126 (41.31%) Finance
2 842 (30.89%) Games
3 347 (12.73%) Inclusion and Diversity
4 316 (11.59%) Social Skills
5 159 (5.83%) Analytical Skills
6 149 (5.47%) Retail
7 121 (4.44%) Investment Banking
8 91 (3.34%) Corporate Banking
9 83 (3.04%) Law
10 54 (1.98%) Financial Institution
11 39 (1.43%) Billing
12 34 (1.25%) Presentation Skills
13 33 (1.21%) French Language
14 30 (1.10%) Legal
14 30 (1.10%) Marketing
15 29 (1.06%) German Language
15 29 (1.06%) Influencing Skills
16 27 (0.99%) Retail Banking
17 20 (0.73%) Organisational Skills
18 19 (0.70%) Private Banking
Job Titles
1 875 (32.10%) Customer Service Advisor
2 418 (15.33%) Software Engineer
3 228 (8.36%) Senior
4 206 (7.56%) Analyst
5 149 (5.47%) Lead
6 84 (3.08%) Designer
7 80 (2.93%) UX Designer
8 79 (2.90%) Senior Designer
8 79 (2.90%) Senior UX Designer
9 76 (2.79%) Architect
10 72 (2.64%) Customer Service Representative
11 55 (2.02%) Solutions Architect
12 52 (1.91%) Sales Representative
13 51 (1.87%) Developer
14 47 (1.72%) Senior Software Engineer
15 43 (1.58%) Data Analyst
16 40 (1.47%) Senior Analyst
17 36 (1.32%) Credit Analyst
17 36 (1.32%) Lead Software Engineer
18 35 (1.28%) Java Engineer
Libraries, Frameworks & Software Standards
1 328 (12.03%) React
2 326 (11.96%) Spring Boot
3 323 (11.85%) Spring
4 313 (11.48%) Kafka
5 263 (9.65%) CSS
6 261 (9.57%) HTML
7 251 (9.21%) Redux
8 250 (9.17%) JPA
9 170 (6.24%) Hibernate
10 149 (5.47%) RESTful
11 105 (3.85%) Jest
12 100 (3.67%) REST
13 94 (3.45%) HTML5
14 91 (3.34%) CSS3
15 90 (3.30%) Sass
16 60 (2.20%) Software Packaging
17 43 (1.58%) Node.js
18 25 (0.92%) AngularJS
19 20 (0.73%) OAuth
20 15 (0.55%) .NET
Miscellaneous
1 359 (13.17%) Product Ownership
2 250 (9.17%) Enterprise Software
3 73 (2.68%) Public Cloud
4 62 (2.27%) Cloud Native
5 54 (1.98%) Credit Risk
6 48 (1.76%) Algorithms
7 42 (1.54%) Management Information System
8 33 (1.21%) Fixed Income
9 32 (1.17%) Distributed Systems
10 24 (0.88%) Mainframe
11 23 (0.84%) Private Cloud
12 21 (0.77%) Data Structures
13 20 (0.73%) Virtual Team
14 18 (0.66%) Mobile App
15 16 (0.59%) Reference Data
16 15 (0.55%) Online Banking
17 13 (0.48%) Analytical Mindset
18 11 (0.40%) Market Risk
18 11 (0.40%) Onboarding
18 11 (0.40%) Self-Motivation
Operating Systems
1 30 (1.10%) Windows
2 29 (1.06%) Linux
3 22 (0.81%) Android
4 16 (0.59%) Apple iOS
5 15 (0.55%) Unix
6 11 (0.40%) zOS
7 8 (0.29%) Red Hat Enterprise Linux
8 3 (0.11%) Windows 10
9 1 (0.037%) AIX
9 1 (0.037%) Windows Server
Processes & Methodologies
1 1,024 (37.56%) Customer Service
2 989 (36.28%) Problem-Solving
3 655 (24.03%) Agile
4 543 (19.92%) Software Engineering
5 406 (14.89%) CI/CD
6 402 (14.75%) DevOps
7 390 (14.31%) Microservices
8 350 (12.84%) Test Automation
9 330 (12.11%) Containerisation
10 323 (11.85%) SDLC
11 287 (10.53%) Full-Stack Development
12 269 (9.87%) Continuous Improvement
13 252 (9.24%) Performance Optimisation
14 251 (9.21%) Front End Development
15 235 (8.62%) TDD
16 225 (8.25%) Mentoring
17 221 (8.11%) User Experience
18 200 (7.34%) Analytics
19 189 (6.93%) Stakeholder Management
20 182 (6.68%) Artificial Intelligence
Programming Languages
1 444 (16.29%) Java
2 425 (15.59%) SQL
3 327 (12.00%) JavaScript
4 141 (5.17%) Python
5 126 (4.62%) TypeScript
6 40 (1.47%) C#
7 22 (0.81%) Go
8 16 (0.59%) Kotlin
9 13 (0.48%) Bash
10 9 (0.33%) R
10 9 (0.33%) Swift
11 7 (0.26%) PL/SQL
12 6 (0.22%) JCL
12 6 (0.22%) VBA
13 5 (0.18%) Groovy
14 4 (0.15%) PowerShell
14 4 (0.15%) T-SQL
15 3 (0.11%) Data Analysis Expressions
16 2 (0.073%) Scala
16 2 (0.073%) SOQL
Qualifications
1 214 (7.85%) Degree
2 51 (1.87%) Master's Degree
3 29 (1.06%) CFA
4 9 (0.33%) Microsoft Certification
5 8 (0.29%) CRISC
5 8 (0.29%) PhD
6 7 (0.26%) AWS Certification
7 6 (0.22%) CISA
7 6 (0.22%) CISM
7 6 (0.22%) CISSP
7 6 (0.22%) Computer Science Degree
8 5 (0.18%) AAT
8 5 (0.18%) Azure Certification
8 5 (0.18%) CBAP
8 5 (0.18%) VMware Certified Professional (VCP)
9 4 (0.15%) CCA
9 4 (0.15%) OCP
9 4 (0.15%) Oracle Certification
9 4 (0.15%) PMI Certification
9 4 (0.15%) PMP
Quality Assurance & Compliance
1 279 (10.23%) QA
2 211 (7.74%) Accessibility
3 34 (1.25%) Data Quality
4 15 (0.55%) Sarbanes-Oxley
5 9 (0.33%) SLA
6 8 (0.29%) GDPR
6 8 (0.29%) ITGC
7 7 (0.26%) COBIT
8 5 (0.18%) PCI DSS
9 4 (0.15%) Basel II
9 4 (0.15%) Basel III
9 4 (0.15%) Dodd-Frank
9 4 (0.15%) IFRS
9 4 (0.15%) IFRS 9
10 3 (0.11%) Actionable Recommendations
10 3 (0.11%) GMP
10 3 (0.11%) GRC
10 3 (0.11%) GxP
10 3 (0.11%) NIST
10 3 (0.11%) PMO
System Software
1 364 (13.35%) Docker
2 8 (0.29%) Virtual Machines
3 5 (0.18%) VMware NSX
4 2 (0.073%) Time Sharing Option
5 1 (0.037%) Active Directory
5 1 (0.037%) HDFS
5 1 (0.037%) NFS
5 1 (0.037%) VMware ESXi
Systems Management
1 400 (14.67%) Kubernetes
2 73 (2.68%) Terraform
3 16 (0.59%) Ansible
4 14 (0.51%) Istio
5 13 (0.48%) Grafana
6 11 (0.40%) Prometheus
6 11 (0.40%) Single Sign-On
7 8 (0.29%) Progress Chef
8 4 (0.15%) Argo
9 2 (0.073%) ITRS Geneos
9 2 (0.073%) Tivoli NetView
9 2 (0.073%) Tivoli Storage Manager
10 1 (0.037%) CA Endevor
10 1 (0.037%) CA Service Virtualization
10 1 (0.037%) Microsoft Intune
10 1 (0.037%) SCOM
10 1 (0.037%) vCenter Server
Vendors
1 1,440 (52.82%) BT
2 247 (9.06%) Solace
3 94 (3.45%) Google
4 78 (2.86%) Microsoft
5 52 (1.91%) Oracle
6 30 (1.10%) IBM
7 29 (1.06%) Bloomberg
8 27 (0.99%) Sun
9 20 (0.73%) Databricks
10 14 (0.51%) Adobe
11 11 (0.40%) ServiceNow
12 8 (0.29%) Avaloq
12 8 (0.29%) Cisco
13 7 (0.26%) Dynatrace
14 6 (0.22%) Apple
15 5 (0.18%) VMware
16 4 (0.15%) Atlassian
16 4 (0.15%) IronPort
16 4 (0.15%) Salesforce
16 4 (0.15%) Veritas