Performance Optimisation Jobs in the UK excluding London

Performance Optimisation
UK > UK excluding London

The table below provides summary statistics for permanent job vacancies advertised in the UK excluding London requiring Performance Optimisation skills. It includes a benchmarking guide to the annual salaries offered in vacancies that cited Performance Optimisation over the 6 months leading up to 28 May 2025, comparing them to the same period in the previous two years.

6 months to
28 May 2025
Same period 2024 Same period 2023
Rank 186 510 676
Rank change year-on-year +324 +166 +58
Permanent jobs citing Performance Optimisation 617 275 83
As % of all permanent jobs advertised in the UK excluding London 1.59% 0.37% 0.14%
As % of the Processes & Methodologies category 1.71% 0.45% 0.15%
Number of salaries quoted 257 200 58
10th Percentile £50,000 £35,000 £37,000
25th Percentile £62,500 £42,500 £49,063
Median annual salary (50th Percentile) £69,315 £60,000 £62,500
Median % change year-on-year +15.53% -4.00% +2.39%
75th Percentile £73,886 £71,250 £72,500
90th Percentile £83,750 £85,375 £79,000
UK median annual salary £69,315 £62,500 £70,000
% change year-on-year +10.90% -10.71% +12.90%

All Process and Methodology Skills
UK excluding London

Performance Optimisation falls under the Processes and Methodologies category. For comparison with the information above, the following table provides summary statistics for all permanent job vacancies requiring process or methodology skills in the UK excluding London.

Permanent vacancies with a requirement for process or methodology skills 36,047 60,812 55,780
As % of all permanent jobs advertised in the UK excluding London 92.70% 82.57% 95.55%
Number of salaries quoted 17,118 41,900 28,987
10th Percentile £26,338 £27,300 £30,500
25th Percentile £37,000 £36,250 £40,000
Median annual salary (50th Percentile) £51,645 £50,000 £55,000
Median % change year-on-year +3.29% -9.09% +4.76%
75th Percentile £65,000 £65,000 £70,000
90th Percentile £77,500 £77,500 £82,500
UK median annual salary £57,500 £55,000 £61,000
% change year-on-year +4.55% -9.84% +1.67%

Performance Optimisation
Job Vacancy Trend in the UK excluding London

Job postings citing Performance Optimisation as a proportion of all IT jobs advertised in the UK excluding London.
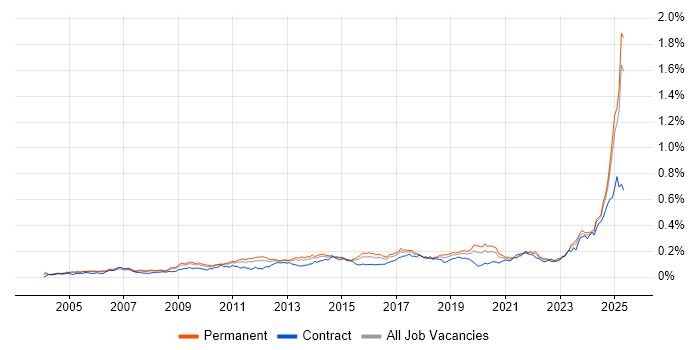
Job vacancy trend for Performance Optimisation in the UK excluding London

Performance Optimisation
Salary Trend in the UK excluding London

3-month moving average salary quoted in jobs citing Performance Optimisation in the UK excluding London.

Salary trend for Performance Optimisation in the UK excluding London

Performance Optimisation
Salary Histogram in the UK excluding London

Salary distribution for jobs citing Performance Optimisation in the UK excluding London over the 6 months to 28 May 2025.

Salary histogram for Performance Optimisation in the UK excluding London

Performance Optimisation
Job Locations in the UK excluding London

The table below looks at the demand and provides a guide to the median salaries quoted in IT jobs citing Performance Optimisation within the UK excluding London region over the 6 months to 28 May 2025. The 'Rank Change' column provides an indication of the change in demand within each location based on the same 6 month period last year.

Location Rank Change
on Same Period
Last Year
Matching
Permanent
IT Job Ads
Median Salary
Past 6 Months
Median Salary
% Change
on Same Period
Last Year
Live
Jobs
North of England +196 294 £69,315 +15.53% 456
North West +151 272 £69,315 +2.69% 219
South East +113 90 £82,500 +44.72% 528
Midlands +113 88 £52,500 -16.00% 365
East of England +89 66 £58,250 +1.30% 286
Scotland +149 54 £56,250 +7.14% 70
East Midlands +80 48 £52,500 -40.00% 139
West Midlands +78 40 £40,000 -36.00% 202
South West +89 22 £70,000 +40.00% 212
Yorkshire +60 11 £62,500 +8.70% 182
North East +42 11 £60,000 +9.09% 57
Wales +42 4 £60,500 +29.82% 63
Performance Optimisation
UK

Performance Optimisation
Co-occurring Skills and Capabilities in the UK excluding London by Category

The follow tables expand on the table above by listing co-occurrences grouped by category. The same employment type, locality and period is covered with up to 20 co-occurrences shown in each of the following categories:

Application Platforms
1 159 (25.77%) Confluence
2 10 (1.62%) Microsoft Exchange
3 8 (1.30%) WordPress
4 6 (0.97%) CMS
5 5 (0.81%) Headless CMS
6 4 (0.65%) Apache Spark
7 2 (0.32%) Apache
7 2 (0.32%) SharePoint
8 1 (0.16%) Apache Airflow
8 1 (0.16%) Umbraco
Applications
1 5 (0.81%) Simulink
2 2 (0.32%) Chatbot
3 1 (0.16%) Adobe After Effects
3 1 (0.16%) Adobe Creative Suite
3 1 (0.16%) Adobe Illustrator
3 1 (0.16%) InDesign
3 1 (0.16%) Microsoft Excel
3 1 (0.16%) Microsoft Office
3 1 (0.16%) Photoshop
Business Applications
1 2 (0.32%) Dynamics CRM
1 2 (0.32%) Payment Gateway
2 1 (0.16%) Magento
Cloud Services
1 355 (57.54%) AWS
2 336 (54.46%) Azure
3 178 (28.85%) GCP
4 65 (10.53%) Pulumi
5 33 (5.35%) Azure DevOps
6 31 (5.02%) Azure Cosmos DB
6 31 (5.02%) Azure Service Bus
7 29 (4.70%) SonarCloud
8 16 (2.59%) Power Platform
8 16 (2.59%) Snowflake
9 13 (2.11%) Serverless
10 12 (1.94%) Azure Logic Apps
11 11 (1.78%) PowerApps
12 10 (1.62%) Cloud Computing
12 10 (1.62%) Power Automate
13 8 (1.30%) Azure Data Factory
13 8 (1.30%) Stripe
14 5 (0.81%) AWS Lambda
14 5 (0.81%) Azure Synapse Analytics
15 4 (0.65%) GitHub
Communications & Networking
1 65 (10.53%) Broadband
2 14 (2.27%) Firewall
3 12 (1.94%) WAN
4 10 (1.62%) SAN
5 7 (1.13%) SD-WAN
6 6 (0.97%) DHCP
7 5 (0.81%) DNS
7 5 (0.81%) NAS
7 5 (0.81%) Network Security
7 5 (0.81%) VPN
7 5 (0.81%) VSAN
8 3 (0.49%) LAN
9 2 (0.32%) Cisco ISE
9 2 (0.32%) MQTT
9 2 (0.32%) SMS
9 2 (0.32%) Software-Defined Networking
9 2 (0.32%) TACACS
9 2 (0.32%) Wireless
10 1 (0.16%) IPsec
10 1 (0.16%) VLAN
Database & Business Intelligence
1 285 (46.19%) SQL Server
2 78 (12.64%) NoSQL
3 70 (11.35%) Relational Database
4 66 (10.70%) RDBMS
5 30 (4.86%) Elasticsearch
6 21 (3.40%) MongoDB
7 12 (1.94%) Data Warehouse
8 10 (1.62%) PostgreSQL
9 8 (1.30%) MySQL
10 6 (0.97%) Amazon Redshift
10 6 (0.97%) Data Lake
11 5 (0.81%) Azure SQL Database
11 5 (0.81%) BigQuery
11 5 (0.81%) Power BI
12 4 (0.65%) Hadoop
12 4 (0.65%) Redis
13 2 (0.32%) Big Data
13 2 (0.32%) DynamoDB
13 2 (0.32%) Endeca
13 2 (0.32%) Hazelcast
Development Applications
1 253 (41.00%) GitLab
2 250 (40.52%) JIRA
2 250 (40.52%) Selenium
3 247 (40.03%) Bitbucket
4 246 (39.87%) Cucumber
4 246 (39.87%) Maven
4 246 (39.87%) SonarQube
4 246 (39.87%) Sonatype Nexus
5 65 (10.53%) Jaeger
6 54 (8.75%) Git
7 29 (4.70%) MSBuild
7 29 (4.70%) Octopus Deploy
7 29 (4.70%) Team Foundation Server
7 29 (4.70%) Visual Studio
8 6 (0.97%) Jenkins
9 5 (0.81%) Oracle Forms
10 2 (0.32%) Cypress.io
10 2 (0.32%) MLflow
11 1 (0.16%) Karma Test Runner
11 1 (0.16%) Storybook
General
1 312 (50.57%) Inclusion and Diversity
2 271 (43.92%) Finance
3 252 (40.84%) Banking
4 158 (25.61%) Social Skills
5 120 (19.45%) Retail
6 90 (14.59%) Corporate Banking
6 90 (14.59%) Investment Banking
7 16 (2.59%) Analytical Skills
8 13 (2.11%) Marketing
9 9 (1.46%) Advertising
10 8 (1.30%) Law
11 7 (1.13%) Organisational Skills
11 7 (1.13%) Public Sector
12 6 (0.97%) Back Office
13 4 (0.65%) Aerospace
13 4 (0.65%) Electronics
14 3 (0.49%) Automotive
15 2 (0.32%) Aviation
15 2 (0.32%) Legal
15 2 (0.32%) Manufacturing
Job Titles
1 260 (42.14%) Software Engineer
2 121 (19.61%) Commissioning Manager
3 82 (13.29%) Lead
4 65 (10.53%) Team Leader
5 50 (8.10%) Developer
6 38 (6.16%) Architect
7 29 (4.70%) Senior
7 29 (4.70%) Technical Architect
8 20 (3.24%) Cloud Engineer
8 20 (3.24%) Infrastructure Engineer
9 17 (2.76%) Cloud Infrastructure Engineer
10 12 (1.94%) Azure Engineer
10 12 (1.94%) Azure Infrastructure Engineer
10 12 (1.94%) Data Engineer
11 10 (1.62%) .NET Developer
11 10 (1.62%) Front-End Developer (Client-Side Developer)
11 10 (1.62%) Senior Developer
12 8 (1.30%) Web Developer
13 7 (1.13%) DBA
13 7 (1.13%) Front-End Web Developer (Client-Side Web Developer)
Libraries, Frameworks & Software Standards
1 301 (48.78%) CSS
2 300 (48.62%) HTML
3 269 (43.60%) React
4 252 (40.84%) Kafka
5 250 (40.52%) Redux
6 248 (40.19%) Spring
6 248 (40.19%) Spring Boot
7 246 (39.87%) JPA
8 158 (25.61%) Hibernate
9 123 (19.94%) REST
10 102 (16.53%) RESTful
11 95 (15.40%) HTML5
12 94 (15.24%) CSS3
12 94 (15.24%) Jest
13 91 (14.75%) Sass
14 69 (11.18%) OpenTelemetry
15 66 (10.70%) Elastic Stack
16 49 (7.94%) .NET
17 32 (5.19%) JSON
18 31 (5.02%) ASP.NET
Miscellaneous
1 251 (40.68%) Product Ownership
2 248 (40.19%) Enterprise Software
3 9 (1.46%) Algorithms
3 9 (1.46%) Mobile App
4 8 (1.30%) Legacy Systems
4 8 (1.30%) Self-Motivation
5 7 (1.13%) Data Structures
5 7 (1.13%) Embedded Systems
5 7 (1.13%) Learning Management System
6 6 (0.97%) Management Information System
7 5 (0.81%) Hybrid Cloud
8 4 (0.65%) Social Media
9 3 (0.49%) ARM Cortex
9 3 (0.49%) Hedge funds
9 3 (0.49%) IoT
9 3 (0.49%) Virtual Team
10 2 (0.32%) Cloud Native
10 2 (0.32%) Distributed Systems
10 2 (0.32%) Marketing Technology
10 2 (0.32%) SIMD
Operating Systems
1 76 (12.32%) Linux
2 65 (10.53%) Unix
3 23 (3.73%) Windows
4 13 (2.11%) Windows Server
5 2 (0.32%) Android
5 2 (0.32%) Apple iOS
6 1 (0.16%) Ubuntu
Processes & Methodologies
1 374 (60.62%) DevOps
2 361 (58.51%) Agile
3 318 (51.54%) Containerisation
4 290 (47.00%) Microservices
5 279 (45.22%) Software Engineering
6 278 (45.06%) CI/CD
7 261 (42.30%) Front End Development
8 257 (41.65%) Full-Stack Development
9 254 (41.17%) Test Automation
10 250 (40.52%) SDLC
11 178 (28.85%) Continuous Improvement
12 174 (28.20%) Mentoring
13 161 (26.09%) Clean Code
14 159 (25.77%) TDD
15 123 (19.94%) People Management
16 117 (18.96%) User Experience
17 101 (16.37%) Migration
18 94 (15.24%) Responsive Web Design
19 91 (14.75%) Strategic Thinking
20 81 (13.13%) Roadmaps
Programming Languages
1 376 (60.94%) JavaScript
2 321 (52.03%) Java
3 312 (50.57%) SQL
4 108 (17.50%) TypeScript
5 103 (16.69%) Python
6 67 (10.86%) Bash
7 65 (10.53%) Go
8 47 (7.62%) C#
9 12 (1.94%) MATLAB
10 11 (1.78%) PowerShell
11 9 (1.46%) PHP
12 6 (0.97%) C++
13 4 (0.65%) C
14 2 (0.32%) Data Analysis Expressions
14 2 (0.32%) R
14 2 (0.32%) Scala
14 2 (0.32%) T-SQL
15 1 (0.16%) Dart
15 1 (0.16%) Elixir
15 1 (0.16%) Rust
Qualifications
1 159 (25.77%) Degree
2 137 (22.20%) Master's Degree
3 121 (19.61%) MBA
4 113 (18.31%) BPSS Clearance
5 70 (11.35%) AWS Certification
6 13 (2.11%) Computer Science Degree
7 12 (1.94%) Azure Certification
8 8 (1.30%) Microsoft Certification
8 8 (1.30%) Security Cleared
9 6 (0.97%) SC Cleared
10 5 (0.81%) VMware Certified Professional (VCP)
11 3 (0.49%) AWS Certified Solutions Architect
11 3 (0.49%) CCNP
11 3 (0.49%) Cisco Certification
11 3 (0.49%) CISSP
12 2 (0.32%) CCIE
13 1 (0.16%) CCNA
13 1 (0.16%) CISA
13 1 (0.16%) Network+ Certification
13 1 (0.16%) PhD
Quality Assurance & Compliance
1 255 (41.33%) QA
2 102 (16.53%) Accessibility
3 39 (6.32%) GDPR
4 7 (1.13%) WCAG
5 2 (0.32%) Data Quality
6 1 (0.16%) Actionable Recommendations
6 1 (0.16%) ISO 9001
6 1 (0.16%) ISO/IEC 27001
6 1 (0.16%) NEBOSH
6 1 (0.16%) PCI DSS
System Software
1 357 (57.86%) Docker
2 5 (0.81%) VMware NSX
3 4 (0.65%) Firmware
4 3 (0.49%) HDFS
5 2 (0.32%) Active Directory
6 1 (0.16%) Hyper-V
6 1 (0.16%) VMware Infrastructure
Systems Management
1 325 (52.67%) Kubernetes
2 80 (12.97%) Terraform
3 67 (10.86%) Ansible
3 67 (10.86%) Prometheus
4 65 (10.53%) Argo
4 65 (10.53%) Kustomize
5 5 (0.81%) Progress Chef
6 3 (0.49%) Grafana
7 2 (0.32%) Kubeflow
8 1 (0.16%) Kibana
Vendors
1 246 (39.87%) Solace
2 81 (13.13%) Google
3 36 (5.83%) Microsoft
4 8 (1.30%) Oracle
5 6 (0.97%) VMware
6 5 (0.81%) Cisco
6 5 (0.81%) Nimble Storage
7 4 (0.65%) Splunk
8 3 (0.49%) Adobe
8 3 (0.49%) Databricks
9 2 (0.32%) Informatica
9 2 (0.32%) Talend
10 1 (0.16%) Cloudera
10 1 (0.16%) CyberSource
10 1 (0.16%) Hotjar
10 1 (0.16%) Meru Networks
10 1 (0.16%) New Relic
10 1 (0.16%) Palo Alto
10 1 (0.16%) ServiceNow
10 1 (0.16%) WooCommerce