OpenID Connect (OIDC)
UK

The following table provides summary statistics for permanent job vacancies with a requirement for OpenID skills. Included is a benchmarking guide to the salaries offered in vacancies that have cited OpenID over the 6 months to 29 November 2023 with a comparison to the same period in the previous 2 years.

6 months to
29 Nov 2023
Same period 2022 Same period 2021
Rank 521 900 844
Rank change year-on-year +379 -56 -293
Permanent jobs citing OpenID 215 190 256
As % of all permanent jobs advertised in the UK 0.40% 0.15% 0.20%
As % of the Libraries, Frameworks & Software Standards category 1.50% 0.47% 0.51%
Number of salaries quoted 128 128 151
10th Percentile £50,875 £40,853 £51,647
25th Percentile £65,000 £62,500 £58,750
Median annual salary (50th Percentile) £75,000 £82,500 £80,000
Median % change year-on-year -9.09% +3.13% -5.88%
75th Percentile £84,056 £101,250 £101,250
90th Percentile £98,269 £108,750 £113,750
UK excluding London median annual salary £79,632 £67,500 £62,500
% change year-on-year +17.97% +8.00% +4.17%

All Software Libraries and Frameworks
UK

OpenID is in the Software Libraries and Frameworks category. The following table is for comparison with the above and provides summary statistics for all permanent job vacancies with a requirement for technical specification, industry standards, software libraries and framework skills.

Permanent vacancies with a requirement for technical specification, industry standards, software libraries and framework skills 14,303 40,800 50,175
As % of all permanent jobs advertised in the UK 26.43% 32.42% 38.88%
Number of salaries quoted 11,215 24,814 31,989
10th Percentile £41,250 £40,000 £36,250
25th Percentile £51,250 £49,995 £45,000
Median annual salary (50th Percentile) £67,250 £65,000 £60,000
Median % change year-on-year +3.46% +8.33% +4.35%
75th Percentile £85,000 £85,000 £80,000
90th Percentile £106,250 £104,991 £96,250
UK excluding London median annual salary £57,500 £57,500 £52,500
% change year-on-year - +9.52% +5.00%

OpenID
Job Vacancy Trend

Job postings citing OpenID as a proportion of all IT jobs advertised.
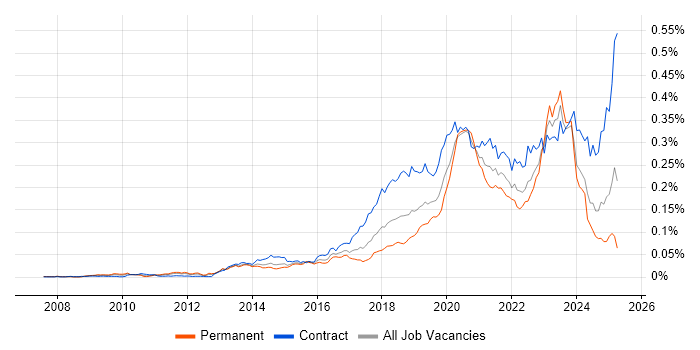
Job vacancy trend for OpenID in the UK

OpenID
Salary Trend

3-month moving average salary quoted in jobs citing OpenID.

Salary trend for OpenID in the UK

OpenID
Salary Histogram

Salary distribution for jobs citing OpenID over the 6 months to 29 November 2023.

Salary histogram for OpenID in the UK

OpenID
Top 15 Job Locations

The table below looks at the demand and provides a guide to the median salaries quoted in IT jobs citing OpenID within the UK over the 6 months to 29 November 2023. The 'Rank Change' column provides an indication of the change in demand within each location based on the same 6 month period last year.

Location Rank Change
on Same Period
Last Year
Matching
Permanent
IT Job Ads
Median Salary
Past 6 Months
Median Salary
% Change
on Same Period
Last Year
Live
Jobs
England +319 176 £78,566 -7.57% 38
UK excluding London +324 169 £79,632 +17.97% 28
Work from Home +284 92 £70,000 -9.68% 26
North of England +189 69 £79,632 +2.75% 6
South West +104 62 £70,576 +68.21% 7
Yorkshire +134 44 £79,632 +2.75% 2
London +195 33 £75,000 -18.63% 12
Scotland +88 30 £70,576 +41.15% 3
North West +128 23 £79,632 +17.97% 2
South East +143 5 £55,750 -18.91% 8
Midlands +129 3 £77,500 +3.33% 2
West Midlands +118 3 £77,500 - 2
East of England +118 3 £80,000 +33.67% 3
East Midlands +52 3 £77,500 +6.90%
North East +40 2 £65,000 -18.75% 2

OpenID
Co-occurring Skills and Capabilities by Category

The follow tables expand on the table above by listing co-occurrences grouped by category. The same employment type, locality and period is covered with up to 20 co-occurrences shown in each of the following categories:

Application Platforms
1 4 (1.86%) nginx
2 3 (1.40%) Apache
2 3 (1.40%) JBoss
3 2 (0.93%) Moodle
4 1 (0.47%) Confluence
4 1 (0.47%) IIS
4 1 (0.47%) WebSphere
Cloud Services
1 136 (63.26%) Azure
2 128 (59.53%) AWS
3 119 (55.35%) PaaS
4 111 (51.63%) GCP
5 102 (47.44%) SaaS
6 101 (46.98%) IaaS
7 29 (13.49%) AWS CloudFormation
8 11 (5.12%) Serverless
9 10 (4.65%) Entra ID
10 9 (4.19%) Azure Cosmos DB
10 9 (4.19%) Azure Service Bus
10 9 (4.19%) OpenShift
11 8 (3.72%) Amazon EKS
12 7 (3.26%) Azure DevOps
13 4 (1.86%) Cloud Computing
14 3 (1.40%) Amazon OpenSearch
14 3 (1.40%) Azure API Management
14 3 (1.40%) Azure Key Vault
14 3 (1.40%) GitHub
15 2 (0.93%) AWS Control Tower
Communications & Networking
1 30 (13.95%) DNS
2 29 (13.49%) DHCP
2 29 (13.49%) HTTP
2 29 (13.49%) TCP/IP
3 10 (4.65%) Kerberos
4 2 (0.93%) SSL
4 2 (0.93%) VPN
4 2 (0.93%) X.509
5 1 (0.47%) DMZ
5 1 (0.47%) Firewall
5 1 (0.47%) IPsec
5 1 (0.47%) Network Security
5 1 (0.47%) Software-Defined Networking
Database & Business Intelligence
1 108 (50.23%) NoSQL
2 99 (46.05%) Data Warehouse
3 98 (45.58%) Data Lake
4 12 (5.58%) MongoDB
5 10 (4.65%) Redis
6 9 (4.19%) Relational Database
7 8 (3.72%) BigQuery
8 5 (2.33%) SQL Server
9 3 (1.40%) Elasticsearch
9 3 (1.40%) PostgreSQL
10 1 (0.47%) Azure SQL Database
10 1 (0.47%) Power BI
10 1 (0.47%) SQL Server Integration Services
10 1 (0.47%) SQL Server Reporting Services
Development Applications
1 14 (6.51%) Jenkins
2 9 (4.19%) JIRA
3 6 (2.79%) Bitbucket
4 4 (1.86%) Postman
5 3 (1.40%) Git
5 3 (1.40%) Selenium
6 2 (0.93%) NUnit
6 2 (0.93%) TeamCity
6 2 (0.93%) Visual Studio
7 1 (0.47%) GitLab
7 1 (0.47%) Octopus Deploy
7 1 (0.47%) Team Foundation Server
General
1 154 (71.63%) Finance
2 124 (57.67%) Banking
3 73 (33.95%) Inclusion and Diversity
4 56 (26.05%) Retail
5 48 (22.33%) Social Skills
6 35 (16.28%) Marketing
7 5 (2.33%) Analytical Skills
8 3 (1.40%) Presentation Skills
8 3 (1.40%) Public Sector
9 2 (0.93%) Legal
9 2 (0.93%) Spanish Language
10 1 (0.47%) Games
10 1 (0.47%) Influencing Skills
10 1 (0.47%) Organisational Skills
10 1 (0.47%) Retail Finance
Job Titles
1 138 (64.19%) Architect
2 98 (45.58%) Enterprise Architect
3 46 (21.40%) Senior
4 41 (19.07%) Commercial Architect
5 28 (13.02%) Solutions Architect
6 25 (11.63%) Developer
7 18 (8.37%) Security Architect
8 17 (7.91%) Digital Architect
8 17 (7.91%) Digital Solutions Architect
8 17 (7.91%) Security Solutions Architect
9 15 (6.98%) Cloud Architect
10 14 (6.51%) DevOps Engineer
11 11 (5.12%) AWS Engineer
11 11 (5.12%) Azure Engineer
12 10 (4.65%) Senior Software Engineer
12 10 (4.65%) Software Engineer
13 9 (4.19%) Python Developer
13 9 (4.19%) Senior Architect
14 8 (3.72%) C# Software Engineer
14 8 (3.72%) Senior C# Software Engineer
Libraries, Frameworks & Software Standards
1 75 (34.88%) OAuth
2 71 (33.02%) SAML
3 57 (26.51%) Web Services
4 55 (25.58%) Kafka
5 53 (24.65%) REST
6 46 (21.40%) JWT
7 39 (18.14%) HTML
8 31 (14.42%) OAuth2
9 23 (10.70%) .NET
10 17 (7.91%) ASP.NET
11 12 (5.58%) .NET Framework
12 11 (5.12%) JSON
13 10 (4.65%) ASP.NET MVC
13 10 (4.65%) Keycloak
14 9 (4.19%) ASP.NET Core
14 9 (4.19%) Django
14 9 (4.19%) Flask
15 8 (3.72%) CSS
16 7 (3.26%) LDAP
16 7 (3.26%) Microsoft Graph
Miscellaneous
1 100 (46.51%) Blockchain
2 98 (45.58%) Mainframe
3 74 (34.42%) Cloud Native
4 51 (23.72%) Public Cloud
5 29 (13.49%) Cyberattack
6 19 (8.84%) Private Cloud
7 17 (7.91%) Data Centre
8 11 (5.12%) Distributed Systems
9 10 (4.65%) Data Structures
10 9 (4.19%) Self-Motivation
11 7 (3.26%) PKI
11 7 (3.26%) Product Ownership
12 6 (2.79%) Onboarding
13 3 (1.40%) Distributed Applications
13 3 (1.40%) Educational Technology
14 2 (0.93%) Bitcoin
14 2 (0.93%) Learning Management System
15 1 (0.47%) Distributed Denial-of-Service
15 1 (0.47%) Enterprise Software
15 1 (0.47%) Virtual Team
Operating Systems
1 106 (49.30%) Unix
2 25 (11.63%) Linux
3 6 (2.79%) Windows
4 2 (0.93%) Red Hat Enterprise Linux
4 2 (0.93%) Windows Server
5 1 (0.47%) Windows Server 2016
Processes & Methodologies
1 193 (89.77%) Agile
2 150 (69.77%) Roadmaps
3 125 (58.14%) Cybersecurity
4 117 (54.42%) Zero Trust
5 107 (49.77%) Microservices
6 102 (47.44%) Strategic Roadmap
7 101 (46.98%) Artificial Intelligence
8 100 (46.51%) Customer Service
9 98 (45.58%) Machine Learning
9 98 (45.58%) Thought Leadership
10 95 (44.19%) Technology Strategy
11 86 (40.00%) Enterprise Architecture
12 60 (27.91%) Event-Driven
12 60 (27.91%) IT Strategy
13 56 (26.05%) Event-Driven Architecture
14 54 (25.12%) Risk Management
15 52 (24.19%) Data Architecture
16 50 (23.26%) DevOps
17 45 (20.93%) Creative Thinking
18 42 (19.53%) Infrastructure as Code
Programming Languages
1 24 (11.16%) C#
1 24 (11.16%) Python
2 20 (9.30%) SQL
3 14 (6.51%) Java
4 12 (5.58%) JavaScript
5 4 (1.86%) Bicep
5 4 (1.86%) TypeScript
6 3 (1.40%) PowerShell
7 2 (0.93%) C++
8 1 (0.47%) Bash
8 1 (0.47%) Go
8 1 (0.47%) Kusto Query Language
8 1 (0.47%) PHP
8 1 (0.47%) T-SQL
8 1 (0.47%) XAML
Qualifications
1 44 (20.47%) Security Cleared
2 32 (14.88%) AWS Certification
3 31 (14.42%) DV Cleared
4 29 (13.49%) AWS Certified Solutions Architect
5 17 (7.91%) CISMP
6 10 (4.65%) Degree
7 9 (4.19%) SC Cleared
8 4 (1.86%) Computer Science Degree
9 3 (1.40%) Azure Certification
10 2 (0.93%) DBS Check
11 1 (0.47%) Master's Degree
11 1 (0.47%) Microsoft Certification
Quality Assurance & Compliance
1 17 (7.91%) GRC
2 15 (6.98%) QA
3 5 (2.33%) ISO/IEC 27001
4 1 (0.47%) GDPR
4 1 (0.47%) NIST
4 1 (0.47%) SOC 2
System Software
1 30 (13.95%) Docker
2 11 (5.12%) Active Directory
3 2 (0.93%) Squid
4 1 (0.47%) RACF
4 1 (0.47%) Virtual Desktop
4 1 (0.47%) Virtual Servers
Systems Management
1 68 (31.63%) Kubernetes
2 50 (23.26%) Terraform
3 16 (7.44%) Single Sign-On
4 13 (6.05%) Ansible
5 4 (1.86%) Active Directory Federation Services
5 4 (1.86%) MIIS
5 4 (1.86%) PingFederate
6 1 (0.47%) Istio
6 1 (0.47%) Nagios
6 1 (0.47%) Progress Chef
6 1 (0.47%) Puppet
Vendors
1 17 (7.91%) Google
2 16 (7.44%) Microsoft
3 10 (4.65%) Red Hat
4 4 (1.86%) Ping Identity
4 4 (1.86%) ServiceNow
5 3 (1.40%) Okta
6 2 (0.93%) Ariba
6 2 (0.93%) Atlassian
6 2 (0.93%) Blackboard
6 2 (0.93%) Oracle
6 2 (0.93%) SAP
6 2 (0.93%) Splunk
7 1 (0.47%) Databricks
7 1 (0.47%) ForgeRock
7 1 (0.47%) IBM
7 1 (0.47%) New Relic