Design Patterns
UK

The following table provides summary statistics for permanent job vacancies with a requirement for Design Patterns skills. Included is a benchmarking guide to the salaries offered in vacancies that have cited Design Patterns over the 6 months to 7 December 2023 with a comparison to the same period in the previous 2 years.

6 months to
7 Dec 2023
Same period 2022 Same period 2021
Rank 136 142 108
Rank change year-on-year +6 -34 +25
Permanent jobs citing Design Patterns 1,337 3,075 4,156
As % of all permanent jobs advertised in the UK 2.52% 2.50% 3.24%
As % of the Processes & Methodologies category 2.68% 2.61% 3.40%
Number of salaries quoted 702 1,754 2,318
10th Percentile £42,500 £46,215 £41,175
25th Percentile £50,019 £53,813 £47,500
Median annual salary (50th Percentile) £65,000 £75,000 £65,000
Median % change year-on-year -13.33% +15.38% +4.00%
75th Percentile £82,500 £95,000 £88,750
90th Percentile £97,500 £110,750 £112,500
UK excluding London median annual salary £55,000 £60,000 £55,000
% change year-on-year -8.33% +9.09% +4.76%

All Process and Methodology Skills
UK

Design Patterns is in the Processes and Methodologies category. The following table is for comparison with the above and provides summary statistics for all permanent job vacancies with a requirement for process or methodology skills.

Permanent vacancies with a requirement for process or methodology skills 49,863 117,613 122,319
As % of all permanent jobs advertised in the UK 94.11% 95.75% 95.45%
Number of salaries quoted 36,022 72,003 82,155
10th Percentile £32,500 £34,700 £32,500
25th Percentile £43,750 £45,000 £42,500
Median annual salary (50th Percentile) £60,000 £61,000 £60,000
Median % change year-on-year -1.64% +1.67% +9.09%
75th Percentile £80,000 £82,500 £77,500
90th Percentile £99,680 £100,000 £95,000
UK excluding London median annual salary £52,500 £53,500 £50,000
% change year-on-year -1.87% +7.00% +4.17%

Design Patterns
Job Vacancy Trend

Job postings citing Design Patterns as a proportion of all IT jobs advertised.
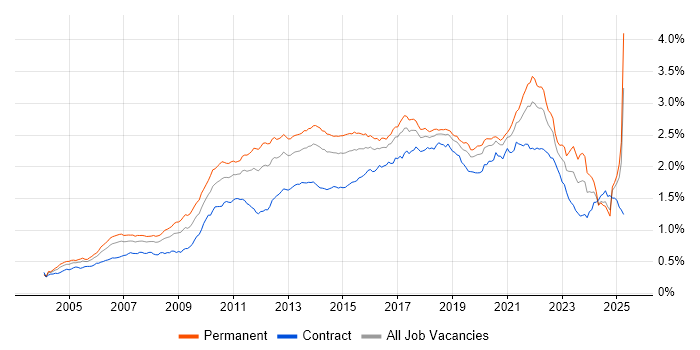
Job vacancy trend for Design Patterns in the UK

Design Patterns
Salary Trend

3-month moving average salary quoted in jobs citing Design Patterns.

Salary trend for Design Patterns in the UK

Design Patterns
Salary Histogram

Salary distribution for jobs citing Design Patterns over the 6 months to 7 December 2023.

Salary histogram for Design Patterns in the UK

Design Patterns
Top 17 Job Locations

The table below looks at the demand and provides a guide to the median salaries quoted in IT jobs citing Design Patterns within the UK over the 6 months to 7 December 2023. The 'Rank Change' column provides an indication of the change in demand within each location based on the same 6 month period last year.

Location Rank Change
on Same Period
Last Year
Matching
Permanent
IT Job Ads
Median Salary
Past 6 Months
Median Salary
% Change
on Same Period
Last Year
Live
Jobs
England +1 1,056 £65,000 -13.91% 418
UK excluding London +78 867 £55,000 -8.33% 304
Work from Home +75 866 £65,000 -13.33% 271
London -58 380 £80,000 -8.57% 164
North of England +109 254 £65,000 -7.14% 100
North West +161 157 £65,000 +13.04% 59
South East +6 143 £55,000 -8.33% 88
Midlands +106 135 £60,000 - 40
South West +91 127 £45,000 -14.29% 34
Scotland +30 97 £58,750 +14.63% 17
Yorkshire +44 86 £60,000 -22.58% 29
West Midlands +96 68 £57,500 -14.81% 27
East Midlands +61 67 £65,000 +13.04% 13
Wales +24 53 £50,000 -1.19% 12
Northern Ireland +36 49 £57,500 +18.56% 5
North East +38 11 £51,750 -20.38% 13
East of England +2 11 £75,000 - 12

Design Patterns
Co-occurring Skills and Capabilities by Category

The follow tables expand on the table above by listing co-occurrences grouped by category. The same employment type, locality and period is covered with up to 20 co-occurrences shown in each of the following categories:

Application Platforms
1 58 (4.34%) Confluence
2 16 (1.20%) CMS
3 14 (1.05%) Apache Spark
4 13 (0.97%) NServiceBus
5 10 (0.75%) SharePoint
6 8 (0.60%) Apache Solr
7 6 (0.45%) Drupal
7 6 (0.45%) SharePoint 2010
7 6 (0.45%) SharePoint 2013
7 6 (0.45%) Tomcat
8 5 (0.37%) IIS
9 4 (0.30%) nginx
10 3 (0.22%) Anypoint
10 3 (0.22%) Apache
10 3 (0.22%) Apache Pig
10 3 (0.22%) BizTalk Server
10 3 (0.22%) Sitecore CMS
10 3 (0.22%) Umbraco
11 2 (0.15%) Jetty
12 1 (0.075%) ArcGIS
Applications
1 2 (0.15%) Adobe XD
1 2 (0.15%) Sketch
2 1 (0.075%) 3ds Max
2 1 (0.075%) Adobe Creative Suite
2 1 (0.075%) Microsoft Project
Business Applications
1 10 (0.75%) Dynamics CRM
2 6 (0.45%) Maximo
3 3 (0.22%) Dynamics NAV
4 2 (0.15%) Payment Gateway
4 2 (0.15%) SDL Web 8
4 2 (0.15%) Shopify
5 1 (0.075%) Elite 3E
5 1 (0.075%) Salesforce CRM
5 1 (0.075%) SystmOne
Cloud Services
1 430 (32.16%) Serverless
2 417 (31.19%) Azure
3 372 (27.82%) AWS
4 152 (11.37%) GCP
5 103 (7.70%) OpenShift
6 90 (6.73%) Azure DevOps
7 71 (5.31%) SaaS
8 55 (4.11%) PaaS
9 39 (2.92%) IaaS
10 36 (2.69%) GitHub
11 32 (2.39%) AWS Lambda
12 23 (1.72%) Azure Monitor
12 23 (1.72%) Azure Service Bus
13 22 (1.65%) Azure Cosmos DB
13 22 (1.65%) Azure Functions
14 20 (1.50%) Azure AKS
15 19 (1.42%) Azure Logic Apps
16 18 (1.35%) Power Platform
17 16 (1.20%) Cloud Computing
17 16 (1.20%) Dynamics 365
Communications & Networking
1 16 (1.20%) HTTP
2 10 (0.75%) TCP/IP
3 5 (0.37%) DNS
4 4 (0.30%) Firewall
4 4 (0.30%) HTTPS
5 3 (0.22%) Network Security
5 3 (0.22%) SSL
6 2 (0.15%) VPN
7 1 (0.075%) ATM
7 1 (0.075%) IPsec
7 1 (0.075%) Kerberos
7 1 (0.075%) RS-232
7 1 (0.075%) RS-485
Database & Business Intelligence
1 187 (13.99%) SQL Server
2 173 (12.94%) Relational Database
3 133 (9.95%) RDBMS
4 92 (6.88%) Data Warehouse
5 87 (6.51%) Oracle Database
6 73 (5.46%) MongoDB
7 71 (5.31%) NoSQL
8 64 (4.79%) PostgreSQL
9 61 (4.56%) MySQL
10 47 (3.52%) Elasticsearch
11 38 (2.84%) Redis
12 36 (2.69%) Hadoop
13 35 (2.62%) Big Data
14 27 (2.02%) DynamoDB
15 24 (1.80%) Metadata
16 17 (1.27%) SQL Server Integration Services
17 15 (1.12%) Azure SQL Database
18 13 (0.97%) Power BI
19 10 (0.75%) Data Lake
19 10 (0.75%) Event Store
Development Applications
1 433 (32.39%) Git
2 103 (7.70%) JIRA
3 63 (4.71%) Visual Studio
4 61 (4.56%) Jenkins
5 36 (2.69%) JDeveloper
6 35 (2.62%) Maven
7 33 (2.47%) Postman
8 31 (2.32%) Bitbucket
9 29 (2.17%) JUnit
9 29 (2.17%) Team Foundation Server
10 25 (1.87%) Selenium
11 22 (1.65%) NUnit
12 16 (1.20%) Cucumber
12 16 (1.20%) webpack
13 15 (1.12%) SonarQube
13 15 (1.12%) SpecFlow
14 13 (0.97%) MSTest
15 12 (0.90%) Mercurial
16 11 (0.82%) IntelliJ
16 11 (0.82%) SQL Server Management Studio (SSMS)
General
1 205 (15.33%) Finance
2 195 (14.58%) Social Skills
3 159 (11.89%) Police
4 79 (5.91%) Analytical Skills
5 67 (5.01%) Inclusion and Diversity
6 60 (4.49%) Banking
7 46 (3.44%) Retail
8 39 (2.92%) Games
9 37 (2.77%) Presentation Skills
10 36 (2.69%) Public Sector
11 33 (2.47%) Aerospace
12 23 (1.72%) Automotive
13 22 (1.65%) Influencing Skills
14 20 (1.50%) Marketing
15 18 (1.35%) Front Office
15 18 (1.35%) Law
16 14 (1.05%) Investment Banking
17 9 (0.67%) Legal
18 7 (0.52%) Manufacturing
18 7 (0.52%) Telecoms
Job Titles
1 476 (35.60%) Developer
2 447 (33.43%) Software Engineer
3 362 (27.08%) Senior
4 219 (16.38%) Architect
5 185 (13.84%) Java Engineer
6 182 (13.61%) Java Software Engineer
7 144 (10.77%) Solutions Architect
8 124 (9.27%) Senior Software Engineer
9 117 (8.75%) Lead
10 116 (8.68%) .NET Developer
11 113 (8.45%) Senior Developer
12 107 (8.00%) Software Developer
13 103 (7.70%) Java Developer
14 87 (6.51%) Ruby Engineer
15 76 (5.68%) C# Developer
16 75 (5.61%) Senior Architect
17 74 (5.53%) Senior Solutions Architect
18 73 (5.46%) DV Cleared Software Engineer
19 56 (4.19%) Full Stack Developer
20 52 (3.89%) Lead Developer
Libraries, Frameworks & Software Standards
1 433 (32.39%) React
2 330 (24.68%) .NET
3 204 (15.26%) Spring
4 181 (13.54%) HTML
5 164 (12.27%) Node.js
6 152 (11.37%) CSS
7 150 (11.22%) Ruby on Rails
8 149 (11.14%) J2EE
9 125 (9.35%) REST
10 123 (9.20%) .NET Core
11 114 (8.53%) AngularJS
12 108 (8.08%) RESTful
13 104 (7.78%) .NET Framework
14 93 (6.96%) ASP.NET
15 73 (5.46%) Web Services
16 62 (4.64%) ASP.NET Web API
17 61 (4.56%) Kafka
18 51 (3.81%) Entity Framework
19 49 (3.66%) jQuery
20 47 (3.52%) ASP.NET MVC
Miscellaneous
1 153 (11.44%) Cloud Native
2 120 (8.98%) Data Structures
3 73 (5.46%) Hybrid Cloud
4 59 (4.41%) Product Ownership
5 53 (3.96%) Algorithms
6 42 (3.14%) Mobile App
7 39 (2.92%) Distributed Systems
8 34 (2.54%) Public Cloud
9 31 (2.32%) Virtual Reality
10 27 (2.02%) Management Information System
11 24 (1.80%) Cyberattack
12 22 (1.65%) Greenfield Project
13 19 (1.42%) Virtual Team
14 18 (1.35%) Enterprise Software
14 18 (1.35%) Self-Motivation
15 14 (1.05%) Linux Command Line
16 12 (0.90%) Client/Server
17 10 (0.75%) Legacy Systems
18 7 (0.52%) Distributed Architecture
18 7 (0.52%) Video\Live Streaming
Operating Systems
1 145 (10.85%) Linux
2 29 (2.17%) Windows
3 23 (1.72%) Unix
4 20 (1.50%) Android
5 8 (0.60%) Apple iOS
6 4 (0.30%) QNX Neutrino
6 4 (0.30%) Windows Server
7 2 (0.15%) Windows 10
8 1 (0.075%) Debian
Processes & Methodologies
1 620 (46.37%) Agile
2 602 (45.03%) Software Engineering
3 572 (42.78%) Microservices
4 470 (35.15%) Problem-Solving
5 452 (33.81%) Actionable Insight
6 381 (28.50%) DevOps
7 349 (26.10%) Continuous Integration
7 349 (26.10%) Unit Testing
8 323 (24.16%) Containerisation
9 314 (23.49%) Clean Code
10 313 (23.41%) CI/CD
11 287 (21.47%) Mentoring
12 275 (20.57%) Code Quality
13 245 (18.32%) Scrum
14 212 (15.86%) Coaching
15 206 (15.41%) TDD
16 200 (14.96%) SDLC
17 191 (14.29%) OO
18 129 (9.65%) SOLID
18 129 (9.65%) Test Automation
Programming Languages
1 598 (44.73%) Java
2 533 (39.87%) C#
3 503 (37.62%) Python
4 365 (27.30%) JavaScript
5 251 (18.77%) Ruby
6 237 (17.73%) SQL
7 122 (9.12%) Bash
8 107 (8.00%) Go
9 91 (6.81%) Perl
10 80 (5.98%) TypeScript
11 62 (4.64%) T-SQL
12 34 (2.54%) C++
13 28 (2.09%) PowerShell
14 22 (1.65%) PHP
15 21 (1.57%) Groovy
16 17 (1.27%) C
17 16 (1.20%) Bicep
18 13 (0.97%) Scala
19 11 (0.82%) VB.NET
20 8 (0.60%) Shell Script
Qualifications
1 399 (29.84%) Security Cleared
2 287 (21.47%) SC Cleared
3 134 (10.02%) Degree
4 106 (7.93%) DV Cleared
5 72 (5.39%) TOGAF Certification
6 58 (4.34%) Computer Science Degree
7 37 (2.77%) BPSS Clearance
8 25 (1.87%) Master's Degree
9 14 (1.05%) Microsoft Certification
10 12 (0.90%) Azure Certification
11 10 (0.75%) AWS Certification
12 6 (0.45%) MCPD
13 3 (0.22%) AWS Certified Developer
13 3 (0.22%) PhD
14 2 (0.15%) MCP
14 2 (0.15%) OCP
14 2 (0.15%) Oracle Certification
15 1 (0.075%) AWS Certified Solutions Architect
Quality Assurance & Compliance
1 169 (12.64%) QA
2 29 (2.17%) ISO/IEC 15288
3 17 (1.27%) Accessibility
4 11 (0.82%) PCI DSS
5 10 (0.75%) ISO/IEC 27001
5 10 (0.75%) WCAG
6 6 (0.45%) ISO 9000
7 5 (0.37%) Data Quality
8 3 (0.22%) GDPR
8 3 (0.22%) NCSC
8 3 (0.22%) SLA
9 2 (0.15%) PMO
9 2 (0.15%) SNOMED CT
10 1 (0.075%) NIST
System Software
1 171 (12.79%) Docker
2 14 (1.05%) Active Directory
3 4 (0.30%) HDFS
4 3 (0.22%) IAG
5 1 (0.075%) Apache Flume
5 1 (0.075%) Hyper-V
5 1 (0.075%) RACF
5 1 (0.075%) VMware Infrastructure
Systems Management
1 104 (7.78%) Kubernetes
2 58 (4.34%) Terraform
3 32 (2.39%) Ansible
4 25 (1.87%) Puppet
5 21 (1.57%) Grafana
6 18 (1.35%) Prometheus
7 16 (1.20%) Progress Chef
8 6 (0.45%) Active Directory Federation Services
8 6 (0.45%) Kibana
9 4 (0.30%) Istio
10 3 (0.22%) MIIS
11 1 (0.075%) FlexNet
11 1 (0.075%) FortiGate
11 1 (0.075%) Fortio
11 1 (0.075%) Hadoop YARN
11 1 (0.075%) Kiali
11 1 (0.075%) Microsoft Intune
11 1 (0.075%) Oozie
11 1 (0.075%) Rancher
11 1 (0.075%) Single Sign-On
Vendors
1 191 (14.29%) Microsoft
2 142 (10.62%) Oracle
3 37 (2.77%) Google
4 17 (1.27%) Xamarin
5 15 (1.12%) New Relic
6 13 (0.97%) SaltStack
7 11 (0.82%) Okta
8 9 (0.67%) ServiceNow
9 7 (0.52%) IBM
9 7 (0.52%) Salesforce
9 7 (0.52%) Splunk
10 6 (0.45%) Dynatrace
10 6 (0.45%) Teradata
11 5 (0.37%) Atlassian
11 5 (0.37%) Confluent
11 5 (0.37%) MuleSoft
11 5 (0.37%) SAP
11 5 (0.37%) UiPath
12 4 (0.30%) Sitecore
12 4 (0.30%) TIBCO