Azure Monitor Jobs

Azure Monitor (Azure Log Analytics, Azure Application Insights, Azure Diagnostics)
UK

The table below provides summary statistics for permanent job vacancies requiring Azure Monitor skills. It includes a benchmarking guide to the annual salaries offered in vacancies that cited Azure Monitor over the 6 months leading up to 7 July 2025, comparing them to the same period in the previous two years.

6 months to
7 Jul 2025
Same period 2024 Same period 2023
Rank 551 688 660
Rank change year-on-year +137 -28 +123
Permanent jobs citing Azure Monitor 177 221 263
As % of all permanent jobs advertised in the UK 0.30% 0.21% 0.30%
As % of the Cloud Services category 1.08% 0.62% 0.70%
Number of salaries quoted 133 143 208
10th Percentile £53,750 £39,750 £45,000
25th Percentile £62,500 £54,125 £52,375
Median annual salary (50th Percentile) £70,000 £66,000 £62,750
Median % change year-on-year +6.06% +5.18% +4.58%
75th Percentile £83,750 £81,250 £81,250
90th Percentile £96,000 £97,500 £92,875
UK excluding London median annual salary £67,500 £59,000 £60,000
% change year-on-year +14.41% -1.67% +9.09%

All Cloud Skills
UK

Azure Monitor falls under the Cloud Services category. For comparison with the information above, the following table provides summary statistics for all permanent job vacancies requiring cloud computing skills.

Permanent vacancies with a requirement for cloud computing skills 16,342 35,500 37,517
As % of all permanent jobs advertised in the UK 27.35% 33.41% 42.32%
Number of salaries quoted 10,966 26,464 26,837
10th Percentile £30,625 £30,500 £33,750
25th Percentile £41,250 £41,250 £46,250
Median annual salary (50th Percentile) £60,000 £57,500 £62,500
Median % change year-on-year +4.35% -8.00% -
75th Percentile £81,250 £77,500 £83,750
90th Percentile £102,500 £96,250 £102,500
UK excluding London median annual salary £52,500 £51,250 £55,000
% change year-on-year +2.44% -6.82% +4.76%

Azure Monitor
Job Vacancy Trend

Job postings citing Azure Monitor as a proportion of all IT jobs advertised.
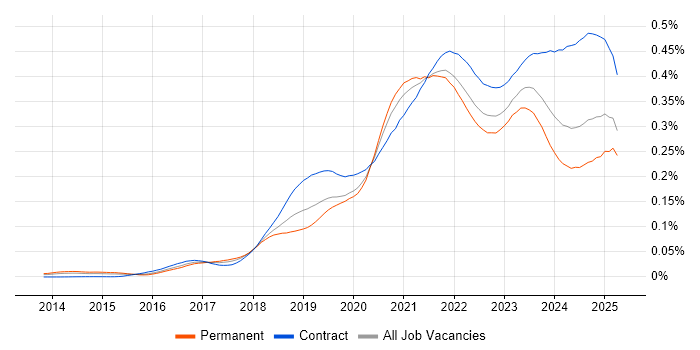
Job vacancy trend for Azure Monitor in the UK

Azure Monitor
Salary Trend

3-month moving average salary quoted in jobs citing Azure Monitor.

Salary trend for Azure Monitor in the UK

Azure Monitor
Salary Histogram

Salary distribution for jobs citing Azure Monitor over the 6 months to 7 July 2025.

Salary histogram for Azure Monitor in the UK

Azure Monitor
Top 16 Job Locations

The table below looks at the demand and provides a guide to the median salaries quoted in IT jobs citing Azure Monitor within the UK over the 6 months to 7 July 2025. The 'Rank Change' column provides an indication of the change in demand within each location based on the same 6 month period last year.

Location Rank Change
on Same Period
Last Year
Matching
Permanent
IT Job Ads
Median Salary
Past 6 Months
Median Salary
% Change
on Same Period
Last Year
Live
Jobs
England +134 164 £70,000 +3.70% 97
London +119 94 £70,000 -3.45% 46
UK excluding London +123 74 £67,500 +14.41% 64
Work from Home +93 68 £67,500 +5.88% 56
South East +52 32 £70,000 +18.64% 16
North of England +47 16 £65,000 -18.68% 13
North West +7 13 £65,000 -13.29% 10
Scotland +87 7 £90,000 +100.00% 7
South West +105 6 £66,000 - 11
Midlands +78 6 £72,500 +74.70% 6
East of England +38 6 £65,000 -10.34% 11
West Midlands +68 4 £72,500 - 2
East Midlands +40 2 - - 4
Yorkshire +29 2 - - 3
North East +42 1 - -
Northern Ireland +38 1 £43,092 -54.64% 1

Azure Monitor
Co-occurring Skills and Capabilities by Category

The follow tables expand on the table above by listing co-occurrences grouped by category. The same employment type, locality and period is covered with up to 20 co-occurrences shown in each of the following categories:

Application Platforms
1 7 (3.95%) nginx
2 4 (2.26%) IIS
3 3 (1.69%) Microsoft Exchange
4 2 (1.13%) SharePoint
5 1 (0.56%) Confluence
5 1 (0.56%) Skype for Business
Business Applications
1 2 (1.13%) Dynamics CRM
2 1 (0.56%) Oracle Applications
2 1 (0.56%) Oracle EBS
Cloud Services
1 177 (100.00%) Azure
2 95 (53.67%) Azure DevOps
3 58 (32.77%) AWS
4 45 (25.42%) Entra ID
5 36 (20.34%) SaaS
6 35 (19.77%) GCP
7 29 (16.38%) PaaS
8 27 (15.25%) IaaS
8 27 (15.25%) Power Platform
9 25 (14.12%) Azure Key Vault
10 22 (12.43%) Azure ExpressRoute
10 22 (12.43%) Azure Service Bus
11 21 (11.86%) Azure AKS
11 21 (11.86%) Azure Data Factory
11 21 (11.86%) GitHub
11 21 (11.86%) Serverless
12 18 (10.17%) Azure Functions
12 18 (10.17%) GitHub Actions
13 17 (9.60%) Power Automate
14 16 (9.04%) Azure AI
Communications & Networking
1 42 (23.73%) Firewall
2 29 (16.38%) VPN
3 24 (13.56%) DNS
4 21 (11.86%) SD-WAN
4 21 (11.86%) WAN
5 8 (4.52%) SAN
6 7 (3.95%) Network Security
7 6 (3.39%) NAS
8 5 (2.82%) Kerberos
9 4 (2.26%) Wireshark
10 3 (1.69%) SNMP
11 1 (0.56%) LAN
11 1 (0.56%) Skype
11 1 (0.56%) Unified Communications
Database & Business Intelligence
1 25 (14.12%) SQL Server
2 19 (10.73%) Power BI
3 18 (10.17%) Data Lake
4 17 (9.60%) MySQL
5 13 (7.34%) Relational Database
6 10 (5.65%) Azure SQL Database
7 8 (4.52%) SQL Server Integration Services
8 7 (3.95%) DB2
8 7 (3.95%) Elasticsearch
9 5 (2.82%) MongoDB
9 5 (2.82%) NoSQL
9 5 (2.82%) PostgreSQL
10 2 (1.13%) SQL Server Reporting Services
11 1 (0.56%) Enterprise Data Warehouse
11 1 (0.56%) GIS
11 1 (0.56%) Oracle Database
11 1 (0.56%) Oracle Exadata
11 1 (0.56%) Oracle Reports
11 1 (0.56%) Power Query
Development Applications
1 28 (15.82%) Git
2 26 (14.69%) Jenkins
3 12 (6.78%) Visual Studio
4 10 (5.65%) GitLab
4 10 (5.65%) Octopus Deploy
5 6 (3.39%) TeamCity
6 5 (2.82%) JIRA
6 5 (2.82%) Postman
7 4 (2.26%) Fiddler
8 1 (0.56%) Gatling
8 1 (0.56%) git-flow
8 1 (0.56%) JMeter
8 1 (0.56%) Locust
8 1 (0.56%) Maven
8 1 (0.56%) MSBuild
8 1 (0.56%) NUnit
8 1 (0.56%) Selenium
8 1 (0.56%) Team Foundation Server
General
1 62 (35.03%) Social Skills
2 46 (25.99%) Finance
3 18 (10.17%) Law
4 16 (9.04%) Legal
5 6 (3.39%) Inclusion and Diversity
5 6 (3.39%) Marketing
6 5 (2.82%) Banking
7 4 (2.26%) Analytical Skills
7 4 (2.26%) Public Sector
8 3 (1.69%) Investment Banking
8 3 (1.69%) Telecoms
9 2 (1.13%) Electronics
9 2 (1.13%) Games
9 2 (1.13%) Manufacturing
9 2 (1.13%) Retail
10 1 (0.56%) Automotive
10 1 (0.56%) Documentation Skills
10 1 (0.56%) Front Office
Job Titles
1 34 (19.21%) DevOps Engineer
2 32 (18.08%) Senior
3 31 (17.51%) Azure Engineer
4 26 (14.69%) Analyst
5 25 (14.12%) Cloud Engineer
6 19 (10.73%) Architect
7 18 (10.17%) Cloud Architect
8 13 (7.34%) Senior Manager
8 13 (7.34%) Site Reliability Engineer
8 13 (7.34%) Support Engineer
9 11 (6.21%) Azure DevOps Engineer
9 11 (6.21%) Data Analyst
9 11 (6.21%) Infrastructure Engineer
9 11 (6.21%) Site Engineer
10 10 (5.65%) Monitoring Analyst
11 9 (5.08%) 3rd Line Engineer
11 9 (5.08%) 3rd Line Support
11 9 (5.08%) 3rd Line Support Engineer
12 8 (4.52%) Applications Support
12 8 (4.52%) Infrastructure Analyst
Libraries, Frameworks & Software Standards
1 30 (16.95%) .NET
2 24 (13.56%) ARM Templates
3 13 (7.34%) Hugging Face
3 13 (7.34%) LangChain
3 13 (7.34%) PyTorch
3 13 (7.34%) TensorFlow
4 12 (6.78%) .NET Framework
5 11 (6.21%) ASP.NET
6 10 (5.65%) React
7 9 (5.08%) REST
8 6 (3.39%) CSS
8 6 (3.39%) Entity Framework
8 6 (3.39%) HTML
8 6 (3.39%) OAuth
8 6 (3.39%) OpenID
9 5 (2.82%) JSON
9 5 (2.82%) LDAP
9 5 (2.82%) RESTful
9 5 (2.82%) SAML
9 5 (2.82%) Web Services
Miscellaneous
1 19 (10.73%) Cloud Native
2 17 (9.60%) NHS
3 16 (9.04%) Data Centre
4 13 (7.34%) Hybrid Cloud
5 12 (6.78%) Distributed Systems
6 9 (5.08%) Distributed Architecture
7 7 (3.95%) PKI
8 5 (2.82%) Onboarding
8 5 (2.82%) Self-Motivation
9 4 (2.26%) Linux Command Line
10 3 (1.69%) Hedge funds
10 3 (1.69%) Product Ownership
10 3 (1.69%) Replication
11 2 (1.13%) Clustering
12 1 (0.56%) Data Protection Act
12 1 (0.56%) Driving Licence
12 1 (0.56%) Educational Technology
12 1 (0.56%) Foreign Exchange (FX)
12 1 (0.56%) Legacy Systems
12 1 (0.56%) Life Science
Operating Systems
1 41 (23.16%) Windows
2 25 (14.12%) Windows Server
3 17 (9.60%) Linux
4 10 (5.65%) Red Hat Enterprise Linux
5 6 (3.39%) VMS
6 4 (2.26%) Ubuntu
7 2 (1.13%) Windows Server 2019
8 1 (0.56%) Unix
Processes & Methodologies
1 129 (72.88%) DevOps
2 112 (63.28%) CI/CD
3 76 (42.94%) Infrastructure as Code
4 68 (38.42%) ITIL
5 66 (37.29%) Analytics
5 66 (37.29%) Log Analytics
6 60 (33.90%) Agile
7 49 (27.68%) Service Management
8 43 (24.29%) Change Management
9 39 (22.03%) Observability
10 38 (21.47%) Continuous Improvement
11 37 (20.90%) Problem-Solving
12 36 (20.34%) Artificial Intelligence
12 36 (20.34%) High Availability
13 35 (19.77%) Containerisation
14 34 (19.21%) Microservices
15 33 (18.64%) Computer Science
15 33 (18.64%) Problem Management
16 32 (18.08%) B2B
16 32 (18.08%) Incident Management
Programming Languages
1 92 (51.98%) PowerShell
2 79 (44.63%) SQL
3 49 (27.68%) Python
4 37 (20.90%) C#
5 32 (18.08%) Bicep
6 21 (11.86%) Bash
7 20 (11.30%) Kusto Query Language
8 13 (7.34%) Java
9 10 (5.65%) TypeScript
10 9 (5.08%) T-SQL
11 8 (4.52%) PL/SQL
12 7 (3.95%) JavaScript
12 7 (3.95%) VB.NET
13 1 (0.56%) Data Analysis Expressions
13 1 (0.56%) Go
13 1 (0.56%) PHP
13 1 (0.56%) Ruby
Qualifications
1 64 (36.16%) Azure Certification
2 37 (20.90%) Degree
3 26 (14.69%) Computer Science Degree
4 23 (12.99%) Security Cleared
5 22 (12.43%) Master's Degree
6 19 (10.73%) Microsoft Certification
7 16 (9.04%) DBS Check
8 5 (2.82%) CISM
8 5 (2.82%) CISSP
8 5 (2.82%) SC Cleared
9 2 (1.13%) BPSS Clearance
10 1 (0.56%) ISTQB
10 1 (0.56%) ISTQB Foundation Certification
10 1 (0.56%) ITIL Certification
10 1 (0.56%) ITIL Foundation Certificate
Quality Assurance & Compliance
1 15 (8.47%) GDPR
2 12 (6.78%) HIPAA
2 12 (6.78%) SOC 2
3 10 (5.65%) QA
4 7 (3.95%) ISO/IEC 27001
5 5 (2.82%) SLA
6 4 (2.26%) PCI DSS
6 4 (2.26%) Sarbanes-Oxley
7 3 (1.69%) Cyber Essentials
7 3 (1.69%) Cyber Essentials PLUS
8 2 (1.13%) NIST
9 1 (0.56%) Accessibility
9 1 (0.56%) Actionable Recommendations
9 1 (0.56%) Data Quality
System Software
1 49 (27.68%) Docker
2 39 (22.03%) Virtual Machines
3 20 (11.30%) Active Directory
4 9 (5.08%) VMware Infrastructure
5 8 (4.52%) Hyper-V
6 4 (2.26%) vSphere
7 3 (1.69%) VMware ESXi
8 2 (1.13%) Virtual Desktop
Systems Management
1 73 (41.24%) Terraform
2 51 (28.81%) Prometheus
3 48 (27.12%) Kubernetes
4 42 (23.73%) Grafana
5 21 (11.86%) Single Sign-On
6 12 (6.78%) Ansible
7 7 (3.95%) Microsoft Intune
8 6 (3.39%) Progress Chef
9 5 (2.82%) QRadar
10 3 (1.69%) HAProxy
10 3 (1.69%) Istio
10 3 (1.69%) linkerd
11 2 (1.13%) Failover Clustering
12 1 (0.56%) Oracle RMAN
12 1 (0.56%) Puppet
12 1 (0.56%) SCOM
Vendors
1 74 (41.81%) Microsoft
2 23 (12.99%) Splunk
3 22 (12.43%) Databricks
4 21 (11.86%) SolarWinds
5 20 (11.30%) Google
6 16 (9.04%) Meraki
7 13 (7.34%) OpenAI
8 9 (5.08%) VMware
9 7 (3.95%) Red Hat
9 7 (3.95%) ServiceNow
10 4 (2.26%) Palo Alto
11 3 (1.69%) Atlassian
11 3 (1.69%) Cisco
11 3 (1.69%) F5
11 3 (1.69%) NetApp
12 2 (1.13%) Dell
12 2 (1.13%) EMC
12 2 (1.13%) Nimble Storage
12 2 (1.13%) SAP
12 2 (1.13%) SonicWALL