Senior Consultant Jobs with Work from Home Options

Senior Consultant
UK > Work from Home

The median Senior Consultant salary in Work from Home is £70,500 per year according to job vacancies posted during the 6 months to 11 May 2024.

The first table below provides salary benchmarking and summary statistics including a comparison to same period in the previous 2 years.

6 months to
11 May 2024
Same period 2023 Same period 2022
Rank 359 435 495
Rank change year-on-year +76 +60 -200
Permanent jobs requiring a Senior Consultant 246 245 392
As % of all permanent jobs with a WFH option 0.73% 0.60% 0.57%
As % of the Job Titles category 0.76% 0.62% 0.59%
Number of salaries quoted 158 217 312
10th Percentile £50,875 £51,250 £53,750
25th Percentile £56,250 £62,500 £57,500
Median annual salary (50th Percentile) £70,500 £75,000 £72,500
Median % change year-on-year -6.00% +3.45% +7.41%
75th Percentile £85,000 £87,500 £82,500
90th Percentile £95,000 £100,000 £90,000
UK median annual salary £70,000 £72,500 £70,000
% change year-on-year -3.45% +3.57% +3.70%

All Permanent IT Job Vacancies
Work from Home

The following table is for comparison with the above and includes summary statistics for all permanent IT job vacancies with a WFH option. Most job vacancies include a discernible job title that can be normalized. As such, the figures in the second row provide an indication of the number of permanent jobs in our overall sample.

Permanent vacancies in Work from Home with a recognized job title 32,437 39,504 66,963
% of permanent jobs with a recognized job title 95.97% 95.98% 97.38%
Number of salaries quoted 24,910 28,114 41,797
10th Percentile £33,116 £36,750 £36,152
25th Percentile £42,500 £47,250 £45,000
Median annual salary (50th Percentile) £56,000 £62,500 £60,000
Median % change year-on-year -10.40% +4.17% +9.09%
75th Percentile £75,000 £81,250 £80,000
90th Percentile £93,750 £100,000 £95,000
UK median annual salary £52,500 £60,000 £60,000
% change year-on-year -12.50% - +9.09%

Senior Consultant
Trend for Jobs with a WFH Option

Job vacancies with a work from home option which featured Senior Consultant in the job title as a proportion of all IT jobs advertised.
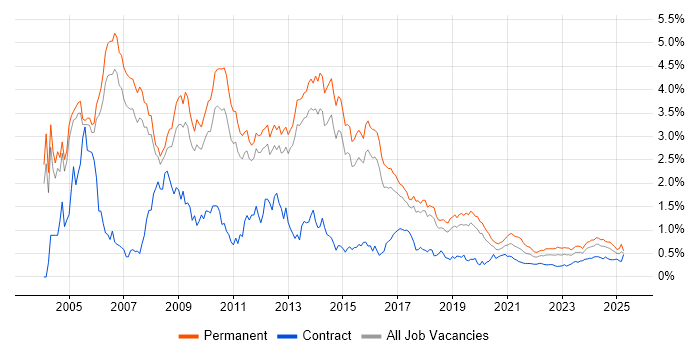
Senior Consultant trend for jobs with a WFH option

Senior Consultant
Salary Trend for Jobs with a WFH Option

3-month moving average salary quoted in job vacancies with a work from home option citing Senior Consultant.

Senior Consultant salary trend for jobs with a WFH option

Senior Consultant
Salary Histogram for Jobs with a WFH Option

Salary distribution for jobs with a work from home option citing Senior Consultant over the 6 months to 11 May 2024.

Senior Consultant salary histogram for jobs with a WFH option

Senior Consultant Skill Set
Top 30 Co-occurring Skills and Capabilities in Job Vacancies with WFH Options

For the 6 months to 11 May 2024, Senior Consultant job roles required the following skills and capabilities in order of popularity. The figures indicate the absolute number co-occurrences and as a proportion of all permanent jobs with remote work options featuring Senior Consultant in the job title.

1 78 (31.71%) Finance
2 55 (22.36%) Azure
3 53 (21.54%) Presales
3 53 (21.54%) Roadmaps
4 49 (19.92%) Presentation Skills
5 47 (19.11%) Social Skills
6 45 (18.29%) Azure Certification
6 45 (18.29%) Microsoft
7 43 (17.48%) Project Management
8 41 (16.67%) AWS
9 40 (16.26%) SAP
10 39 (15.85%) Strategic Roadmap
11 38 (15.45%) Actionable Insight
11 38 (15.45%) Artificial Intelligence
12 36 (14.63%) Security Cleared
12 36 (14.63%) Data Warehouse
12 36 (14.63%) Data Lake
13 35 (14.23%) Azure SQL Data Warehouse
13 35 (14.23%) AWS Certification
13 35 (14.23%) Workflow
13 35 (14.23%) Data Architecture
14 30 (12.20%) JavaScript
14 30 (12.20%) ServiceNow
15 29 (11.79%) Project Delivery
16 25 (10.16%) Requirements Gathering
17 24 (9.76%) Public Sector
18 23 (9.35%) HTML
19 22 (8.94%) Degree
19 22 (8.94%) Analytical Skills
20 21 (8.54%) Mentoring

Senior Consultant Skill Set
Co-occurring Skills and Capabilities with WFH Options by Category

The follow tables expand on the table above by listing co-occurrences grouped by category. The same employment type, locality and period is covered with up to 20 co-occurrences shown in each of the following categories:

Application Platforms
1 18 (7.32%) IIS
2 10 (4.07%) Microsoft Exchange
3 2 (0.81%) Apache
3 2 (0.81%) Apache Spark
4 1 (0.41%) SharePoint
Applications
1 9 (3.66%) Microsoft Office
2 6 (2.44%) Microsoft Excel
2 6 (2.44%) Microsoft PowerPoint
3 4 (1.63%) Microsoft Project
3 4 (1.63%) MS Visio
4 3 (1.22%) Spreadsheet
5 1 (0.41%) Windchill
Business Applications
1 21 (8.54%) SAP S/4HANA
2 9 (3.66%) SAP HR
3 6 (2.44%) Remedy ITSM
3 6 (2.44%) SAP SD
4 5 (2.03%) SAP FI
5 4 (1.63%) SAP Travel Management
6 3 (1.22%) Dynamics CRM
6 3 (1.22%) Endur
6 3 (1.22%) OpenLink RightAngle
6 3 (1.22%) SAP CO
6 3 (1.22%) SAP CRM
6 3 (1.22%) SAP CX
6 3 (1.22%) SAP FI/CO
6 3 (1.22%) SAP GRC
6 3 (1.22%) SAP GTS
6 3 (1.22%) SAP MM
6 3 (1.22%) SAP PP
6 3 (1.22%) SAP WM
7 2 (0.81%) SAP SCM
8 1 (0.41%) Dynamics NAV
Cloud Services
1 55 (22.36%) Azure
2 41 (16.67%) AWS
3 11 (4.47%) Azure Stack
3 11 (4.47%) SaaS
4 10 (4.07%) Azure DevOps
4 10 (4.07%) IaaS
4 10 (4.07%) PaaS
4 10 (4.07%) SuccessFactors
5 9 (3.66%) Boomi
6 8 (3.25%) Power Platform
7 6 (2.44%) Dynamics 365
8 5 (2.03%) AWS IoT
9 4 (1.63%) Azure Synapse Analytics
10 3 (1.22%) Azure Data Factory
10 3 (1.22%) Microsoft 365
11 2 (0.81%) GCP
12 1 (0.41%) Azure Cognitive Services
12 1 (0.41%) Azure Machine Learning
12 1 (0.41%) dbt
12 1 (0.41%) Power Automate
Communications & Networking
1 12 (4.88%) Firewall
2 8 (3.25%) WAN
3 7 (2.85%) BGP
3 7 (2.85%) IGRP
3 7 (2.85%) Internet
3 7 (2.85%) LAN
3 7 (2.85%) MPLS
3 7 (2.85%) Network Security
3 7 (2.85%) VPLS
3 7 (2.85%) VRRP
4 6 (2.44%) SSL
4 6 (2.44%) VPN
5 5 (2.03%) Cisco Firepower
5 5 (2.03%) Cisco ISE
6 4 (1.63%) Cisco Nexus
7 2 (0.81%) SD-WAN
8 1 (0.41%) Cisco ASA
8 1 (0.41%) Wireless
Database & Business Intelligence
1 36 (14.63%) Data Lake
1 36 (14.63%) Data Warehouse
2 35 (14.23%) Azure SQL Data Warehouse
3 17 (6.91%) SQL Server
4 10 (4.07%) Relational Database
5 6 (2.44%) Power BI
6 4 (1.63%) Big Data
6 4 (1.63%) Tableau
7 3 (1.22%) RDBMS
8 1 (0.41%) BigQuery
8 1 (0.41%) Looker
8 1 (0.41%) Power Query
Development Applications
1 2 (0.81%) Git
1 2 (0.81%) Team Foundation Server
1 2 (0.81%) Visual Studio
1 2 (0.81%) Visual Studio Code
General
1 78 (31.71%) Finance
2 49 (19.92%) Presentation Skills
3 47 (19.11%) Social Skills
4 24 (9.76%) Public Sector
5 22 (8.94%) Analytical Skills
6 14 (5.69%) Military
7 11 (4.47%) Aerospace
7 11 (4.47%) Legal
8 10 (4.07%) Aviation
8 10 (4.07%) Documentation Skills
9 9 (3.66%) Law
9 9 (3.66%) Retail
10 7 (2.85%) Inclusion and Diversity
10 7 (2.85%) Marketing
11 6 (2.44%) Local Government
12 5 (2.03%) Manufacturing
13 4 (1.63%) Billing
13 4 (1.63%) Influencing Skills
14 3 (1.22%) Games
15 2 (0.81%) Electronics
Libraries, Frameworks & Software Standards
1 23 (9.35%) HTML
2 17 (6.91%) AngularJS
3 8 (3.25%) Web Services
3 8 (3.25%) XML
4 6 (2.44%) Ajax
4 6 (2.44%) CSS
4 6 (2.44%) LDAP
4 6 (2.44%) SOAP
5 5 (2.03%) .NET
5 5 (2.03%) Node.js
6 4 (1.63%) SAP TM
7 2 (0.81%) .NET Core
7 2 (0.81%) .NET Framework
7 2 (0.81%) ASP.NET
7 2 (0.81%) JSON
7 2 (0.81%) PySpark
7 2 (0.81%) RESTful
7 2 (0.81%) XSD
7 2 (0.81%) XSLT
8 1 (0.41%) OAuth
Miscellaneous
1 14 (5.69%) Management Information System
2 13 (5.28%) CESG
3 11 (4.47%) Onboarding
4 8 (3.25%) Self-Motivation
5 6 (2.44%) CMDB
5 6 (2.44%) IoT
5 6 (2.44%) Virtual Team
6 5 (2.03%) Acoustics
6 5 (2.03%) Driving Licence
6 5 (2.03%) Renewable Energy
7 4 (1.63%) Cyberattack
8 3 (1.22%) Data Centre
8 3 (1.22%) Swaptions
9 2 (0.81%) Analytical Mindset
9 2 (0.81%) Greenfield Project
9 2 (0.81%) Low-Code
9 2 (0.81%) Operational Technology
9 2 (0.81%) PMI
10 1 (0.41%) Enterprise Software
10 1 (0.41%) Social Media
Operating Systems
1 11 (4.47%) Windows
2 7 (2.85%) Windows Server
3 5 (2.03%) Linux
4 1 (0.41%) Android
4 1 (0.41%) Apple iOS
Processes & Methodologies
1 53 (21.54%) Presales
1 53 (21.54%) Roadmaps
2 43 (17.48%) Project Management
3 39 (15.85%) Strategic Roadmap
4 38 (15.45%) Actionable Insight
4 38 (15.45%) Artificial Intelligence
5 35 (14.23%) Data Architecture
5 35 (14.23%) Workflow
6 29 (11.79%) Project Delivery
7 25 (10.16%) Requirements Gathering
8 21 (8.54%) Mentoring
8 21 (8.54%) Problem-Solving
9 20 (8.13%) Information Security
10 18 (7.32%) Cybersecurity
10 18 (7.32%) Requirements Workshops
10 18 (7.32%) Thought Leadership
11 17 (6.91%) Customer Service
11 17 (6.91%) DevOps
12 16 (6.50%) Business Transformation
13 15 (6.10%) Innovative Thinking
Programming Languages
1 30 (12.20%) JavaScript
2 17 (6.91%) SQL
3 16 (6.50%) Python
4 10 (4.07%) Bicep
5 6 (2.44%) C#
6 5 (2.03%) Java
6 5 (2.03%) PowerShell
6 5 (2.03%) R
6 5 (2.03%) TypeScript
7 3 (1.22%) VB
8 2 (0.81%) T-SQL
8 2 (0.81%) XPath
9 1 (0.41%) ABAP
9 1 (0.41%) Data Analysis Expressions
9 1 (0.41%) Lua
9 1 (0.41%) Objective-C
9 1 (0.41%) PHP
9 1 (0.41%) Ruby
9 1 (0.41%) SAPscript
9 1 (0.41%) VBA
Qualifications
1 45 (18.29%) Azure Certification
2 36 (14.63%) Security Cleared
3 35 (14.23%) AWS Certification
4 22 (8.94%) Degree
5 13 (5.28%) CISMP
5 13 (5.28%) SC Cleared
6 11 (4.47%) IISP
7 6 (2.44%) CCNP
7 6 (2.44%) Cisco Certification
8 5 (2.03%) Microsoft Certification
9 4 (1.63%) CEH
9 4 (1.63%) CISSP
9 4 (1.63%) CompTIA Security+
9 4 (1.63%) CREST Certified
9 4 (1.63%) GPEN
10 3 (1.22%) BPSS Clearance
10 3 (1.22%) DV Cleared
11 2 (0.81%) CCIE
11 2 (0.81%) MCP
11 2 (0.81%) PMI Certification
Quality Assurance & Compliance
1 14 (5.69%) NIST
2 13 (5.28%) JSP 440
3 11 (4.47%) HMG Security Policy Framework
3 11 (4.47%) NIST 800
3 11 (4.47%) RMADS
4 9 (3.66%) QA
5 7 (2.85%) Data Quality
6 3 (1.22%) GMP
6 3 (1.22%) GRC
7 2 (0.81%) Accessibility
8 1 (0.41%) Cyber Essentials
System Software
1 7 (2.85%) Active Directory
Systems Management
1 10 (4.07%) Terraform
2 6 (2.44%) HP UCMDB
3 1 (0.41%) Single Sign-On
Vendors
1 45 (18.29%) Microsoft
2 40 (16.26%) SAP
3 30 (12.20%) ServiceNow
4 13 (5.28%) Cisco
5 9 (3.66%) Dell
6 7 (2.85%) Aderant
6 7 (2.85%) HP
6 7 (2.85%) Oracle
7 6 (2.44%) BMC
7 6 (2.44%) Meraki
7 6 (2.44%) Remedy
8 4 (1.63%) Alteryx
8 4 (1.63%) Fortinet
8 4 (1.63%) Salesforce
9 3 (1.22%) Databricks
9 3 (1.22%) OpenLink
9 3 (1.22%) Sybase
9 3 (1.22%) TIBCO
10 2 (0.81%) Sage
11 1 (0.41%) Ariba