Inventory Management Jobs in England

Inventory Management
UK > England

The following table provides summary statistics for permanent job vacancies advertised in England with a requirement for Inventory Management skills. Included is a benchmarking guide to the salaries offered in vacancies that have cited Inventory Management over the 6 months to 2 June 2024 with a comparison to the same period in the previous 2 years.

6 months to
2 Jun 2024
Same period 2023 Same period 2022
Rank 654 742 860
Rank change year-on-year +88 +118 -71
Permanent jobs citing Inventory Management 196 174 316
As % of all permanent jobs advertised in England 0.21% 0.21% 0.22%
As % of the Processes & Methodologies category 0.26% 0.22% 0.23%
Number of salaries quoted 123 83 123
10th Percentile £25,550 £31,500 £27,600
25th Percentile £29,338 £36,250 £35,625
Median annual salary (50th Percentile) £37,500 £50,000 £55,000
Median % change year-on-year -25.00% -9.09% +10.00%
75th Percentile £51,250 £76,250 £65,000
90th Percentile £68,750 £96,250 £80,000
UK median annual salary £37,500 £50,000 £55,000
% change year-on-year -25.00% -9.09% +10.00%

All Process and Methodology Skills
England

Inventory Management is in the Processes and Methodologies category. The following table is for comparison with the above and provides summary statistics for all permanent job vacancies advertised in England with a requirement for process or methodology skills.

Permanent vacancies with a requirement for process or methodology skills 76,200 80,466 135,750
As % of all permanent jobs advertised in England 83.51% 95.48% 95.97%
Number of salaries quoted 55,193 48,975 73,419
10th Percentile £29,022 £34,324 £33,262
25th Percentile £40,000 £46,000 £44,075
Median annual salary (50th Percentile) £55,000 £62,500 £60,000
Median % change year-on-year -12.00% +4.17% +9.09%
75th Percentile £72,500 £82,500 £80,000
90th Percentile £92,500 £102,500 £97,500
UK median annual salary £55,000 £60,899 £60,000
% change year-on-year -9.69% +1.50% +9.09%

Inventory Management
Job Vacancy Trend in England

Job postings citing Inventory Management as a proportion of all IT jobs advertised in England.
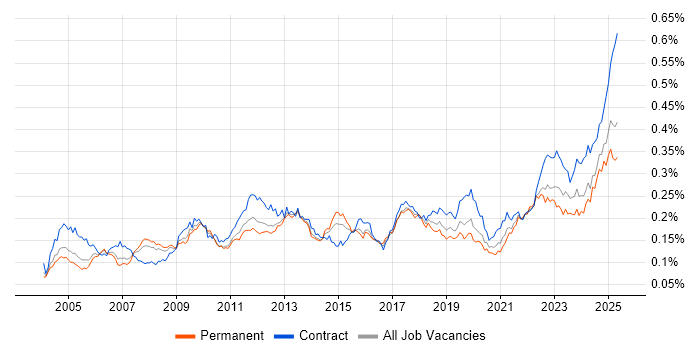
Job vacancy trend for Inventory Management in England

Inventory Management
Salary Trend in England

3-month moving average salary quoted in jobs citing Inventory Management in England.

Salary trend for Inventory Management in England

Inventory Management
Salary Histogram in England

Salary distribution for jobs citing Inventory Management in England over the 6 months to 2 June 2024.

Salary histogram for Inventory Management in England

Inventory Management
Job Locations in England

The table below looks at the demand and provides a guide to the median salaries quoted in IT jobs citing Inventory Management within the England region over the 6 months to 2 June 2024. The 'Rank Change' column provides an indication of the change in demand within each location based on the same 6 month period last year.

Location Rank Change
on Same Period
Last Year
Matching
Permanent
IT Job Ads
Median Salary
Past 6 Months
Median Salary
% Change
on Same Period
Last Year
Live
Jobs
South East +34 60 £37,500 -25.00% 30
Midlands -2 54 £32,500 -55.17% 22
West Midlands -13 36 £32,500 -55.17% 17
London +80 35 £47,000 +25.33% 44
North of England +27 24 £42,500 -17.07% 24
East of England - 18 £37,500 - 17
East Midlands -4 17 £25,500 -64.21% 5
North West -21 12 £50,000 -45.95% 16
Yorkshire +64 8 £40,000 -17.95% 4
South West -35 5 £39,529 -24.71% 10
North East -11 4 £42,500 -15.00% 4
Inventory Management
UK

Inventory Management
Co-occurring Skills and Capabilities in England by Category

The follow tables expand on the table above by listing co-occurrences grouped by category. The same employment type, locality and period is covered with up to 20 co-occurrences shown in each of the following categories:

Application Platforms
1 27 (13.78%) Microsoft Exchange
2 19 (9.69%) Exchange Server 2010
3 17 (8.67%) Skype for Business
4 5 (2.55%) CMS
5 4 (2.04%) SharePoint
6 3 (1.53%) Exchange Server 2013
6 3 (1.53%) SAS
6 3 (1.53%) WordPress
Applications
1 38 (19.39%) Microsoft Office
2 27 (13.78%) Microsoft Excel
3 5 (2.55%) Spreadsheet
4 4 (2.04%) Microsoft PowerPoint
5 3 (1.53%) Final Cut Pro
5 3 (1.53%) Photoshop
5 3 (1.53%) Pro Tools
5 3 (1.53%) SketchUp
5 3 (1.53%) SPSS
6 2 (1.02%) Microsoft Project
6 2 (1.02%) MS Visio
Business Applications
1 11 (5.61%) SAP WM
2 10 (5.10%) SAP S/4HANA
3 6 (3.06%) SAP MM
3 6 (3.06%) SAP SCM
4 5 (2.55%) SAP PP
4 5 (2.55%) SAP SD
4 5 (2.55%) Shopify
5 4 (2.04%) SAP APO
5 4 (2.04%) SAP IBP
6 3 (1.53%) SAP EWM
7 1 (0.51%) Epicor Tropos
7 1 (0.51%) NetSuite
7 1 (0.51%) OpenText VIM for SAP
7 1 (0.51%) Payment Gateway
7 1 (0.51%) Primavera
7 1 (0.51%) Sage 200
7 1 (0.51%) Sage CRM
7 1 (0.51%) SAP ERP
7 1 (0.51%) SAP QM
Cloud Services
1 47 (23.98%) Microsoft 365
2 43 (21.94%) Azure
3 19 (9.69%) Azure Monitor
4 11 (5.61%) Azure DevOps
5 8 (4.08%) AWS
5 8 (4.08%) Serverless
6 7 (3.57%) Azure API Management
6 7 (3.57%) Azure Event Grid
6 7 (3.57%) Azure Functions
6 7 (3.57%) Azure Service Bus
6 7 (3.57%) Entra ID
6 7 (3.57%) Google Workspace
7 3 (1.53%) Cloud Computing
7 3 (1.53%) Dropbox
7 3 (1.53%) OneDrive
7 3 (1.53%) Rubrik
8 2 (1.02%) Dynamics 365
8 2 (1.02%) Power Platform
8 2 (1.02%) SaaS
8 2 (1.02%) WhatsApp
Communications & Networking
1 20 (10.20%) VPN
2 17 (8.67%) Skype
3 11 (5.61%) LAN
4 9 (4.59%) Wireless
5 8 (4.08%) WAN
6 5 (2.55%) Firewall
6 5 (2.55%) Intranet
7 4 (2.04%) DNS
7 4 (2.04%) VoIP
7 4 (2.04%) WebEx
7 4 (2.04%) WLAN
8 3 (1.53%) Fibre Channel
8 3 (1.53%) Internet
8 3 (1.53%) iSCSI
8 3 (1.53%) SAN
9 2 (1.02%) Remote Desktop
9 2 (1.02%) RFID
10 1 (0.51%) Cisco IOS
10 1 (0.51%) TCP/IP
Database & Business Intelligence
1 14 (7.14%) SQL Server
2 11 (5.61%) SQLite
3 3 (1.53%) Big Data
3 3 (1.53%) EDRMS
3 3 (1.53%) Relational Database
4 2 (1.02%) Power BI
5 1 (0.51%) Amazon Redshift
5 1 (0.51%) MS Access
5 1 (0.51%) Oracle OWB
5 1 (0.51%) Tableau
Development Applications
1 15 (7.65%) Git
2 2 (1.02%) Cypress.io
2 2 (1.02%) SpecFlow
General
1 86 (43.88%) Social Skills
2 45 (22.96%) Analytical Skills
3 42 (21.43%) Finance
3 42 (21.43%) Manufacturing
4 25 (12.76%) Retail
5 24 (12.24%) Law
6 12 (6.12%) Legal
6 12 (6.12%) Marketing
7 9 (4.59%) Inclusion and Diversity
8 8 (4.08%) Organisational Skills
9 6 (3.06%) Documentation Skills
10 4 (2.04%) Aerospace
10 4 (2.04%) Telecoms
11 3 (1.53%) Advertising
11 3 (1.53%) Electronics
11 3 (1.53%) Presentation Skills
12 2 (1.02%) French Language
12 2 (1.02%) Games
12 2 (1.02%) Public Sector
12 2 (1.02%) Spanish Language
Job Titles
1 39 (19.90%) IT Support
2 19 (9.69%) Analyst
3 18 (9.18%) Senior
4 16 (8.16%) IT Support Specialist
4 16 (8.16%) Support Specialist
5 11 (5.61%) IT Technician
6 10 (5.10%) Support Analyst
6 10 (5.10%) Support Engineer
7 9 (4.59%) Consultant
7 9 (4.59%) Lead
8 7 (3.57%) IT Analyst
8 7 (3.57%) IT Manager
8 7 (3.57%) Junior
8 7 (3.57%) SAP Consultant
8 7 (3.57%) Senior Software Engineer
8 7 (3.57%) Software Engineer
9 6 (3.06%) Architect
9 6 (3.06%) IT Support Analyst
9 6 (3.06%) IT Support Engineer
9 6 (3.06%) Project Manager
Libraries, Frameworks & Software Standards
1 15 (7.65%) HTML
2 11 (5.61%) .NET
2 11 (5.61%) .NET Core
2 11 (5.61%) .NET Framework
2 11 (5.61%) ASP.NET
2 11 (5.61%) ASP.NET MVC
2 11 (5.61%) Entity Framework
2 11 (5.61%) RESTful
2 11 (5.61%) Universal Windows Platform
2 11 (5.61%) YAML
3 9 (4.59%) WPF
4 7 (3.57%) Blazor
4 7 (3.57%) SignalR
4 7 (3.57%) WinForms
5 4 (2.04%) CSS
6 2 (1.02%) SAPUI5
7 1 (0.51%) EDI
7 1 (0.51%) RESTEasy
7 1 (0.51%) SAML
Miscellaneous
1 30 (15.31%) Self-Motivation
2 22 (11.22%) Management Information System
2 22 (11.22%) Onboarding
3 21 (10.71%) Video Conferencing
4 5 (2.55%) Driving Licence
4 5 (2.55%) Renewable Energy
5 4 (2.04%) Analytical Mindset
5 4 (2.04%) FMCG
5 4 (2.04%) Social Media
6 3 (1.53%) Acoustics
6 3 (1.53%) Cybercrime
6 3 (1.53%) Data Centre
6 3 (1.53%) EPoS
6 3 (1.53%) Product Ownership
6 3 (1.53%) Video Editing
6 3 (1.53%) Video\Live Streaming
7 2 (1.02%) IoT
7 2 (1.02%) Photography
7 2 (1.02%) Taxonomies
7 2 (1.02%) Virtual Team
Operating Systems
1 52 (26.53%) Windows
2 30 (15.31%) Windows 10
3 22 (11.22%) Android
3 22 (11.22%) Apple iOS
4 7 (3.57%) Mac OS
4 7 (3.57%) Windows Server
5 6 (3.06%) Linux
6 5 (2.55%) Red Hat Enterprise Linux
7 3 (1.53%) Unix
7 3 (1.53%) Windows Server 2012
8 2 (1.02%) Mac OS X
8 2 (1.02%) Windows 7
9 1 (0.51%) VMS
Processes & Methodologies
1 38 (19.39%) Problem-Solving
2 36 (18.37%) Analytics
2 36 (18.37%) Continuous Improvement
3 32 (16.33%) Logistics
4 31 (15.82%) Time Management
5 29 (14.80%) Customer Service
6 25 (12.76%) Supply Chain Management
7 24 (12.24%) Agile
8 23 (11.73%) Stakeholder Management
9 22 (11.22%) ERP
10 20 (10.20%) Inventory Control
10 20 (10.20%) Process Improvement
11 19 (9.69%) Identity Management
11 19 (9.69%) Log Analytics
11 19 (9.69%) Project Management
12 18 (9.18%) Decision-Making
13 17 (8.67%) Business Intelligence
14 15 (7.65%) Asset Management
14 15 (7.65%) Data Analysis
15 14 (7.14%) DevOps
Programming Languages
1 24 (12.24%) SQL
2 14 (7.14%) C#
3 11 (5.61%) T-SQL
3 11 (5.61%) XAML
4 5 (2.55%) Python
5 4 (2.04%) R
6 3 (1.53%) JavaScript
6 3 (1.53%) PHP
6 3 (1.53%) PowerShell
7 2 (1.02%) PL/SQL
7 2 (1.02%) Shell Script
8 1 (0.51%) Go
8 1 (0.51%) Java
8 1 (0.51%) Ruby
Qualifications
1 49 (25.00%) Degree
2 28 (14.29%) Security Cleared
3 22 (11.22%) SC Cleared
4 18 (9.18%) BPSS Clearance
5 9 (4.59%) CCNA
5 9 (4.59%) Cisco Certification
6 6 (3.06%) SAP Certification
7 5 (2.55%) A+ Certification
7 5 (2.55%) Master's Degree
7 5 (2.55%) Network+ Certification
8 4 (2.04%) CCNP
8 4 (2.04%) Computer Science Degree
8 4 (2.04%) DV Cleared
9 2 (1.02%) DBS Check
10 1 (0.51%) APMP
10 1 (0.51%) BC Cleared
10 1 (0.51%) ITIL Certification
10 1 (0.51%) NVQ Level 3
Quality Assurance & Compliance
1 13 (6.63%) QA
2 7 (3.57%) GDPR
3 6 (3.06%) Sarbanes-Oxley
4 4 (2.04%) ISO/IEC 27001
4 4 (2.04%) NEBOSH
5 3 (1.53%) Accessibility
6 2 (1.02%) SLA
7 1 (0.51%) Cyber Essentials
7 1 (0.51%) Cyber Essentials PLUS
7 1 (0.51%) Data Quality
7 1 (0.51%) HIPAA
7 1 (0.51%) PMO
System Software
1 21 (10.71%) Active Directory
2 7 (3.57%) Docker
3 3 (1.53%) VMware Infrastructure
3 3 (1.53%) vSphere
4 1 (0.51%) Hyper-V
4 1 (0.51%) Virtual Machines
Systems Management
1 24 (12.24%) Microsoft Intune
2 3 (1.53%) Jamf Pro
3 1 (0.51%) Single Sign-On
Vendors
1 87 (44.39%) Microsoft
2 49 (25.00%) SAP
3 11 (5.61%) Cisco
4 10 (5.10%) Google
5 7 (3.57%) Apple
5 7 (3.57%) DevExpress
6 5 (2.55%) Facebook
6 5 (2.55%) Red Hat
6 5 (2.55%) Sage
7 3 (1.53%) 3PAR
7 3 (1.53%) Mitel
7 3 (1.53%) Oracle
7 3 (1.53%) ShoreTel
7 3 (1.53%) VMware
7 3 (1.53%) WooCommerce
8 2 (1.02%) RedPrairie
8 2 (1.02%) ServiceNow
9 1 (0.51%) Darktrace
9 1 (0.51%) Meraki
9 1 (0.51%) Workday