Change Control Jobs in England

Change Control
UK > England

The table below provides summary statistics for permanent job vacancies advertised in England requiring Change Control skills. It includes a benchmarking guide to the annual salaries offered in vacancies that cited Change Control over the 6 months leading up to 16 July 2025, comparing them to the same period in the previous two years.

6 months to
16 Jul 2025
Same period 2024 Same period 2023
Rank 471 392 389
Rank change year-on-year -79 -3 +14
Permanent jobs citing Change Control 235 561 613
As % of all permanent jobs advertised in England 0.45% 0.62% 0.81%
As % of the Processes & Methodologies category 0.50% 0.76% 0.85%
Number of salaries quoted 169 384 441
10th Percentile £35,854 £33,750 £35,000
25th Percentile £45,000 £39,813 £41,659
Median annual salary (50th Percentile) £55,000 £50,000 £55,000
Median % change year-on-year +10.00% -9.09% +3.77%
75th Percentile £65,000 £58,750 £70,000
90th Percentile £80,000 £77,500 £82,500
UK median annual salary £54,793 £50,000 £55,000
% change year-on-year +9.59% -9.09% +1.66%

All Process and Methodology Skills
England

Change Control falls under the Processes and Methodologies category. For comparison with the information above, the following table provides summary statistics for all permanent job vacancies requiring process or methodology skills in England.

Permanent vacancies with a requirement for process or methodology skills 47,315 74,118 71,884
As % of all permanent jobs advertised in England 90.14% 82.56% 95.42%
Number of salaries quoted 25,083 51,935 47,067
10th Percentile £28,500 £29,750 £33,750
25th Percentile £39,500 £40,000 £45,250
Median annual salary (50th Percentile) £55,000 £55,000 £62,500
Median % change year-on-year - -12.00% +4.17%
75th Percentile £75,000 £73,750 £81,750
90th Percentile £97,500 £93,750 £102,500
UK median annual salary £55,000 £55,000 £60,249
% change year-on-year - -8.71% +0.42%

Change Control
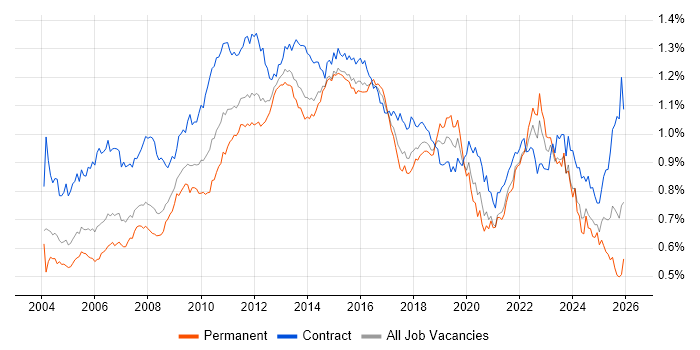
Job Vacancy Trend in England

Job postings citing Change Control as a proportion of all IT jobs advertised in England.

Job vacancy trend for Change Control in England

Change Control
Salary Trend in England

3-month moving average salary quoted in jobs citing Change Control in England.

Salary trend for Change Control in England

Change Control
Salary Histogram in England

Salary distribution for jobs citing Change Control in England over the 6 months to 16 July 2025.

Salary histogram for Change Control in England

Change Control
Job Locations in England

The table below looks at the demand and provides a guide to the median salaries quoted in IT jobs citing Change Control within the England region over the 6 months to 16 July 2025. The 'Rank Change' column provides an indication of the change in demand within each location based on the same 6 month period last year.

Location Rank Change
on Same Period
Last Year
Matching
Permanent
IT Job Ads
Median Salary
Past 6 Months
Median Salary
% Change
on Same Period
Last Year
Live
Jobs
London +65 75 £69,000 +6.15% 96
North of England -14 47 £56,147 +18.20% 60
South East -35 47 £42,500 - 100
North West -9 31 £65,000 +36.84% 34
Midlands -4 29 £55,000 +14.58% 49
West Midlands +40 23 £55,000 +21.77% 29
East of England +20 15 £55,000 +11.73% 36
South West +91 14 £53,750 +10.26% 27
Yorkshire +37 8 £50,000 +4.71% 15
North East +4 8 £35,000 -24.32% 12
East Midlands -5 6 £46,210 -4.72% 20
Change Control
UK

Change Control
Co-occurring Skills and Capabilities in England by Category

The follow tables expand on the table above by listing co-occurrences grouped by category. The same employment type, locality and period is covered with up to 20 co-occurrences shown in each of the following categories:

Application Platforms
1 24 (10.21%) SharePoint
2 15 (6.38%) Microsoft Exchange
3 6 (2.55%) Confluence
4 5 (2.13%) CMS
5 4 (1.70%) BizTalk Server
5 4 (1.70%) IIS
6 3 (1.28%) Apache
7 1 (0.43%) OpenStack
7 1 (0.43%) WordPress
Applications
1 31 (13.19%) Microsoft Office
2 22 (9.36%) Microsoft Excel
3 17 (7.23%) Microsoft PowerPoint
4 13 (5.53%) MS Visio
5 6 (2.55%) Microsoft Project
6 1 (0.43%) Spreadsheet
6 1 (0.43%) Windchill
Business Applications
1 5 (2.13%) Dynamics CRM
2 3 (1.28%) SAP S/4HANA
3 2 (0.85%) SimCorp Dimension
4 1 (0.43%) NetSuite
4 1 (0.43%) SAP MM
4 1 (0.43%) SAP PLM
Cloud Services
1 40 (17.02%) Azure
2 18 (7.66%) Microsoft 365
3 15 (6.38%) AWS
3 15 (6.38%) Power Platform
4 12 (5.11%) Dynamics 365
5 9 (3.83%) IaaS
5 9 (3.83%) PaaS
6 8 (3.40%) SaaS
7 7 (2.98%) Azure DevOps
7 7 (2.98%) Cloud Computing
8 6 (2.55%) Entra ID
9 4 (1.70%) Azure Service Bus
9 4 (1.70%) GitHub
10 3 (1.28%) Amazon S3
10 3 (1.28%) Azure Logic Apps
10 3 (1.28%) Serverless
11 2 (0.85%) AWS Step Functions
11 2 (0.85%) Azure Monitor
11 2 (0.85%) Power Automate
11 2 (0.85%) PowerApps
Communications & Networking
1 29 (12.34%) Firewall
2 15 (6.38%) LAN
3 13 (5.53%) SAN
3 13 (5.53%) WAN
4 12 (5.11%) Network Security
5 9 (3.83%) DHCP
5 9 (3.83%) DNS
6 7 (2.98%) Ethernet VPN
6 7 (2.98%) Intrusion Detection
6 7 (2.98%) NAS
6 7 (2.98%) TCP/IP
6 7 (2.98%) VLAN
7 6 (2.55%) Internet
7 6 (2.55%) VPN
8 4 (1.70%) 3GPP
8 4 (1.70%) SSL
8 4 (1.70%) VoIP
9 3 (1.28%) SD-WAN
9 3 (1.28%) Softphone
9 3 (1.28%) Wi-Fi
Database & Business Intelligence
1 12 (5.11%) SQL Server
2 11 (4.68%) Power BI
3 5 (2.13%) Oracle Reports
3 5 (2.13%) Relational Database
4 4 (1.70%) SQL Server Integration Services
5 3 (1.28%) Big Data
5 3 (1.28%) Crystal Reports
5 3 (1.28%) SAP HANA
5 3 (1.28%) SQL Server Reporting Services
6 2 (0.85%) Amazon Athena
6 2 (0.85%) Amazon Aurora
6 2 (0.85%) Amazon RDS
6 2 (0.85%) Amazon Redshift
6 2 (0.85%) Data Warehouse
6 2 (0.85%) EDMS
6 2 (0.85%) Flink
7 1 (0.43%) BusinessObjects
7 1 (0.43%) Metadata
7 1 (0.43%) Parquet
7 1 (0.43%) SSDT
Development Applications
1 18 (7.66%) JIRA
2 4 (1.70%) Git
3 3 (1.28%) Jenkins
4 2 (0.85%) GitLab
5 1 (0.43%) Ant
5 1 (0.43%) Bitbucket
5 1 (0.43%) Cucumber
5 1 (0.43%) JUnit
5 1 (0.43%) SonarQube
5 1 (0.43%) TeamCity
5 1 (0.43%) Visual Studio
General
1 82 (34.89%) Finance
2 71 (30.21%) Social Skills
3 22 (9.36%) Telecoms
4 19 (8.09%) Analytical Skills
5 18 (7.66%) Banking
5 18 (7.66%) Manufacturing
6 13 (5.53%) Documentation Skills
6 13 (5.53%) Retail
7 8 (3.40%) Organisational Skills
8 7 (2.98%) Law
8 7 (2.98%) Legal
9 5 (2.13%) Aerospace
9 5 (2.13%) Financial Institution
9 5 (2.13%) Police
10 4 (1.70%) Automotive
10 4 (1.70%) Back Office
10 4 (1.70%) Electronics
10 4 (1.70%) Military
10 4 (1.70%) Pharmaceutical
10 4 (1.70%) Public Sector
Job Titles
1 43 (18.30%) Project Manager
2 36 (15.32%) Analyst
3 26 (11.06%) Senior
4 22 (9.36%) Lead
5 18 (7.66%) Network Engineer
5 18 (7.66%) Support Engineer
6 17 (7.23%) Infrastructure Engineer
7 16 (6.81%) Delivery Project Manager
7 16 (6.81%) IT Engineer
8 12 (5.11%) Developer
8 12 (5.11%) IT Infrastructure Engineer
8 12 (5.11%) IT Support
8 12 (5.11%) IT Support Engineer
9 10 (4.26%) Infrastructure Support
9 10 (4.26%) Infrastructure Support Engineer
10 9 (3.83%) Administrator
10 9 (3.83%) Senior Manager
10 9 (3.83%) Support Analyst
10 9 (3.83%) Systems Support
10 9 (3.83%) Systems Support Analyst
Libraries, Frameworks & Software Standards
1 11 (4.68%) .NET
2 6 (2.55%) Oracle Fusion
3 5 (2.13%) RESTful
4 4 (1.70%) .NET Framework
4 4 (1.70%) AngularJS
4 4 (1.70%) ASP.NET
4 4 (1.70%) LDAP
5 3 (1.28%) EDI
5 3 (1.28%) REST
5 3 (1.28%) SOAP
5 3 (1.28%) Spring
5 3 (1.28%) Spring Boot
5 3 (1.28%) XML
6 2 (0.85%) boto
6 2 (0.85%) FastAPI
6 2 (0.85%) GraphQL
6 2 (0.85%) JSON
6 2 (0.85%) Kafka
6 2 (0.85%) OpenAPI
6 2 (0.85%) Swagger
Miscellaneous
1 21 (8.94%) Management Information System
2 19 (8.09%) Data Centre
3 12 (5.11%) Clustering
4 8 (3.40%) Wiki
5 7 (2.98%) Driving Licence
5 7 (2.98%) Life Science
5 7 (2.98%) Private Cloud
5 7 (2.98%) Virtual Team
6 5 (2.13%) Hedge funds
6 5 (2.13%) OTC Derivatives
7 4 (1.70%) Analogue Electronics
7 4 (1.70%) CCTV
7 4 (1.70%) Legacy Systems
7 4 (1.70%) Security Posture
8 3 (1.28%) Housing Association
8 3 (1.28%) Hybrid Cloud
8 3 (1.28%) Onboarding
8 3 (1.28%) Product Ownership
8 3 (1.28%) Renewable Energy
8 3 (1.28%) Self-Motivation
Operating Systems
1 51 (21.70%) Windows
2 23 (9.79%) Linux
3 19 (8.09%) Windows Server
4 6 (2.55%) Windows Server 2019
5 4 (1.70%) Android
5 4 (1.70%) Windows 10
6 3 (1.28%) Mac OS
7 2 (0.85%) Apple iOS
7 2 (0.85%) Red Hat Enterprise Linux
8 1 (0.43%) Unix
8 1 (0.43%) Windows Server 2016
Processes & Methodologies
1 67 (28.51%) Project Management
2 53 (22.55%) Problem-Solving
3 50 (21.28%) Project Delivery
4 42 (17.87%) Stakeholder Management
5 41 (17.45%) Agile
5 41 (17.45%) Continuous Improvement
6 36 (15.32%) Change Management
7 31 (13.19%) Risk Management
8 30 (12.77%) ITIL
9 26 (11.06%) Cybersecurity
10 24 (10.21%) DevOps
11 23 (9.79%) Customer Service
11 23 (9.79%) Service Delivery
12 19 (8.09%) Validation
13 18 (7.66%) Infrastructure Engineering
14 17 (7.23%) ERP
14 17 (7.23%) Kalman Filter
14 17 (7.23%) Problem Management
15 16 (6.81%) CRM
15 16 (6.81%) Project Governance
Programming Languages
1 31 (13.19%) PowerShell
2 24 (10.21%) Python
3 20 (8.51%) SQL
4 18 (7.66%) Bash
5 16 (6.81%) C#
6 5 (2.13%) JavaScript
7 3 (1.28%) Java
7 3 (1.28%) Progress 4GL
8 1 (0.43%) Apex Code
8 1 (0.43%) C++
8 1 (0.43%) SAPscript
8 1 (0.43%) VB
Qualifications
1 36 (15.32%) Degree
2 27 (11.49%) BPSS Clearance
3 24 (10.21%) Security Cleared
4 16 (6.81%) APMP
4 16 (6.81%) Cisco Certification
5 13 (5.53%) SC Cleared
6 12 (5.11%) CCNP
7 10 (4.26%) Microsoft Certification
8 9 (3.83%) DV Cleared
9 8 (3.40%) HND
10 6 (2.55%) ITIL Foundation Certificate
11 5 (2.13%) Check Point Certification
11 5 (2.13%) MCSA
12 4 (1.70%) CCIE
12 4 (1.70%) CCNA
13 3 (1.28%) CISSP
13 3 (1.28%) Computer Science Degree
13 3 (1.28%) PMI Certification
14 2 (0.85%) CISM
14 2 (0.85%) Master's Degree
Quality Assurance & Compliance
1 20 (8.51%) PMO
2 19 (8.09%) QA
3 14 (5.96%) Data Quality
4 12 (5.11%) SLA
5 11 (4.68%) ISO/IEC 27001
6 8 (3.40%) COBIT
7 5 (2.13%) ISO 9001
7 5 (2.13%) MiFID
8 4 (1.70%) NCSC
8 4 (1.70%) PCI DSS
9 3 (1.28%) Accessibility
9 3 (1.28%) GDPR
9 3 (1.28%) GMP
9 3 (1.28%) GxP
10 2 (0.85%) Sarbanes-Oxley
11 1 (0.43%) AICPA
11 1 (0.43%) GRC
11 1 (0.43%) SOC 2
11 1 (0.43%) Software Quality Assurance
System Software
1 39 (16.60%) Active Directory
2 19 (8.09%) VMware Infrastructure
3 7 (2.98%) Firmware
4 5 (2.13%) Hyper-V
5 3 (1.28%) Virtual Machines
6 2 (0.85%) Virtual Desktop
6 2 (0.85%) vSphere
7 1 (0.43%) Docker
7 1 (0.43%) NFS
7 1 (0.43%) vCloud
7 1 (0.43%) Virtual Servers
7 1 (0.43%) VMware ESXi
Systems Management
1 3 (1.28%) Ansible
1 3 (1.28%) Failover Clustering
1 3 (1.28%) Single Sign-On
1 3 (1.28%) Terraform
2 2 (0.85%) FortiGate
2 2 (0.85%) vCenter Server
3 1 (0.43%) Kubernetes
3 1 (0.43%) Microsoft Clustering
3 1 (0.43%) PowerCLI
3 1 (0.43%) Progress Chef
3 1 (0.43%) SCCM
3 1 (0.43%) SCOM
3 1 (0.43%) vRealize
3 1 (0.43%) WSUS
Vendors
1 80 (34.04%) Microsoft
2 24 (10.21%) Cisco
3 22 (9.36%) VMware
4 18 (7.66%) Oracle
5 15 (6.38%) SAP
6 10 (4.26%) F5
7 9 (3.83%) CheckPoint
7 9 (3.83%) Fortinet
8 8 (3.40%) Atlassian
8 8 (3.40%) Salesforce
9 6 (2.55%) Dell
10 5 (2.13%) GoldenSource
10 5 (2.13%) IFS
10 5 (2.13%) Juniper
11 4 (1.70%) HP
11 4 (1.70%) Meraki
12 3 (1.28%) Capita
12 3 (1.28%) iManage
12 3 (1.28%) Intapp
12 3 (1.28%) Okta