Project Management Jobs in London

Project Management
England > London

The table below provides summary statistics for permanent job vacancies advertised in London requiring Project Management skills. It includes a benchmarking guide to the annual salaries offered in vacancies that cited Project Management over the 6 months leading up to 30 May 2025, comparing them to the same period in the previous two years.

6 months to
30 May 2025
Same period 2024 Same period 2023
Rank 32 25 41
Rank change year-on-year -7 +16 +12
Permanent jobs citing Project Management 966 1,776 2,037
As % of all permanent jobs advertised in London 7.61% 7.41% 6.21%
As % of the Processes & Methodologies category 7.91% 8.20% 6.52%
Number of salaries quoted 476 1,238 1,466
10th Percentile £46,750 £36,250 £42,500
25th Percentile £60,000 £48,063 £52,500
Median annual salary (50th Percentile) £70,000 £65,000 £67,500
Median % change year-on-year +7.69% -3.70% +3.85%
75th Percentile £93,750 £83,750 £85,000
90th Percentile £112,500 £102,575 £97,500
England median annual salary £57,500 £52,500 £59,250
% change year-on-year +9.52% -11.39% +3.95%

All Process and Methodology Skills
London

Project Management falls under the Processes and Methodologies category. For comparison with the information above, the following table provides summary statistics for all permanent job vacancies requiring process or methodology skills in London.

Permanent vacancies with a requirement for process or methodology skills 12,216 21,652 31,243
As % of all permanent jobs advertised in London 96.26% 90.32% 95.32%
Number of salaries quoted 6,929 15,871 22,511
10th Percentile £41,700 £37,500 £42,789
25th Percentile £55,500 £51,250 £55,000
Median annual salary (50th Percentile) £75,000 £70,000 £75,000
Median % change year-on-year +7.14% -6.67% +7.14%
75th Percentile £100,000 £95,000 £95,000
90th Percentile £122,500 £115,000 £115,055
England median annual salary £57,500 £55,000 £62,500
% change year-on-year +4.55% -12.00% +4.17%

Project Management
Job Vacancy Trend in London

Job postings citing Project Management as a proportion of all IT jobs advertised in London.
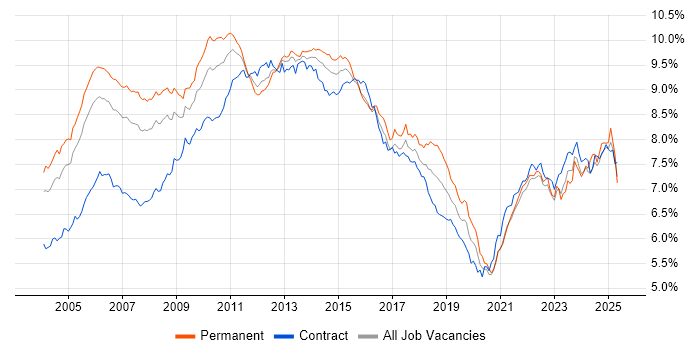
Job vacancy trend for Project Management in London

Project Management
Salary Trend in London

3-month moving average salary quoted in jobs citing Project Management in London.

Salary trend for Project Management in London

Project Management
Salary Histogram in London

Salary distribution for jobs citing Project Management in London over the 6 months to 30 May 2025.

Salary histogram for Project Management in London

Project Management
Job Locations in London

The table below looks at the demand and provides a guide to the median salaries quoted in IT jobs citing Project Management within the London region over the 6 months to 30 May 2025. The 'Rank Change' column provides an indication of the change in demand within each location based on the same 6 month period last year.

Location Rank Change
on Same Period
Last Year
Matching
Permanent
IT Job Ads
Median Salary
Past 6 Months
Median Salary
% Change
on Same Period
Last Year
Live
Jobs
Central London +2 200 £75,000 +11.11% 85
South London -20 26 £60,750 +21.50% 18
West London +14 25 £88,750 +50.30% 221
East London -29 11 £95,000 +46.15% 18
North London -21 6 £65,000 -7.14% 5
Project Management
England

Project Management
Co-occurring Skills and Capabilities in London by Category

The follow tables expand on the table above by listing co-occurrences grouped by category. The same employment type, locality and period is covered with up to 20 co-occurrences shown in each of the following categories:

Application Platforms
1 33 (3.42%) SharePoint
2 24 (2.48%) Confluence
3 18 (1.86%) Microsoft Exchange
4 9 (0.93%) Apache Spark
5 6 (0.62%) Moodle
6 5 (0.52%) CMS
6 5 (0.52%) Kinematics
7 2 (0.21%) IIS
7 2 (0.21%) Oracle SOA Suite
7 2 (0.21%) WordPress
8 1 (0.10%) Apache
8 1 (0.10%) Apache Airflow
8 1 (0.10%) Drupal
8 1 (0.10%) Oracle Workflow
8 1 (0.10%) SAS
8 1 (0.10%) Skype for Business
8 1 (0.10%) Solana
Applications
1 76 (7.87%) Microsoft Excel
2 50 (5.18%) Microsoft Office
3 37 (3.83%) Microsoft PowerPoint
4 35 (3.62%) Microsoft Project
5 25 (2.59%) MS Visio
6 24 (2.48%) Maya
7 15 (1.55%) Trello
8 8 (0.83%) Adobe Creative Suite
9 6 (0.62%) Spreadsheet
9 6 (0.62%) Stata
10 5 (0.52%) Chatbot
10 5 (0.52%) SOLIDWORKS
11 4 (0.41%) Notion
12 3 (0.31%) Adobe Illustrator
12 3 (0.31%) Adobe Premiere
12 3 (0.31%) Adobe XD
12 3 (0.31%) InDesign
12 3 (0.31%) Photoshop
13 1 (0.10%) AutoCAD
13 1 (0.10%) Sketch
Business Applications
1 21 (2.17%) SAP S/4HANA
2 20 (2.07%) NetSuite
3 10 (1.04%) Dynamics CRM
3 10 (1.04%) SAP IBP
4 7 (0.72%) Aladdin
4 7 (0.72%) Elite 3E
5 5 (0.52%) Oracle ERP
5 5 (0.52%) Relativity
6 4 (0.41%) CA PPM
6 4 (0.41%) Orchestrade
6 4 (0.41%) Payment Gateway
6 4 (0.41%) Salesforce CRM
6 4 (0.41%) SAP CO
6 4 (0.41%) SAP FI
6 4 (0.41%) SAP FI/CO
7 3 (0.31%) Adaptiv
7 3 (0.31%) Oracle Payables
7 3 (0.31%) Oracle Receivables
7 3 (0.31%) SAP FSCM
7 3 (0.31%) SAP IS-U
Cloud Services
1 120 (12.42%) Azure
2 69 (7.14%) Power Platform
3 53 (5.49%) AWS
4 48 (4.97%) Microsoft 365
5 32 (3.31%) Azure DevOps
6 29 (3.00%) SaaS
7 28 (2.90%) GCP
8 23 (2.38%) Dynamics 365
9 20 (2.07%) Entra ID
10 17 (1.76%) Cloud Computing
10 17 (1.76%) Google Workspace
11 16 (1.66%) Google Analytics
12 12 (1.24%) Figma
13 11 (1.14%) IaaS
13 11 (1.14%) Slack
13 11 (1.14%) Smartsheet
14 10 (1.04%) PaaS
14 10 (1.04%) Snowflake
15 9 (0.93%) Google Sheets
15 9 (0.93%) Power Automate
Communications & Networking
1 19 (1.97%) Firewall
2 13 (1.35%) WAN
2 13 (1.35%) Wireless
3 11 (1.14%) DNS
4 9 (0.93%) DHCP
5 7 (0.72%) VLAN
6 6 (0.62%) LAN
6 6 (0.62%) SSL
6 6 (0.62%) TCP/IP
6 6 (0.62%) VPN
7 5 (0.52%) Kerberos
7 5 (0.52%) Network Security
8 4 (0.41%) SD-WAN
8 4 (0.41%) WebEx
8 4 (0.41%) Wi-Fi
9 2 (0.21%) Ethernet VPN
9 2 (0.21%) Intranet
9 2 (0.21%) IPsec
9 2 (0.21%) MPLS
9 2 (0.21%) OSPF
Database & Business Intelligence
1 57 (5.90%) Power BI
2 28 (2.90%) Data Warehouse
3 27 (2.80%) Tableau
4 24 (2.48%) Big Data
5 19 (1.97%) SQL Server
6 15 (1.55%) Data Lake
7 14 (1.45%) SAP BW
8 9 (0.93%) GIS
9 7 (0.72%) Data Mining
10 6 (0.62%) Hadoop
11 5 (0.52%) Metadata
11 5 (0.52%) NoSQL
12 4 (0.41%) Amazon Redshift
12 4 (0.41%) EDRMS
12 4 (0.41%) Looker
12 4 (0.41%) Power Query
12 4 (0.41%) PowerPivot
12 4 (0.41%) Relational Database
12 4 (0.41%) SQL Server Integration Services
13 3 (0.31%) DynamoDB
Development Applications
1 79 (8.18%) JIRA
2 9 (0.93%) Git
3 3 (0.31%) GitLab
3 3 (0.31%) Jenkins
4 2 (0.21%) Cypress.io
4 2 (0.21%) JMeter
5 1 (0.10%) Bugzilla
5 1 (0.10%) Burp Suite
5 1 (0.10%) CircleCI
5 1 (0.10%) ESLint
5 1 (0.10%) Gatling
5 1 (0.10%) JUnit
5 1 (0.10%) Postman
5 1 (0.10%) Selenium
5 1 (0.10%) Subversion
5 1 (0.10%) TestRail
5 1 (0.10%) Vagrant
5 1 (0.10%) Visual Studio
General
1 500 (51.76%) Social Skills
2 380 (39.34%) Finance
3 309 (31.99%) Analytical Skills
4 169 (17.49%) Marketing
5 119 (12.32%) Law
6 113 (11.70%) Inclusion and Diversity
7 89 (9.21%) Retail
8 87 (9.01%) Legal
9 76 (7.87%) Banking
10 60 (6.21%) Advertising
11 54 (5.59%) Organisational Skills
12 50 (5.18%) Presentation Skills
13 47 (4.87%) Public Sector
14 44 (4.55%) Games
15 40 (4.14%) Manufacturing
16 38 (3.93%) Telecoms
17 23 (2.38%) French Language
18 20 (2.07%) Pharmaceutical
19 19 (1.97%) Influencing Skills
19 19 (1.97%) Publishing
Job Titles
1 158 (16.36%) Project Manager
1 158 (16.36%) Senior
2 91 (9.42%) Senior Manager
3 87 (9.01%) Analyst
4 70 (7.25%) IT Manager
5 66 (6.83%) Lead
6 53 (5.49%) Consultant
7 47 (4.87%) Business Analyst
8 38 (3.93%) Account Manager
9 34 (3.52%) Delivery Manager
10 32 (3.31%) Senior Project Manager
11 30 (3.11%) Architect
12 29 (3.00%) Developer
12 29 (3.00%) Operations Manager
13 24 (2.48%) Technical Manager
14 23 (2.38%) Functional Consultant
15 21 (2.17%) Senior Analyst
16 20 (2.07%) NetSuite Consultant
16 20 (2.07%) Senior Account Manager
17 19 (1.97%) Coordinator
Libraries, Frameworks & Software Standards
1 14 (1.45%) .NET
2 13 (1.35%) Middleware
3 12 (1.24%) React
4 10 (1.04%) Node.js
5 9 (0.93%) EDI
6 7 (0.72%) CSS
6 7 (0.72%) HTML
6 7 (0.72%) RESTful
7 6 (0.62%) Kafka
7 6 (0.62%) OAuth
7 6 (0.62%) Web Services
8 5 (0.52%) LDAP
8 5 (0.52%) OpenID
8 5 (0.52%) SailPoint
8 5 (0.52%) SAML
9 4 (0.41%) FIX Protocol
9 4 (0.41%) Plotly
10 3 (0.31%) .NET Framework
10 3 (0.31%) Laravel
10 3 (0.31%) Spring
Miscellaneous
1 59 (6.11%) Management Information System
2 58 (6.00%) Product Ownership
3 37 (3.83%) Digital Media
4 36 (3.73%) Marketing Technology
5 28 (2.90%) PMI
6 27 (2.80%) Enterprise Software
7 26 (2.69%) Analytical Mindset
8 25 (2.59%) Onboarding
9 23 (2.38%) Social Media
10 21 (2.17%) Self-Motivation
11 17 (1.76%) Data Centre
12 16 (1.66%) FMCG
13 15 (1.55%) Cloud Native
14 13 (1.35%) Hybrid Cloud
15 12 (1.24%) e-Learning
16 11 (1.14%) Cyberattack
16 11 (1.14%) Digital Signage
17 10 (1.04%) Blockchain
17 10 (1.04%) Driving Licence
17 10 (1.04%) Security Posture
Operating Systems
1 47 (4.87%) Windows
2 22 (2.28%) Windows Server
3 11 (1.14%) Linux
4 6 (0.62%) Android
4 6 (0.62%) Apple iOS
4 6 (0.62%) Windows Server 2019
5 5 (0.52%) Windows 10
6 4 (0.41%) Windows Server 2016
7 3 (0.31%) Unix
8 2 (0.21%) Mac OS X
8 2 (0.21%) Red Hat Enterprise Linux
8 2 (0.21%) Windows 7
9 1 (0.10%) VMS
9 1 (0.10%) Windows Server 2008
9 1 (0.10%) Windows Server 2012
Processes & Methodologies
1 298 (30.85%) Problem-Solving
2 277 (28.67%) Agile
3 198 (20.50%) Project Delivery
4 170 (17.60%) Analytics
5 157 (16.25%) Risk Management
6 147 (15.22%) Continuous Improvement
7 143 (14.80%) Decision-Making
8 142 (14.70%) Stakeholder Management
9 140 (14.49%) Roadmaps
10 137 (14.18%) Strategic Thinking
11 134 (13.87%) Mentoring
12 131 (13.56%) Artificial Intelligence
13 127 (13.15%) Collaborative Working
14 115 (11.90%) Cybersecurity
15 108 (11.18%) PRINCE2
16 97 (10.04%) ERP
17 92 (9.52%) Business Strategy
18 83 (8.59%) Process Improvement
19 79 (8.18%) Waterfall
20 75 (7.76%) Change Management
Programming Languages
1 89 (9.21%) SQL
2 68 (7.04%) Python
3 31 (3.21%) PowerShell
4 27 (2.80%) Java
5 23 (2.38%) C#
6 20 (2.07%) JavaScript
6 20 (2.07%) R
7 6 (0.62%) C++
7 6 (0.62%) PHP
8 5 (0.52%) VB
9 3 (0.31%) Data Analysis Expressions
9 3 (0.31%) Scala
9 3 (0.31%) T-SQL
9 3 (0.31%) TypeScript
9 3 (0.31%) VBA
10 2 (0.21%) Bash
10 2 (0.21%) Bicep
10 2 (0.21%) MATLAB
10 2 (0.21%) Ruby
11 1 (0.10%) ABAP
Qualifications
1 266 (27.54%) Degree
2 98 (10.14%) PMI Certification
3 80 (8.28%) PMP
4 44 (4.55%) Master's Degree
5 41 (4.24%) CISSP
6 33 (3.42%) Security Cleared
7 32 (3.31%) Computer Science Degree
8 21 (2.17%) Cisco Certification
9 16 (1.66%) CISM
9 16 (1.66%) DBS Check
10 15 (1.55%) Azure Certification
10 15 (1.55%) PhD
11 14 (1.45%) PRINCE2 Practitioner
12 13 (1.35%) (ISC)2 CCSP
12 13 (1.35%) Six Sigma Black Belt
13 12 (1.24%) DV Cleared
13 12 (1.24%) ITIL Certification
13 12 (1.24%) Microsoft Certification
14 11 (1.14%) CCSP
14 11 (1.14%) MBA
Quality Assurance & Compliance
1 113 (11.70%) QA
2 48 (4.97%) GDPR
3 45 (4.66%) PMO
4 39 (4.04%) Accessibility
5 28 (2.90%) Data Quality
6 24 (2.48%) ISO/IEC 27001
7 19 (1.97%) Cyber Essentials
8 18 (1.86%) GxP
9 16 (1.66%) Cyber Essentials PLUS
10 13 (1.35%) NIST
11 11 (1.14%) PMBOK
12 9 (0.93%) HIPAA
13 8 (0.83%) WCAG
14 7 (0.72%) GRC
15 6 (0.62%) MiFID
16 5 (0.52%) P3O
16 5 (0.52%) SLA
17 4 (0.41%) Good Clinical Practice
18 3 (0.31%) COBIT
18 3 (0.31%) EMIR
System Software
1 27 (2.80%) Active Directory
2 6 (0.62%) VMware Infrastructure
3 4 (0.41%) Docker
3 4 (0.41%) vSphere
4 3 (0.31%) Hyper-V
4 3 (0.31%) Virtual Machines
4 3 (0.31%) VMware ESXi
5 2 (0.21%) Virtual Desktop
6 1 (0.10%) Forefront TMG
6 1 (0.10%) HDFS
6 1 (0.10%) ISA Server
6 1 (0.10%) Virtual Servers
Systems Management
1 18 (1.86%) Microsoft Intune
2 17 (1.76%) Terraform
3 14 (1.45%) Single Sign-On
4 6 (0.62%) Ansible
4 6 (0.62%) Jamf Pro
5 5 (0.52%) CSIRT
5 5 (0.52%) Kubernetes
5 5 (0.52%) QRadar
6 3 (0.31%) SCCM
7 2 (0.21%) Active Directory Federation Services
7 2 (0.21%) FortiGate
7 2 (0.21%) NetBackup
7 2 (0.21%) vCenter Server
8 1 (0.10%) Argo
8 1 (0.10%) Consul
8 1 (0.10%) OPNET
8 1 (0.10%) Progress Chef
8 1 (0.10%) RSA Archer
8 1 (0.10%) Salt
8 1 (0.10%) SCVMM
Vendors
1 169 (17.49%) Microsoft
2 73 (7.56%) SAP
3 68 (7.04%) Google
4 34 (3.52%) Adobe
5 27 (2.80%) Cisco
6 24 (2.48%) Salesforce
7 18 (1.86%) Oracle
8 16 (1.66%) TikTok
9 12 (1.24%) Meraki
10 10 (1.04%) VMware
11 9 (0.93%) Ariba
12 8 (0.83%) Databricks
12 8 (0.83%) IBM
12 8 (0.83%) JD Edwards
12 8 (0.83%) Workday
13 7 (0.72%) Facebook
13 7 (0.72%) ServiceNow
13 7 (0.72%) SolarWinds
14 6 (0.62%) Planview
14 6 (0.62%) TOWER Software