Relational Database Jobs in London

Relational Database
England > London

The table below provides summary statistics for permanent job vacancies advertised in London requiring Relational Database skills. It includes a benchmarking guide to the annual salaries offered in vacancies that cited Relational Database over the 6 months leading up to 30 May 2025, comparing them to the same period in the previous two years.

6 months to
30 May 2025
Same period 2024 Same period 2023
Rank 145 190 125
Rank change year-on-year +45 -65 -42
Permanent jobs citing Relational Database 303 411 909
As % of all permanent jobs advertised in London 2.39% 1.71% 2.77%
As % of the Database & Business Intelligence category 11.25% 7.80% 11.10%
Number of salaries quoted 134 250 592
10th Percentile £51,250 £48,625 £50,125
25th Percentile £57,500 £55,313 £60,000
Median annual salary (50th Percentile) £75,000 £70,000 £77,500
Median % change year-on-year +7.14% -9.68% +6.90%
75th Percentile £87,500 £90,000 £97,500
90th Percentile £120,000 £111,250 £111,250
England median annual salary £64,500 £60,000 £65,351
% change year-on-year +7.50% -8.19% +13.65%

All Database and Business Intelligence Skills
London

Relational Database falls under the Databases and Business Intelligence category. For comparison with the information above, the following table provides summary statistics for all permanent job vacancies requiring database or business intelligence skills in London.

Permanent vacancies with a requirement for database or business intelligence skills 2,693 5,268 8,187
As % of all permanent jobs advertised in London 21.22% 21.97% 24.98%
Number of salaries quoted 1,767 3,872 5,677
10th Percentile £48,750 £46,250 £47,500
25th Percentile £60,750 £57,500 £57,500
Median annual salary (50th Percentile) £80,000 £75,000 £75,000
Median % change year-on-year +6.67% - +7.14%
75th Percentile £112,500 £100,000 £97,500
90th Percentile £136,750 £128,750 £117,236
England median annual salary £62,500 £57,500 £65,000
% change year-on-year +8.70% -11.54% +8.33%

Relational Database
Job Vacancy Trend in London

Job postings citing Relational Database as a proportion of all IT jobs advertised in London.
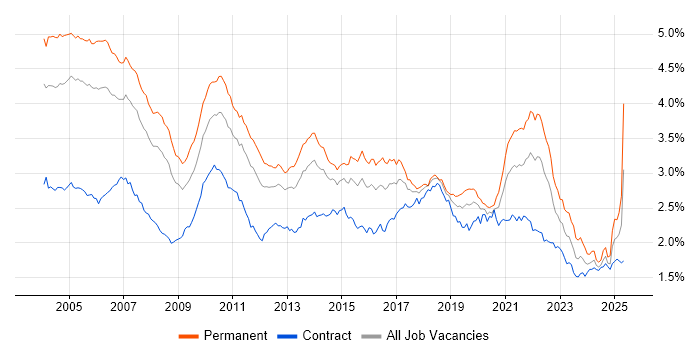
Job vacancy trend for Relational Database in London

Relational Database
Salary Trend in London

3-month moving average salary quoted in jobs citing Relational Database in London.

Salary trend for Relational Database in London

Relational Database
Salary Histogram in London

Salary distribution for jobs citing Relational Database in London over the 6 months to 30 May 2025.

Salary histogram for Relational Database in London

Relational Database
Job Locations in London

The table below looks at the demand and provides a guide to the median salaries quoted in IT jobs citing Relational Database within the London region over the 6 months to 30 May 2025. The 'Rank Change' column provides an indication of the change in demand within each location based on the same 6 month period last year.

Location Rank Change
on Same Period
Last Year
Matching
Permanent
IT Job Ads
Median Salary
Past 6 Months
Median Salary
% Change
on Same Period
Last Year
Live
Jobs
South London +23 52 - - 2
Central London +16 49 £75,000 - 31
West London +33 17 £56,500 -17.82% 46
East London -8 10 - - 2
North London -20 7 - -
Relational Database
England

Relational Database
Co-occurring Skills and Capabilities in London by Category

The follow tables expand on the table above by listing co-occurrences grouped by category. The same employment type, locality and period is covered with up to 20 co-occurrences shown in each of the following categories:

Application Platforms
1 17 (5.61%) Confluence
2 14 (4.62%) JBoss
2 14 (4.62%) Red Hat Fuse
3 10 (3.30%) Apache Airflow
3 10 (3.30%) Apache Spark
4 7 (2.31%) Microsoft Exchange
5 6 (1.98%) OpenStack
6 2 (0.66%) Appian
6 2 (0.66%) OpenEdge
7 1 (0.33%) Apache
7 1 (0.33%) Camunda
7 1 (0.33%) NServiceBus
7 1 (0.33%) SharePoint
7 1 (0.33%) Tomcat
Applications
1 29 (9.57%) Microsoft Excel
2 27 (8.91%) Microsoft Office
3 5 (1.65%) InDesign
4 4 (1.32%) Microsoft PowerPoint
5 1 (0.33%) Spreadsheet
Business Applications
1 4 (1.32%) Endur
1 4 (1.32%) Relativity
1 4 (1.32%) Ringtail
1 4 (1.32%) Veritas eDiscovery
2 3 (0.99%) Orchestrade
3 1 (0.33%) Raiser’s Edge
3 1 (0.33%) Salesforce CRM
Cloud Services
1 150 (49.50%) AWS
2 67 (22.11%) Pulumi
3 48 (15.84%) Azure
4 37 (12.21%) Serverless
5 35 (11.55%) GCP
6 33 (10.89%) Amazon ECS
7 32 (10.56%) Amazon EKS
8 24 (7.92%) Power Platform
9 13 (4.29%) Amazon EC2
10 10 (3.30%) Azure Data Factory
11 9 (2.97%) Amazon S3
12 8 (2.64%) Azure Monitor
12 8 (2.64%) GitHub
13 7 (2.31%) Amazon SQS
13 7 (2.31%) Azure Logic Apps
13 7 (2.31%) Azure Synapse Analytics
13 7 (2.31%) Datadog
13 7 (2.31%) Dynamics 365
14 6 (1.98%) GitHub Actions
15 4 (1.32%) OCI
Communications & Networking
1 67 (22.11%) Broadband
2 3 (0.99%) Telnet
3 1 (0.33%) X.21
Database & Business Intelligence
1 110 (36.30%) RDBMS
2 97 (32.01%) NoSQL
3 78 (25.74%) PostgreSQL
4 43 (14.19%) SQL Server
5 30 (9.90%) MySQL
6 17 (5.61%) Power BI
7 16 (5.28%) Data Warehouse
8 10 (3.30%) BigQuery
8 10 (3.30%) DB2
8 10 (3.30%) Oracle Reports
8 10 (3.30%) SQL Server Integration Services
9 9 (2.97%) MongoDB
10 8 (2.64%) Big Data
11 7 (2.31%) Amazon Redshift
11 7 (2.31%) Hadoop
11 7 (2.31%) Metadata
11 7 (2.31%) Redis
12 6 (1.98%) Tableau
13 4 (1.32%) EDRMS
13 4 (1.32%) SQL Server Reporting Services
Development Applications
1 67 (22.11%) Jaeger
2 43 (14.19%) Git
3 36 (11.88%) Jenkins
4 28 (9.24%) JUnit
5 19 (6.27%) JIRA
6 13 (4.29%) JMeter
7 12 (3.96%) Mockito
8 10 (3.30%) Visual Studio
9 6 (1.98%) Postman
9 6 (1.98%) SpecFlow
10 5 (1.65%) Moq
10 5 (1.65%) Selenium
11 4 (1.32%) Cucumber
11 4 (1.32%) SoapUI
12 3 (0.99%) GitLab
13 2 (0.66%) Bitbucket
13 2 (0.66%) Gradle
13 2 (0.66%) Maven
13 2 (0.66%) Subversion
13 2 (0.66%) WebSpeed
General
1 93 (30.69%) Inclusion and Diversity
2 82 (27.06%) Finance
3 63 (20.79%) Social Skills
4 46 (15.18%) Public Sector
5 44 (14.52%) Analytical Skills
6 33 (10.89%) Banking
7 29 (9.57%) Marketing
8 25 (8.25%) Law
9 11 (3.63%) Investment Banking
10 10 (3.30%) Front Office
10 10 (3.30%) Telecoms
11 9 (2.97%) Electronics
11 9 (2.97%) Manufacturing
12 7 (2.31%) Games
13 6 (1.98%) Organisational Skills
14 5 (1.65%) Pharmaceutical
14 5 (1.65%) Presentation Skills
15 3 (0.99%) French Language
16 2 (0.66%) Advertising
16 2 (0.66%) Retail
Job Titles
1 92 (30.36%) Lead
2 89 (29.37%) Developer
3 67 (22.11%) Team Leader
4 46 (15.18%) Senior
5 37 (12.21%) Analyst
6 34 (11.22%) Java Developer
7 26 (8.58%) Software Engineer
8 23 (7.59%) Support Analyst
9 19 (6.27%) Senior Developer
10 17 (5.61%) Full-Stack Developer
11 16 (5.28%) Python Developer
12 13 (4.29%) Backend Developer
13 12 (3.96%) Applications Support
13 12 (3.96%) Data Engineer
14 11 (3.63%) C# Developer
14 11 (3.63%) Lead Software Engineer
15 10 (3.30%) Banking Analyst
15 10 (3.30%) Junior
15 10 (3.30%) Senior Backend Developer
15 10 (3.30%) Senior Software Engineer
Libraries, Frameworks & Software Standards
1 74 (24.42%) Elastic Stack
2 67 (22.11%) OpenTelemetry
3 61 (20.13%) REST
4 44 (14.52%) Spring
5 41 (13.53%) Web Services
6 40 (13.20%) Spring Boot
7 31 (10.23%) HTML
8 29 (9.57%) .NET
8 29 (9.57%) RESTful
9 26 (8.58%) Apache Camel
10 23 (7.59%) Kafka
10 23 (7.59%) React
11 21 (6.93%) SOAP
12 18 (5.94%) .NET Framework
13 17 (5.61%) CSS
13 17 (5.61%) Hibernate
14 16 (5.28%) AngularJS
14 16 (5.28%) ASP.NET
15 14 (4.62%) FIX Protocol
15 14 (4.62%) jQuery
Miscellaneous
1 37 (12.21%) Distributed Systems
2 15 (4.95%) Management Information System
3 14 (4.62%) Cloud Native
3 14 (4.62%) Data Structures
4 10 (3.30%) Onboarding
4 10 (3.30%) Product Ownership
5 8 (2.64%) Foreign Exchange (FX)
6 7 (2.31%) Algorithms
7 6 (1.98%) FMCG
7 6 (1.98%) Self-Motivation
8 4 (1.32%) Derivative
8 4 (1.32%) Distributed Applications
8 4 (1.32%) Enterprise Software
8 4 (1.32%) Equities
8 4 (1.32%) Private Cloud
8 4 (1.32%) Public Cloud
8 4 (1.32%) Reference Data
8 4 (1.32%) Swaptions
9 3 (0.99%) Mobile Banking
9 3 (0.99%) Sports Betting
Operating Systems
1 99 (32.67%) Linux
2 93 (30.69%) Unix
3 14 (4.62%) Windows
4 3 (0.99%) Rocky
4 3 (0.99%) Ubuntu
5 2 (0.66%) Android
5 2 (0.66%) Apple iOS
5 2 (0.66%) CentOS
5 2 (0.66%) Red Hat Enterprise Linux
6 1 (0.33%) Debian
Processes & Methodologies
1 167 (55.12%) Agile
2 116 (38.28%) DevOps
3 92 (30.36%) Containerisation
4 89 (29.37%) Mentoring
5 84 (27.72%) Continuous Integration
6 80 (26.40%) Roadmaps
7 79 (26.07%) Product Management
8 73 (24.09%) High Availability
9 72 (23.76%) Infrastructure as Code
10 67 (22.11%) Budget Control
10 67 (22.11%) Cost Optimisation
10 67 (22.11%) GitOps
10 67 (22.11%) Performance Optimisation
10 67 (22.11%) Resource Management
10 67 (22.11%) Task Automation
11 66 (21.78%) CI/CD
12 65 (21.45%) Problem-Solving
13 53 (17.49%) Microservices
14 49 (16.17%) Scrum
15 46 (15.18%) Computer Science
Programming Languages
1 169 (55.78%) Python
2 137 (45.21%) Java
3 132 (43.56%) SQL
4 109 (35.97%) JavaScript
5 75 (24.75%) Bash
6 70 (23.10%) Go
7 37 (12.21%) C#
8 24 (7.92%) T-SQL
9 18 (5.94%) TypeScript
10 17 (5.61%) Shell Script
11 10 (3.30%) PL/SQL
12 9 (2.97%) VB.NET
13 8 (2.64%) R
14 6 (1.98%) Apex Code
15 5 (1.65%) C++
15 5 (1.65%) PHP
16 4 (1.32%) VB
17 3 (0.99%) Kotlin
17 3 (0.99%) PowerShell
18 2 (0.66%) OpenEdge ABL
Qualifications
1 67 (22.11%) AWS Certification
2 35 (11.55%) Degree
3 32 (10.56%) Security Cleared
4 31 (10.23%) SC Cleared
5 14 (4.62%) Computer Science Degree
6 11 (3.63%) Master's Degree
7 3 (0.99%) ISTQB
8 2 (0.66%) DV Cleared
8 2 (0.66%) ISTQB Foundation Certification
9 1 (0.33%) Azure Certification
9 1 (0.33%) BPSS Clearance
9 1 (0.33%) DBS Check
9 1 (0.33%) PhD
Quality Assurance & Compliance
1 24 (7.92%) QA
2 14 (4.62%) Data Quality
2 14 (4.62%) SLA
3 7 (2.31%) GDPR
4 5 (1.65%) Accessibility
5 4 (1.32%) CDISC
6 2 (0.66%) ISO/IEC 27001
6 2 (0.66%) NCSC
7 1 (0.33%) HIPAA
System Software
1 132 (43.56%) Docker
Systems Management
1 128 (42.24%) Kubernetes
2 85 (28.05%) Ansible
3 81 (26.73%) Terraform
4 70 (23.10%) Argo
5 68 (22.44%) Prometheus
6 67 (22.11%) Kustomize
7 12 (3.96%) Kibana
8 4 (1.32%) Grafana
9 1 (0.33%) Bugsnag
9 1 (0.33%) Single Sign-On
Vendors
1 89 (29.37%) Google
2 31 (10.23%) Microsoft
3 29 (9.57%) Oracle
4 15 (4.95%) ServiceNow
5 13 (4.29%) Splunk
6 12 (3.96%) Dynatrace
6 12 (3.96%) SAP
7 10 (3.30%) Databricks
8 7 (2.31%) Adobe
8 7 (2.31%) Guidewire
8 7 (2.31%) SolarWinds
9 6 (1.98%) Salesforce
10 4 (1.32%) Nuix
10 4 (1.32%) OpenLink
10 4 (1.32%) Recommind
10 4 (1.32%) Red Hat
10 4 (1.32%) Sybase
10 4 (1.32%) TIBCO
11 3 (0.99%) Atlassian
11 3 (0.99%) Barracuda Networks